

Abstract
Here we examine the effects of both self-reported and independent observer-reported environmental risk indices, the serotonin transporter gene promoter (5HTTLPR) polymorphism, and their interaction on self-esteem. This trait was assessed during early and mid adolescence (mean age = 14 and 16.5, respectively) and young adulthood (mean age = 21.8) in a prospective cohort of 1214 unrelated participants in the Longitudinal Study of Adolescent Health (Add Health). Using structural equation modeling we identified a gene–environment (G × E) interaction using observer-report but not self-report measures of environmental stress exposure during adolescence: 5HTTLPR genotype and observer-reports of home and neighborhood quality (HNQ) during adolescence interacted to predict self-esteem levels in young adulthood (p < .004). Carriers of the s allele who lived in poor HNQ conditions during adolescence reported lower self-esteem in young adulthood than those with a good HNQ during adolescence. In contrast, among individuals with the l/l genotype, adolescent HNQ did not predict adulthood self-esteem. Genes may moderate the effect of adolescent environmental conditions on adulthood self-esteem.
Keywords: Adolescents, Genetic polymorphism, Socioeconomic status, Serotonin, Self-esteem
1. Introduction
Individuals exposed to stressful environments do not consistently exhibit the expected negative health outcomes (Garmezy, 1993; Masten, 1994; Rutter, 1985). To explain this, theories have postulated that heterogeneity in health outcomes occurs due to within person factors (Zimmerman and Arunkumar, 1994). Observed human variation in response to environmental stressors suggests the possibility of gene by environment (G × E) interactions (Gottlieb, 2003; Johnston and Edwards, 2002). Identifying these G × E interactions through empirical research, however, has been difficult (Burmeister et al., 2008; Thomas, 2010b).
The landmark G × E finding presented by Caspi et al. (2003) showed that the effect of stressful life events on depression was stronger among individuals carrying the s allele than among l/l homozygotes of the 5HTTLPR polymorphism (Caspi et al., 2003). Replications of the original Caspi et al. (2003) study provided support for this finding (Kim-Cohen et al., 2006; Zammit and Owen, 2006). However, inconsistencies in the 5HTTLPR effect on psychological outcomes raised some criticisms (Kagan, 2007). The validity of the original study and its subsequent replications were further called into question when a later meta-analysis failed to confirm a 5HTTLPR by stressful life events interaction effect on risk of depression (Risch et al., 2009).
There is a wealth of biological evidence that supports G × E effects on behavior (Caspi et al., 2010; Caspi and Moffitt, 2006; Rutter et al., 2009; Uher and McGuffin, 2008). The 5HTTLPR polymorphism has been repeatedly associated with antidepressant response in mood disorder patients (Serretti et al., 2007), and shown to moderate the effect of early life rearing conditions on behavior in primates (Barr et al., 2003; Bennett et al., 2002; Champoux et al., 2002). Furthermore, laboratory studies suggest that the 5HTTLPR polymorphism influences functional reactivity of the human amygdala—the neuronal system that underlies emotional processing—in the context of stressful life experiences (Hariri et al., 2005, 2002).
The difficulty in identifying 5HTTLPR by stress interaction effects may be due to three methodological limitations of previous studies: (i) an over-reliance on linear models, (ii) reliance on self-report measures of environmental stress, and (iii) modeling depression as the primary outcome, which is a state-like construct, episodic, and unstable over time.
First, G × E studies have traditionally only employed linear regression models, one measured stressor and one genetic polymorphism. However, simple linear models cannot fully capture the complexities of social, behavioral and ecological systems. Multivariate pathway models may be necessary to estimate the true effect of the environment and its interaction with genetics (Thomas, 2010a).
Second, G × E studies typically rely on self-report measures of environmental exposure that often lack validity due to recall bias, and can be influenced by one’s current emotional state. Studies employing objective measures of environmental adversity have more consistently identified G × E effects than those employing self-report measures (Karg et al., 2011; Uher and McGuffin, 2010).
Third, G × E findings have been inconsistent when using depression as the outcome. Mood disorders such as depression are difficult to capture at one time point due to the episodic and state-dependent nature of the disorders (Lewinsohn et al., 1994).
Self-esteem, in contrast, is a trait-like construct that is quantifiable for all individuals at any time point. Furthermore, previous evidence has shown self-esteem to have genetic underpinnings (Neiss et al., 2002) and a twin analysis of the Add Health data suggests that self-esteem in the current sample is stable and highly heritable (Jonassaint, 2010). Therefore, using self-esteem as the observed outcome may yield similar and more robust 5HTTLPR by environmental stress effects than if depression were the outcome.
Self-esteem also serves as a good candidate phenotype and marker of psychological health, given its association (King et al., 1993; Marton et al., 1993; Neiss et al., 2005; Smart and Walsh, 1993) and shared core genetic attributes with depression (Neiss et al., 2009). Self-esteem has been independently associated with several psychological and behavioral health outcomes, including substance use (Brehm and Back, 1968; Walitzer and Sher, 1996), externalizing problem behaviors, aggression (Barnow et al., 2002; Donnellan et al., 2005; Fergusson and Horwood, 2002; Rosenberg et al., 1989) and suicidality (Brent et al., 1986; Dukes and Lorch, 1989; Kienhorst et al., 1990; Overholser et al., 1995; Robbins and Alessi, 1985). In addition, some studies have shown an association between self-esteem and medical outcomes, such as coronary heart disease (Gidron et al., 2006) and even mortality (Stamatakis et al., 2004).
Therefore, using data from the National Longitudinal Study of Adolescent Health (Add Health) (Harris et al., 2003), we sought to further G × E research by examining multiple environmental stressors, the 5HTTLPR polymorphism, and their interaction effect on self-esteem. We acknowledge that apart from the serotonin transporter gene, there are several other candidate genes relevant to the psychological and environmental constructs under investigation. In fact, polymorphisms in six other genes are available in the Add Health data set: dopamine transporter, dopamine receptor, monoamine oxidase A-uVNTR, monoamine oxidase B, dopamine D2 receptor, and cytochromeP450 2A6. However, due to the small number of participants in Add Health with available DNA data in Wave III and the increased risk of false positive results with genetic studies, we have limited this hypothesis driven study to the 5HTTLPR polymorphism in the serotonin transporter gene.
This study introduces methodological approaches that aim to improve upon the previous psychiatric and behavioral G × E studies in three ways: (1) we use structural equation modeling (SEM), a pathway-based statistical technique, to improve upon simple linear models by simultaneously examining the relative contribution of multiple environmental factors—measured directly or as latent variables; (2) we include observer-report, as well as self-report, longitudinal measures of environmental risk exposure; and (3) our outcome of interest, self-esteem, is highly heritable and relatively stable over time.
The aim of the current study was to use an SEM approach to test the effects of self-report and observer-report measures of childhood environmental adversity, 5HTTLPR polymorphisms, and their interaction, on self-esteem in young adulthood. In addition, we aimed to use this study to demonstrate how SEM can be used to test for G × E effects across multiple environments and their interaction. Based on the prior research reviewed above, we hypothesized that using the SEM approach, we could show that the negative effect of environmental adversity on self-esteem is moderated by the 5HTTLPR genotype, with the l/l genotype serving to buffer the effects of the environment on self-esteem trajectory.
2. Methods
2.1. Study sample
Our study examined a cohort of adolescents from Add Health (Harris et al., 2003) that had been followed since middle school through high school—grades 7 through 12—to early adulthood. Data were collected in three waves: I, in September 1994–April 1995; II, April–August 1996; and III, August 2001–April 2002. Our study protocol was approved by the Duke University Institutional Review Board.
The first stage of Add Health data collection in 1994, which involved a confidential in-school survey that asked information about adolescent health and friends, included 90,118 students (grades 7–12). Approximately 80% of the 144 participating schools provided a roster from which about 200 students per school were randomly picked to participate in a 1½ h in-home interview (Wave I). This resulted in a self-weighted sample of 20,745 students aged 11–19 (grades 7–12). In Wave I, the in-home interview involved the target child and one parent or parent-figure, and was conducted between April and December 1995.
Wave II, similar to Wave I in strategy and survey items, was conducted between April and August of 1996. It was conducted on the students who were in 7th–11th grade during the first wave (12th grade students were excluded because they graduated out of high school), and yielded a sample of 14,738 adolescents ages 13–20.
Wave III, the final wave of data collection, was conducted between August 2001 and April 2002. All participants from Wave I were eligible for this sample resulting in a final sample of 15,197 individuals, ages 18–26.
Add Health Wave IV data collection was completed in 2008; however, the genotype data were not available for analyses at the time of this study and may not become available until early-mid 2012.
Here we present Wave I through Wave III data from a sibling pairs’ subsample that provided a saliva sample for DNA analysis in Wave III. The original sibship sample (n = 2330) included full sibling pairs (n = 1249), half sibling pairs (n = 424), and biologically unrelated sibling pairs (n = 657); students who were in 12th grade at Wave I were not included because they graduated out of the study. From the original sample, we made our new data set of 1214 individuals, used for all analyses reported here, by randomly sampling one sibling from each family. This was necessary to ensure independent observations. Data from siblings, due to similarities in genetic and environmental background, are non-independent observations and often correlated. Such non-independence can lead to errors in estimating statistical effects (Stokes et al., 1995).
Gender and race/ethnicity were determined by self-report using census categories: there were five racial/ethnic groups: white, black, non-white Hispanic or Latino, Asian/Pacific Islander, and American Indian/Native American. Age was determined by date of birth.
DNA was extracted by standard techniques from buccal swab samples (Harris et al., 2003). We used data on the diallelic 44-base pair deletion/insertion polymorphism (5HTTLPR) in the 5′ flanking regulatory region of the SLC6A4 gene that was categorized as s/s, s/l, and l/l genotypes. Assay methods were modified from those published by Lesch et al. (1996). Full details on DNA sampling and genotyping procedures can be found on the Add Health website http://www.cpc.unc.edu/projects/addhealth/faqs/aboutdata/index.html/biomark.pdf.
2.2. SEM analyses
Structural equation modeling (SEM) was used in our primary analyses, using statistical software Mplus version 3.0 (Muthen and Muthen, 1998). Three indices were used to evaluate model fit: chi square (χ2); comparative fit index (CFI) with values >.90 representing acceptable fit; and root-mean-square error of approximation (RMSEA), with values of ≤.08 representing acceptable fit (Hu and Bentler, 1999).
Our analysis proceeded in three stages: (1) evaluation of measurement models of self-esteem and environment; (2) testing correlations and patterns of cause–effect relationships between the self-esteem and environmental latent variables over time; and (3) evaluation of G × E effects by testing invariance of the structural paths across genotype groups.
1. Measurement models
Self-esteem
Self-esteem was measured using four items from the Rosenberg Self-esteem Scale (Rosenberg, 1965) available in Add Health at all three waves of data. The items were: 1, you have a lot of good qualities; 2, you have a lot to be proud of; 3, you like yourself just the way you are; 4, you feel like you are doing everything just about right. These items were measured based on a five-point Likert scale, all positively coded. Two additional items were available for Waves I and II only (i.e. “You feel socially accepted”, “You feel loved and wanted”), making a 6-item scale that has been published elsewhere (Swallen et al., 2005). Similar 6-item scales have been used in other large scale population studies and found to be valid (Richardson and Ratner, 2009). At Waves I and II, correlations between the 6-item and the 4-item were r = .97 and r = .96, respectively.
Confirmatory factor analysis (CFA) was used to determine whether these four items measured the same construct, and would adequately represent self-esteem. Using Wave I data, these four items loaded significantly (all > .60) on one factor and, therefore, were modeled as a latent self-esteem variable in our SEM analyses. In a measurement model testing the latent self-esteem variable at each of three time points, all loadings were constrained to be equal across time, without a significant decrease in fit. The error terms were correlated in the measurement model to represent the hypothesis that the unique variances of the four self-esteem items overlap.
The temporal changes in mean self-esteem scores per adolescent were considered according to gender, race/ethnicity, and 5HTTLPR genotype. Sample sizes varied across waves because of late entry or loss to follow-up. Mean values did not significantly differ between participants with complete data across all 3 waves, and those with incomplete data, therefore all available data were used for analyses.
Environmental risk variables
To create latent constructs representing parenting, home support, social support, stressful life events, and home and neighborhood quality (HNQ), all available face valid items (see Supplemental Table available online) from Waves I and II were tested (similar variables were not available at Wave III). Only items with significant loadings of ≥.3 were included in each measurement model. In each measurement model, error terms were correlated for related environmental items. On each of the five variables (described in detail below), higher scores indicated a protective environment, while lower scores indicated environmental risk.
For the latent construct PARENTING, we created two measured variables: parent–child relationship (parent closeness) and parenting style. For parent–child relationship, five items were forced into a 5-point likert scale and averaged. For parenting style, eight items were forced into a 5-point likert scale and averaged.
For HOME SUPPORT, there were three measured items: family understanding, fun together, and attention from family. All items were scored on a 5-point likert scale.
For the latent construct SOCIAL SUPPORT, three measured variables were created: adult support, friend support, and neighborhood support. Adult support was measured by the average of two items scored on a 5-point scale. Friend support was measured by one item scored on a 5-point scale. Neighborhood support was measured by the average of three items, scored on a 3-point scale.
For STRESSFUL EVENTS, two variables were created: exposure to suicide (reported by 209 participants), and exposure to violence (reported by 191 participants). Suicide was based on four binary items (yes = 0 or no = 1) that were summed, and violence was based on six binary items (yes = 0 or no = 1) that were summed.
A latent construct HOME AND NEIGHBORHOOD QUALITY (HNQ), was derived using two items scored on a 4-point scale by the field interviewers (observers) who rated the home and neighborhood conditions of the participants. Item 1 concerned the physical appearance of the respondent’s home: “How well kept is the building in which the respondent lives?” Item 2 concerned the condition of the neighborhood: “How well kept are most of the buildings on the street?”
A second level latent construct labeled ENVIRONMENTAL RISK (ENV) was created using the four latent constructs of parenting, social support, home support, and stressful events (Fig. 1). The Wave I loadings for each of these variables are shown in Fig. 1 (loadings at Wave II were similar). HNQ did not load significantly on ENV and was modeled separately. Item 1 significantly loaded on the latent construct HNQ for Wave I, b = .986 and Wave II, b = .845. Item 2 also significantly loaded on the latent construct HNQ for Wave I, b = .762 and Wave II, b = .826.
Fig. 1.

Latent construct Environmental Risk, showing the 4 latent variables of parenting, social support, home support, and stressful events, and their measured variables. Loadings are shown for Wave I early adolescence, and were similar for Wave II mid adolescence.
2. Environmental cause–effects model
To examine the causal effects and correlations between environmental variables and self-esteem over time, we tested the fit of a cross-lagged panel model that reflected the hypothesized relationships among the latent variables (Fig. 2). This model included the autoregressive effects (where each endogenous variable is influenced by its value at the previous time point), and correlations and cross-time relationships among the latent variables. Non-significant paths in the model were constrained to zero. The most parsimonious model was retained. Finally, we tested whether our model differed by gender or race/ethnicity by testing the fit of a model that was free versus one that was constrained to have equal loadings and coefficients across gender, and then across all four racial/ethnic groups.
Fig. 2.
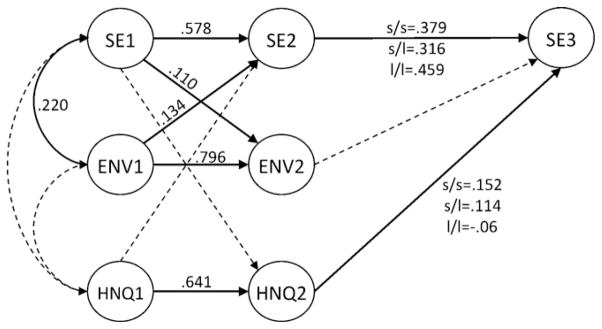
Model testing the effects of environmental factors on self-esteem by genotype group. Variables SE1, SE2, and SE3 represent self-esteem, ENV1 and ENV2 represent environmental risk, and HNQ1 and HNQ2 represent home and neighborhood quality latent variables; 1 = Wave I early adolescence, 2 = Wave II mid adolescence, and 3 = Wave III early adulthood. Solid lines are significant paths. Only paths that differed by genotype show different loadings for each genotype group. All other paths were equal across genotype groups. Dashed lines indicate non-significant paths.
3. Test of moderation by 5HTTLPR genotype
To test for possible moderation by 5HTTLPR genotype, multi-group analyses were used to evaluate the consistency of autoregressive and environmental effects on self-esteem across genotype groups. Model invariance was tested using the three different 5HTTLPR genotypes: l/l, l/s, and s/s (genotype groups were not collapsed, and a general genetic model was assumed). We first confirmed that the factor loadings and measurement error variances were identical across groups. Then a sequence of analyses determined whether path coefficients of interest (for example significant adolescent environmental effects on adulthood self-esteem from stage 2), were equivalent for all three genotype groups. Using a two-degree of freedom χ2 difference test for each path coefficient of interest, we compared a model in which the coefficients were constrained to be equal across genotypes with a model in which coefficients were estimated freely for each genotype. A significant χ2 indicated that the parameter cannot be constrained to be equal across groups and would suggest there is effect moderation by genotype.
2.3. Linear regression analyses
We reran G × E findings from the SEM analyses using linear regression, the traditional approach to testing interaction effects. Self-esteem factor scores were modeled as the dependent variable, and environmental factors scores and 5HTTLPR genotype were modeled as the independent variables. Each model controlled for age, sex, and race/ethnicity. We also tested for potential race/ethnicity and gender moderating effects by including the race/ethnicity interaction term or the gender interaction term in the model.
3. Results
Our sample comprised 1214 participants, for whom data were available for Waves I (n = 1192), II (n = 1138) and III (n = 1199). Their mean ages (and SD) at Waves I early adolescence, Wave II mid adolescence, and Wave III young adulthood, were 14.9 years (±1.6), 16.5 years (±1.7), and 21.8 years (±1.7), respectively.
Mean self-esteem increased significantly as the adolescents got older, from 4.06 (±0.65) at Wave I, to 4.15 (±0.63) at Wave II, and reaching 4.21 (±0.59) at Wave III. However, girls had significantly lower self-esteem than boys at all three waves (p < .001 for each wave) (Table 1).
Table 1.
Self-esteem by gender at Waves I, II and III, in 1214 participants from a subset of the Add Health Study. Data are means and standard deviations (SD).
| Wave | Gender | N | Mean | SD | p-Value |
|---|---|---|---|---|---|
| I | Male | 565 | 4.18 | 0.58 | <.001 |
| Female | 627 | 3.95 | 0.68 | ||
| II | Male | 539 | 4.27 | 0.59 | <.001 |
| Female | 599 | 4.05 | 0.64 | ||
| III | Male | 566 | 4.29 | 0.56 | <.001 |
| Female | 633 | 4.14 | 0.61 |
Two subjects had missing values on one out of four items.
Self-esteem was also significantly associated with race/ethnicity at each of the three waves: Wave I (F = 7.10, p < .01), Wave II (F = 4.33, p < .01), and Wave III (F = 4.04, p < .01). Blacks consistently reported the highest level of self-esteem, while Asians/Pacific Islanders consistently reported the lowest levels of self-esteem (Table 2). Mean self-esteem for whites and Hispanics/Latinos lay between that of the blacks and Asians/Pacific Islanders (Table 2).
Table 2.
Self-esteem by race/ethnicity at Waves I, II and III in 1214 participants from a subset of the Add Health Study. Data are means and standard deviations (SD).
| Race/ethnicity | SE Wave I
|
SE Wave II
|
SE Wave III
|
|||
|---|---|---|---|---|---|---|
| n | Mean (SD) | n | Mean (SD) | n | Mean (SD) | |
| White | 719 | 4.04 (0.65) | 677 | 4.15 (0.64) | 710 | 4.19 (0.58) |
| Black/African American | 205 | 4.21 (0.58) | 188 | 4.3 (0.50) | 206 | 4.33 (0.64) |
| Hispanic or Latino | 206 | 4.1 (0.64) | 195 | 4.13 (0.65) | 204 | 4.25 (0.59) |
| Asian or Pacific Islander | 84 | 3.74 (0.73) | 78 | 3.9 (0.65) | 79 | 4.03 (0.55) |
We excluded three American Indians from analyses.
Significant race/ethnicity differences in self-esteem at Waves I, II, and III (p < .01).
There were significant racial differences across environmental variables (Table 3). At Wave I, black adolescents reported less parental closeness, neighborhood support, fun together with their family and exposure to violence than comparable white adolescents. Black adolescents also had poorer observer-reported home and neighborhood quality than white adolescents. Hispanic adolescents had less self-reported exposure to violence and poorer observer-reported neighborhood quality than white adolescents. At Wave II, black adolescents reported less parental closeness and exposure to violence than white adolescents as well as poorer observer-reported home and neighborhood quality than white adolescents. Hispanic adolescents had less self-reported friend support and exposure to violence than white adolescents.
Table 3.
Measured environmental variable means and standard deviations by race/ethnicity at Waves I and II in 1214 participants.
| Variable | Whites (ref. n = 719) | Blacks (n = 205) | Hispanic/Latino (n = 206) | Asian/Pacific (n = 84) |
|---|---|---|---|---|
| Wave I | ||||
| Parenting style | 4.13 (.67) | 4.22 (.65) | 4.05 (.69) | 4.06 (.64) |
| Parent closeness | 4.49 (.63) | 4.27 (.73)* | 4.37 (.74) | 4.28 (.67)* |
| Adult support | 4.38 (.81) | 4.47 (.82) | 4.32 (.88) | 4.33 (.81) |
| Friend support | 3.59 (.95) | 3.59 (1.21) | 3.38 (1.1) | 3.42 (1.02) |
| Neighborhood support | 4.26 (.75) | 4.08 (.95)* | 4.19 (.88) | 4.21 (.72) |
| Family understanding | 3.58 (.94) | 3.70 (1.05) | 3.77 (1.03) | 3.66 (1.01) |
| Fun together | 3.74 (.92) | 3.97 (1.04)* | 3.59 (1.15) | 3.56 (.99) |
| Attention from family | 3.89 (.86) | 3.96 (.92) | 3.93 (.98) | 3.73 (.93) |
| Exposure to suicide | 4.73 (.62) | 4.81 (.54) | 4.73 (.55) | 4.83 (.45) |
| Exposure to violence | 12.28 (1.39) | 11.84 (1.74)** | 11.60 (2.2)** | 12.11 (1.83) |
| Home quality | 3.43 (.81) | 3.18 (.94)** | 3.31 (.78) | 3.56 (.79) |
| Neighborhood quality | 3.52 (.62) | 3.01 (.95)** | 3.21 (.78)** | 3.56 (.73) |
| Wave II | ||||
| Parenting style | 4.14 (.68) | 4.19 (.62) | 4.06 (.73) | 3.99 (.67) |
| Parent closeness | 4.35 (.62) | 4.19 (.72)* | 4.39 (.66) | 4.34 (.58) |
| Adult support | 4.43 (.8) | 4.42 (.89) | 4.42 (.91) | 4.40 (.84) |
| Friend support | 3.62 (1.) | 3.55 (1.22) | 3.45 (1.12)* | 3.55 (.97) |
| Neighborhood support | 4.37 (.75) | 4.27 (.97) | 4.16 (.92) | 4.25 (.69) |
| Family understanding | 3.59 (.98) | 3.75 (1.09) | 3.62 (1.17) | 3.58 (1.1) |
| Fun together | 3.72 (.97) | 3.83 (1.07) | 3.69 (1.09) | 3.54 (1.07) |
| Attention from family | 3.90 (.88) | 3.98 (1.08) | 3.88 (1.01) | 3.70 (.99) |
| Exposure to suicide | 4.76 (.57) | 4.86 (.49) | 4.77 (.65) | 4.90 (.3) |
| Exposure to violence | 12.75 (.96) | 12.46 (1.48)* | 12.34 (1.44)** | 12.72 (.73) |
| Home quality | 3.37 (.85) | 3.10 (.9)** | 3.28 (.84) | 3.31 (.87) |
| Neighborhood quality | 3.40 (.76) | 3.01 (.87)** | 3.27 (.76) | 3.37 (.79) |
We excluded three American Indians from analyses.
p ≤ .01 represents unadjusted comparison of race/ethnicity group means to whites, the referent group means.
p ≤ .001 represents unadjusted comparison of race/ethnicity group means to whites, the referent group means.
3.1. Measurement models
The self-esteem measurement model fit adequately (χ2 = 410.42, df = 49, CFI = .93, RMSEA = .078 (.072–.086)). The environmental risk measurement model (Fig. 1), with all paths constrained to be equal across Wave I and Wave II, fit adequately (χ2 = 906.29, df = 517, CFI = .945, RMSEA = .044 (.039–.048)). The HNQ latent variable did not load on the latent construct ENVIRONMENTAL RISK.
3.2. Environmental effects model
The final environmental effects model that tested the cross-sectional and longitudinal relationships among the latent variables, demonstrated adequate fit after non-significant paths were fixed to zero (χ2 = 6505.28, CFI = .85, RMSEA = .046 (.044–.048)) (Fig. 2). The model structure and path loadings did not significantly differ by gender or race/ethnicity. Table 4 displays the covariance and reliability coefficients for each measured latent variable.
Table 4.
Inter-item covariance and reliability for constructed self-report environment variables.
| Latent variable | Inter-item covariance | Reliability coefficient |
|---|---|---|
| Parenting | 0.176 | 0.204 |
| Social Support | 0.237 | 0.689 |
| Home Support | 0.252 | 0.581 |
| Stressful Events | 0.464 | 0.754 |
Environmental risk at Wave I (ENV1) was correlated with self-esteem in early adolescence (SE1), and predicted self-esteem 1.5 years later, in mid adolescence (SE2). Similarly, self-esteem in early adolescence (SE1) did have a significant effect on environmental risk 1.5 years later (ENV2). However, environmental risk in mid adolescence (ENV2) did not predict self-esteem 5 years later in young adulthood.
Although HNQ was not related to self-esteem during adolescence (Waves I and II), HNQ in mid adolescence (HNQ2), did have a significant effect on self-esteem 5 years later in young adulthood, at Wave III (β = .082, p = .008). Thus, higher HNQ during adolescence, as indicated by observer-reports of the condition of their home and their neighborhood, was associated with greater self-esteem in early adulthood.
3.3. Test of moderation by genotype
For the 5HTTLPR genotype frequency, there were no significant deviations from the Hardy–Weinberg Equilibrium for the total sample, or within race/ethnic groups (p > .05). Table 5 displays genotype counts by race/ethnicity. The s allele frequencies were significantly higher for whites (41.5%) than for blacks (28.1%; p < .001) but the s allele frequencies for whites were lower when compared to Latinos (50.0%; p = .02) and Asian/Pacific Islander (68.7%; p < .001). In the multi-group analyses, there was a significant main effect of 5HTTLPR genotype group on self-esteem (SE3) in young adulthood (F = 3.16; p < .02). Mean self-esteem (and SD) was higher in the l/l genotype group, 4.29 (±0.55), than the s/l, 4.18 (±0.58), and the s/s 4.15 (±0.68) genotype groups, while the s/l and s/s group did not differ.
Table 5.
Genotype frequencies for each race-ethnicity group and the total sample.
| Genotype | Race/ethnicity
|
||||
|---|---|---|---|---|---|
| White | Black | Hisp/Latino | Asian | Total | |
| ss (%) | 111 (16.6) | 19 (10.2) | 46 (24.3) | 33 (47.1) | 209 (18.8) |
| sl (%) | 327 (48.9) | 69 (37.1) | 95 (50.3) | 32 (45.7) | 523 (47) |
| ll (%) | 231 (34.5) | 98 (52.7) | 48 (25.4) | 5 (7.1) | 382 (34.3) |
| Total | 669 | 186 | 189 | 70 | 1114 |
Genetic differences in self-esteem stability were evident. The autoregressive paths between self-esteem in mid adolescence and young adulthood (SE2 and SE3), differed significantly by 5HTTLPR genotype (χ2 = 5.66, df = 2, p < .05) (Fig. 2). This effect showed that for the l/l genotype group, self-esteem was more stable across time (larger effect of SE2 on SE3; β = .459) than was the case in s allele carriers (s/s, β = .379 and s/l, β = .316).
Our hypothesis that the effect of adolescent environment on adulthood self-esteem differed significantly by 5HTTLPR genotype was supported using the SEM approach. As predicted, the effect of HNQ2 on SE3 significantly differed by genotype group (χ2 = 10.98, df = 2, p = .004). For s allele carriers, HNQ in mid adolescence was positively associated with self-esteem in young adulthood (s/s, β = .152, p < .001 and s/l, β = .114, p < .001); in contrast, for the l/l genotype group, HNQ in mid adolescence did not predict self-esteem in young adulthood (β =−.06, p = .10). Collapsing across the s/l and s/s genotype groups did not significantly improve model fit.
The HNQ by 5HTTLPR interaction effect on self-esteem in young adulthood (Wave III) was also significant in the multiple linear regression model (Table 6). Despite differences in HNQ at Waves I and II (Table 3) neither race/ethnicity nor gender was a moderator of the HNQ × 5HTTLPR effect on self-esteem. To further confirm and illustrate that these effects were similar across race/ethnicity groups, we modeled the HNQ × 5HTTLPR effect separately for the white and black groups. For whites, although the HNQ × 5HTTLPR effect was not significant (p = .256), the pattern of effects was similar to that seen for the total sample (Fig. 3). For blacks, the HNQ × 5HTTLPR effect was significant (p = .007) with a pattern of scores that was also similar to that of the total sample.
Table 6.
Multiple linear regression model testing home and neighborhood quality (HNQ) by 5HTTLPR polymorphism effect on adulthood self-esteem.
| a Variables | Coef. | Std. err. | t | p > |t| | 95% conf. interval | Model R2 |
|---|---|---|---|---|---|---|
| HNQ | 0.312 | 0.102 | 3.07 | .002 | 0.112 to 0.511 | 0.034 |
| 5HTTLPR | 0.141 | 0.039 | 3.6 | <.001 | 0.064 to 0.218 | |
| HNQ × 5HTLPR | −0.111 | 0.044 | −2.52 | .012 | −0.198 to −0.025 | |
| Race | 0.032 | 0.029 | 1.12 | .261 | −0.024 to 0.089 | |
| Sex | −0.208 | 0.055 | −3.76 | <.001 | −0.316 to −0.099 |
List-wise deletion procedure was used to select observations for inclusion in the model; N = 1049.
Fig. 3.

Multiple linear regression analysis estimating the association between Wave II adolescent home and neighborhood quality factor score (average age = 16.5) and Wave III adulthood self-esteem factor score (average age = 21.8) as a function of the 3 5HTTLPR genotypes (l/l, s/l, and s/s), adjusting for age, gender and race.
4. Discussion
The current study demonstrates the advantages of testing for G × E effects in pathway-based statistical methods that model observer-report as well as self-report measures of environmental risk and outcomes that are trait-like and stable over-time. Using this approach we identified a G × E effect on self-esteem that is consistent with the generic hypothesis first proposed by Caspi et al. (2003) that the 5HTTLPR polymorphism moderates the effect of childhood environmental stress on psychological outcomes.
Using SEM allowed us to investigate the interplay among multiple environmental measures, cross-sectional correlations, direct and indirect longitudinal effects, and G × E interactions. This pathway-based model approach provided important insights into the complex association between multiple environmental factors, genetics and self-esteem development that would not have been possible using a univariate method. Although this approach has not yet been used in psychiatry, one study used SEM to test for G × E effects on coronary heart disease (CHD) (Mi et al., 2011). This study identified several risk factors for CHD and two G × E interaction effects that were not found when using a traditional univariate method with the same data (Mi et al., 2011).
Another advantage of the present study was our ability to test simultaneously both independent observer-reports of physical neighborhood and household quality and self-report measures of environmental risk. By including observer-reports, a more objective measure of environmental exposure than self-report, we were able to identify patterns of effects that would not have been found if we had examined only self-reports of environmental exposure. Our findings for the effect of self-report environmental risk on self-esteem in adolescence were consistent with previous studies showing that lower social support (Harter, 1990; Leary and Downs, 1995), negative parenting (Kernis et al., 2000) and stressful life events (Masten et al., 1999) contribute to lower self-esteem. However, we found no effect of self-report environmental risk on self-esteem five years later in adulthood. In contrast, independent observer-reports of physical home and neighborhood conditions during adolescence only predicted self-esteem five years later in young adulthood. This is the first study, to our knowledge, to show a differential environmental effect by age period, on a psychological construct.
Several factors may explain the non-significant effect of adolescent self-reported environmental risk on adulthood self-esteem. First, a review of previous literature found that the association between SES and health behaviors during adolescence is not as robust and consistent as that for adulthood (Hanson and Chen, 2007). Thus, environmental risk measured during adulthood may be a more accurate or stronger predictor of self-esteem and related behavioral patterns than environmental risk measured during adolescence. Second, due to previous experiences, adolescents from low SES environments may interpret ambiguous situations more negatively than high SES adolescents (Chen et al., 2004). This may have led to reporter bias in the self-report environmental stress-ors but would not have been reflected the observer-reports. Third, self-reported measures are liable to be influenced by the individual’s affective state. For instance, depressed individuals are more likely to elaborate on negative experiences than those who are not depressed (Gotlib and Joormann, 2010). Such recall bias could account for previous failures to confirm 5HTTLPR by stressful life events effects on depression. Indeed, stronger interaction effects have been identified when using objective rather than self-report measures of environmental exposure (Karg et al., 2011).
There is evidence that socioeconomic status has cumulative rather than cross-sectional effects on psychological health (Lynch et al., 1997), which is consistent with our findings. Given that we do not have measures of socioeconomic status in Wave III, we are unable to test this hypothesis. To advance our understanding of psychological and psychiatric outcomes, future studies will benefit from having environmental risk measured during adulthood, as well as adolescence, and from including more objective measures of environmental risk (Kagan, 2007). Findings from the current study will need to be replicated before conclusions can be drawn regarding the mechanisms driving the differential effects of environmental exposures on self-esteem in adolescence and adulthood.
For its measureable outcome, our study used self-esteem, a trait that is relatively stable over-time, and associated with several psychiatric disorders, including depression. Consistent with studies showing that self-esteem stability is heritable (Jonassaint, 2010; Neiss et al., 2002), we found that the l/l 5HTTLPR genotype was associated with higher self-esteem stability, from adolescence to young adulthood, than were the s/s or s/l genotypes. This is an interesting finding given the body of research showing self-esteem stability is an important predictor of psychological health (Holye et al., 1999; Kernis, 2005). Further, the l/l genotype not only conferred greater self-esteem stability but also was associated with a significantly higher level of self-esteem in young adulthood than the s/s and s/l genotypes. Self-esteem level and stability have been found to function independently and should be considered in concert as predictors of psychological outcomes (Kernis, 2005). However, in contrast to previous hypotheses (Neiss et al., 2006), our findings suggest they carry common rather than differing genetic underpinnings. Both self-esteem level and stability were associated with the 5HTTLPR polymorphism, which indicates that they share at least one common genetic component. Because only one polymorphism was evaluated in this study, it remains possible that additional genetic variants may be differentially associated with level and stability of self-esteem—questions that can be addressed in future research.
Of particular note is our finding that, independently of race/ethnicity differences in HNQ at Waves I and II, the 5HTTLPR polymorphism moderates the effect of the observer-reported HNQ experienced in adolescence on the self-esteem of the individual as a young adult, 5 years later. To our knowledge this is the first report of a G × E effect for self-esteem. These findings parallel what has been observed in the depression literature (Karg et al., 2011; Uher and McGuffin, 2010) and may inform questions regarding the validity of the 5HTTLPR by stress effect on depression that has failed to replicate in several studies (Munafo et al., 2009; Risch et al., 2009). In one such study, Fergusson et al. (2011) failed to identify a 5HTTLPR by stress effect after examining 13 measure of adverse life events and four mental health outcomes in a large sample similar to that of the original Caspi et al. (2003) study. Fergusson et al. (2011) included no objective measures of early life environment, relied on episodic depressive and anxiety symptoms for their outcome, ignored variable measurement error and conducted 104 linear regression analyses to test their main hypothesis. These types of limitations, characteristic of the 5HTTLPR-stress-depression literature, may contribute to the heterogeneity in findings. The current study, in contrast, mitigates several of these limitations by including objective measures of the environmental stressor (independent observer-reports of neighborhood and housing quality), using an SEM approach, and modeling a dependent variable that shows strong heritability and stability over time. Similar to Fergusson et al. (2011) the current study tests multiple measures of environmental risk (i.e. 11) measured longitudinally; however, the current method accomplishes this using only one comprehensive model that describes the interrelation among independent and dependent variables, accounts for measurement error and detected a G × E effect that is consistent with the literature. Thus, although 5HTTLPR may indeed moderate the effects of environmental stress on psychopathology, current methodological approaches to G × E research may be limiting our ability to detect these effects (Blakely and Veenstra-VanderWeele, 2011).
The current study has some limitations. First, the sample size was relatively small for a complex gene–environment association study using SEM. Larger studies are needed to test more model parameters, and to identify smaller and non-hypothesis driven G × E effects.
Second, this study was also limited by the measures available in the Add Health data set. It should be noted that some of our environmental constructs were not measured sufficiently. These limitations in reliability and validity (Table 4) might have constrained the power to detect associations with self-esteem and 5HTTLPR gene variants. Further, only the diallelic 5HTTLPR was genotyped in the Add Health Wave III sibship sample, and thus there may be some genotype misclassification errors because the functional rs25531 A>G SNP in the 5HTTLPR L allele (Hu et al., 2006) was not genotyped in our sample. However, a previous study showing a stress by 5HTTLPR effect on post-traumatic stress disorder, found no difference in this effect when comparing the triallelic to the diallelic genotypes (Xie et al., 2009).
Other candidate genes included in the Add Health data set could have been tested in our analyses, namely the dopamine transporter, dopamine receptor, monoamine oxidase A-uVNTR, monoamine oxidase B, dopamine D2 receptor, and cytochromeP450 2A6. However, given the small sample size, adding additional analyses that were outside the specific hypothesis tested here may have lead to spurious findings. Or, alternatively, we may not have detected effects that were present due to low power.
Third, self-report race/ethnicity is not the optimal control for population stratification since broad racial/ethnic categories may not capture true genetic population substructure. A more accurate test of population stratification would be to use ancestry informative markers or principle components analysis of genome wide markers. We were unable to test a race/ethnicity by genotype multi-group analyses in SEM due to computation convergence problems. Thus, the most important sensitivity analyses of the paper, the G × E effect corrected for race/ethnicity, was based on a GLM and not based on a SEM approach. However, controlling for self-report race/ethnicity in our GLM analyses, the race/ethnicity × HNQ × 5HTTLPR effect was not significant. Further, we examined the G × E effect separately in whites and blacks. These analyses suggest that the HNQ × 5HTTLPR pattern of effect does not differ between whites and blacks. Overall, the HNQ × 5HTTLPR effect on self-esteem appears to affect all race/ethnicity groups in this sample similarly.
To our knowledge, this hypothesis driven study is the first to demonstrate that SEM methods can be used to capture the complex interplay between multiple environmental and genetic factors in psychiatry. Confirming the importance of using more objective measures of environmental exposures that are directly observed by an independent rater, our study builds upon and extends a body of research demonstrating a 5HTTLPR gene by stress interaction effect on depression. Future epidemiological studies should capitalize on the advantages of employing pathway-based statistical models that allow us to test networks of variables. Indeed, the current study adds to the growing literature showing that complex traits are the result of multiple environmental and genetic factors operating synergistically.
Supplementary Material
Acknowledgments
This research uses data from Add Health, a program project designed by J. Richard Udry, Peter S. Bearman, and Kathleen Mullan Harris, and funded by a grant P01-HD31921 from the Eunice Kennedy Shriver National Institute of Child Health and Human Development, with cooperative funding from 17 other agencies. Special acknowledgment is due Ronald R. Rindfuss and Barbara Entwisle for assistance in the original design. Persons interested in obtaining data files from Add Health should contact Add Health, Carolina Population Center, 123W. Franklin Street, Chapel Hill, NC 27516-2524 (addhealth@unc.edu). No direct support was received from grant P01-HD31921 for this analysis.
This research was supported by the National Institute of Child and Human Development grant P01-HD31921, by the National Heart, Lung and Blood Institute grant P01-HL36587, and by the Duke Behavioral Medicine Research Center.
Abbreviations
- G × E
gene–environment interaction
- 5HTTLPR
5-hydroxytryptamine-linked polymorphic region
- HNQ
home and neighborhood quality
- SEM
structural equation modeling
- Add Health
the National Longitudinal Study of Adolescent Health
Appendix A. Supplementary data
Supplementary data associated with this article can be found, in the online version, at http://dx.doi.org/10.1016/j.biopsycho.2012.05.004.
Footnotes
Conflict of interest
Redford Williams holds U.S. patent 7,371,522 on the use of the 5HTTLPR I allele as a marker of increased CHD risk in persons exposed to stressful life situations.
References
- Barnow S, Schuckit MA, Lucht M, John U, Freyberger HJ. The importance of a positive family history of alcoholism, parental rejection and emotional warmth, behavioral problems and peer substance use for alcohol problems in teenagers: a path analysis. Journal of Studies on Alcohol. 2002;63 (3):305–315. doi: 10.15288/jsa.2002.63.305. [DOI] [PubMed] [Google Scholar]
- Barr CS, Newman TK, Becker ML, Champoux M, Lesch KP, Suomi SJ, et al. Serotonin transporter gene variation is associated with alcohol sensitivity in rhesus macaques exposed to early-life stress. Alcoholism Clinical and Experimental Research. 2003;27 (5):812–817. doi: 10.1097/01.ALC.0000067976.62827.ED. [DOI] [PubMed] [Google Scholar]
- Bennett AJ, Lesch KP, Heils A, Long JC, Lorenz JG, Shoaf SE, et al. Early experience and serotonin transporter gene variation interact to influence primate CNS function. Molecular Psychiatry. 2002;7 (1):118–122. doi: 10.1038/sj.mp.4000949. [DOI] [PubMed] [Google Scholar]
- Blakely RD, Veenstra-VanderWeele J. Genetic indeterminism, the 5-HTTLPR, and the paths forward in neuropsychiatric genetics. Archives of General Psychiatry. 2011;68 (5):457–458. doi: 10.1001/archgenpsychiatry.2011.34. [DOI] [PMC free article] [PubMed] [Google Scholar]
- Brehm ML, Back KW. Self image and attitudes toward drugs. Journal of Personality. 1968;36 (2):299–314. doi: 10.1111/j.1467-6494.1968.tb01476.x. [DOI] [PubMed] [Google Scholar]
- Brent DA, Kalas R, Edelbrock C, Costello AJ, Dulcan MK, Conover N. Psychopathology and its relationship to suicidal ideation in childhood and adolescence. Journal of the American Academy of Child and Adolescent Psychiatry. 1986;25 (5):666–673. doi: 10.1016/s0002-7138(09)60292-2. [DOI] [PubMed] [Google Scholar]
- Burmeister M, McInnis MG, Zollner S. Psychiatric genetics: progress amid controversy. Nature Reviews Genetics. 2008;9 (7):527–540. doi: 10.1038/nrg2381. [DOI] [PubMed] [Google Scholar]
- Caspi A, Hariri AR, Holmes A, Uher R, Moffitt TE. Genetic sensitivity to the environment: the case of the serotonin transporter gene and its implications for studying complex diseases and traits. American Journal of Psychiatry. 2010;167 (5):509–527. doi: 10.1176/appi.ajp.2010.09101452. [DOI] [PMC free article] [PubMed] [Google Scholar]
- Caspi A, Moffitt TE. Gene–environment interactions in psychiatry: joining forces with neuroscience. Nature Reviews Neuroscience. 2006;7 (7):583–590. doi: 10.1038/nrn1925. [DOI] [PubMed] [Google Scholar]
- Caspi A, Sugden K, Moffitt TE, Taylor A, Craig IW, Harrington H, et al. Influence of life stress on depression: moderation by a polymorphism in the 5-HTT gene. Science. 2003;301 (5631):386–389. doi: 10.1126/science.1083968. [DOI] [PubMed] [Google Scholar]
- Champoux M, Bennett A, Shannon C, Higley JD, Lesch KP, Suomi SJ. Serotonin transporter gene polymorphism, differential early rearing, and behavior in rhesus monkey neonates. Molecular Psychiatry. 2002;7 (10):1058–1063. doi: 10.1038/sj.mp.4001157. [DOI] [PubMed] [Google Scholar]
- Chen E, Langer DA, Raphaelson YE, Matthews KA. Socioeconomic status and health in adolescents: the role of stress interpretations. Child Development. 2004;75 (4):1039–1052. doi: 10.1111/j.1467-8624.2004.00724.x. [DOI] [PubMed] [Google Scholar]
- Donnellan MB, Trzesniewski KH, Robins RW, Moffitt TE, Caspi A. Low self-esteem is related to aggression, antisocial behavior, and delinquency. Psychological Science. 2005;16 (4):328–335. doi: 10.1111/j.0956-7976.2005.01535.x. [DOI] [PubMed] [Google Scholar]
- Dukes RL, Lorch B. The effects of school, family, self-concept, and deviant behaviour on adolescent suicide ideation. Journal of Adolescence. 1989;12 (3):239–251. doi: 10.1016/0140-1971(89)90075-4. [DOI] [PubMed] [Google Scholar]
- Fergusson DM, Horwood LJ. Male and female offending trajectories. Development and Psychopathology. 2002;14 (1):159–177. doi: 10.1017/s0954579402001098. [DOI] [PubMed] [Google Scholar]
- Fergusson DM, Horwood LJ, Miller AL, Kennedy MA. Life stress, 5-HTTLPR and mental disorder: findings from a 30-year longitudinal study. British Journal of Psychiatry. 2011;198 (2):129–135. doi: 10.1192/bjp.bp.110.085993. [DOI] [PMC free article] [PubMed] [Google Scholar]
- Garmezy N. Children in poverty: resilience despite risk. Psychiatry. 1993;56 (1):127–136. doi: 10.1080/00332747.1993.11024627. [DOI] [PubMed] [Google Scholar]
- Gidron Y, Levy A, Cwikel J. Psychosocial and reported inflammatory disease correlates of self-reported heart disease in women from South of Israel. Women and Health. 2006;44 (4):25–40. doi: 10.1300/j013v44n04_02. [DOI] [PubMed] [Google Scholar]
- Gotlib IH, Joormann J. Cognition and depression: current status and future directions. Annual Review of Clinical Psychology. 2010;6:285–312. doi: 10.1146/annurev.clinpsy.121208.131305. [DOI] [PMC free article] [PubMed] [Google Scholar]
- Gottlieb G. On making behavioral genetics truly developmental. Human Development. 2003;46 (6):337–355. [Google Scholar]
- Hanson MD, Chen E. Socioeconomic status and health behaviors in adolescence: a review of the literature. Journal of Behavioral Medicine. 2007;30 (3):263–285. doi: 10.1007/s10865-007-9098-3. [DOI] [PubMed] [Google Scholar]
- Hariri AR, Drabant EM, Munoz KE, Kolachana BS, Mattay VS, Egan MF, et al. A susceptibility gene for affective disorders and the response of the human amygdala. Archives of General Psychiatry. 2005;62 (2):146–152. doi: 10.1001/archpsyc.62.2.146. [DOI] [PubMed] [Google Scholar]
- Hariri AR, Mattay VS, Tessitore A, Kolachana B, Fera F, Goldman D, et al. Serotonin transporter genetic variation and the response of the human amygdala. Science. 2002;297 (5580):400–403. doi: 10.1126/science.1071829. [DOI] [PubMed] [Google Scholar]
- Harris KM, Florey F, Tabor J, Bearman PS, Jones J, Udry JR. The National Longitudinal Study of Adolescent Health: Research Design. 2003 Retrieved February, 2008, from http://www.cpc.unc.edu/projects/addhealth/design.
- Harter S. Causes, correlates, and the functional role of global self-worth: a lifespan perspective. In: Sternberg RJ, Kolligan J, editors. Competence Considered. Yale University Press; New Haven, CT: 1990. [Google Scholar]
- Holye RH, Kernis MH, Leary MR, Baldwin MW. Selfhood: Identity, Esteem, Regulation. Westview Press; Colorado: 1999. [Google Scholar]
- Hu L, Bentler PM. Cutoff criteria for fit indexes in covariance structure analysis: conventional criteria versus new alternatives. Structural Equation Modeling. 1999;6 (1):1–55. [Google Scholar]
- Hu XZ, Lipsky RH, Zhu GS, Akhtar LA, Taubman J, Greenberg BD, et al. Serotonin transporter promoter gain-of-function genotypes are linked to obsessive–compulsive disorder. American Journal of Human Genetics. 2006;78 (5):815–826. doi: 10.1086/503850. [DOI] [PMC free article] [PubMed] [Google Scholar]
- Johnston TD, Edwards L. Genes, interactions, and the development of behavior. Psychological Review. 2002;109 (1):26–34. doi: 10.1037/0033-295x.109.1.26. [DOI] [PubMed] [Google Scholar]
- Jonassaint CR. The heritability of self-esteem from adolescence to young adulthood. The New School Psychology Bulletin. 2010;7 (1):1–15. [Google Scholar]
- Kagan J. A trio of concerns. Perspectives on Psychological Science. 2007;2 (4):361–376. doi: 10.1111/j.1745-6916.2007.00049.x. [DOI] [PubMed] [Google Scholar]
- Karg K, Burmeister M, Shedden K, Sen S. The serotonin transporter promoter variant (5-HTTLPR), stress, and depression meta-analysis revisited: evidence of genetic moderation. Archives of General Psychiatry. 2011;68 (5):444–454. doi: 10.1001/archgenpsychiatry.2010.189. [DOI] [PMC free article] [PubMed] [Google Scholar]
- Kernis MH. Measuring self-esteem in context: the importance of stability of self-esteem in psychological functioning. Journal of Personality. 2005;73 (6):1569–1605. doi: 10.1111/j.1467-6494.2005.00359.x. [DOI] [PubMed] [Google Scholar]
- Kernis MH, Brown AC, Brody GH. Fragile self-esteem in children and its associations with perceived patterns of parent–child communication. Journal of Personality. 2000;68 (2):225–252. doi: 10.1111/1467-6494.00096. [DOI] [PubMed] [Google Scholar]
- Kienhorst CW, de Wilde EJ, Van den Bout J, Diekstra RF, Wolters WH. Characteristics of suicide attempters in a population-based sample of Dutch adolescents. British Journal of Psychiatry. 1990;156:243–248. doi: 10.1192/bjp.156.2.243. [DOI] [PubMed] [Google Scholar]
- Kim-Cohen J, Caspi A, Taylor A, Williams B, Newcombe R, Craig IW, et al. MAOA, maltreatment, and gene–environment interaction predicting children’s mental health: new evidence and a meta-analysis. Molecular Psychiatry. 2006;11 (10):903–913. doi: 10.1038/sj.mp.4001851. [DOI] [PubMed] [Google Scholar]
- King CA, Naylor MW, Segal HG, Evans T, Shain BN. Global self-worth, specific self-perceptions of competence, and depression in adolescents. Journal of the American Academy of Child and Adolescent Psychiatry. 1993;32 (4):745–752. doi: 10.1097/00004583-199307000-00007. [DOI] [PubMed] [Google Scholar]
- Leary MR, Downs DL. Interpersonal functions of the self-esteem motive: the self-esteem system as a sociometer. In: Kernis MH, editor. Efficacy, Agency, and Self-esteem. Plenum; New York: 1995. pp. 123–144. [Google Scholar]
- Lesch KP, Bengel D, Heils A, Sabol SZ, Greenberg BD, Petri S, et al. Association of anxiety-related traits with a polymorphism in the serotonin transporter gene regulatory region. Science. 1996;274 (5292):1527–1531. doi: 10.1126/science.274.5292.1527. [DOI] [PubMed] [Google Scholar]
- Lewinsohn PM, Clarke GN, Seeley JR, Rohde P. Major depression in community adolescents: age at onset, episode duration, and time to recurrence. Journal of the American Academy of Child and Adolescent Psychiatry. 1994;33 (6):809–818. doi: 10.1097/00004583-199407000-00006. [DOI] [PubMed] [Google Scholar]
- Lynch JW, Kaplan GA, Shema SJ. Cumulative impact of sustained economic hardship on physical, cognitive, psychological, and social functioning. New England Journal of Medicine. 1997;337 (26):1889–1895. doi: 10.1056/NEJM199712253372606. [DOI] [PubMed] [Google Scholar]
- Marton P, Connolly J, Kutcher S, Korenblum M. Cognitive social skills and social self-appraisal in depressed adolescents. Journal of the American Academy of Child and Adolescent Psychiatry. 1993;32 (4):739–744. doi: 10.1097/00004583-199307000-00006. [DOI] [PubMed] [Google Scholar]
- Masten AS. Resilience in individual development: successful adaptation despite risk and adversity. In: Wang M, Gordon EW, editors. Educational Resilience in Inner-city America. Erlbaum; Mahwah, NJ: 1994. [Google Scholar]
- Masten AS, Hubbard JJ, Gest SD, Tellegen A, Garmezy N, Ramirez M. Competence in the context of adversity: pathways to resilience and maladaptation from childhood to late adolescence. Development and Psychopathology. 1999;11 (1):143–169. doi: 10.1017/s0954579499001996. [DOI] [PubMed] [Google Scholar]
- Mi X, Eskridge KM, George V, Wang D. Structural equation modeling of gene–environment interactions in coronary heart disease. Annals of Human Genetics. 2011;75 (2):255–265. doi: 10.1111/j.1469-1809.2010.00634.x. [DOI] [PubMed] [Google Scholar]
- Munafo MR, Durrant C, Lewis G, Flint J. Gene × environment interactions at the serotonin transporter locus. Biological Psychiatry. 2009;65 (3):211–219. doi: 10.1016/j.biopsych.2008.06.009. [DOI] [PubMed] [Google Scholar]
- Muthen L, Muthen B. Mplus User’s Guide. 3. Muthen & Muthen; Los Angeles, CA: 1998. [Google Scholar]
- Neiss MB, Sedikides C, Stevenson J. Self-esteem: a behavioral genetic perspective. European Journal of Personality. 2002;16 (5):351–367. [Google Scholar]
- Neiss MB, Sedikides C, Stevenson J. Genetic influences on level and stability of self-esteem. Self and Identity. 2006;5 (3):247–266. [Google Scholar]
- Neiss MB, Stevenson J, Legrand LN, Iacono WG, Sedikides C. Self-esteem, negative emotionality, and depression as a common temperamental core: a study of mid-adolescent twin girls. Journal of Personality. 2009;77 (2):327–346. doi: 10.1111/j.1467-6494.2008.00549.x. [DOI] [PMC free article] [PubMed] [Google Scholar]
- Neiss MB, Stevenson J, Sedikides C, Kumashiro M, Finkel EJ, Rusbult CE. Executive self, self-esteem, and negative affectivity: relations at the phenotypic and genotypic level. Journal of Personality and Social Psychology. 2005;89 (4):593–606. doi: 10.1037/0022-3514.89.4.593. [DOI] [PubMed] [Google Scholar]
- Overholser JC, Adams DM, Lehnert KL, Brinkman DC. Self-esteem deficits and suicidal tendencies among adolescents. Journal of the American Academy of Child and Adolescent Psychiatry. 1995;34 (7):919–928. doi: 10.1097/00004583-199507000-00016. [DOI] [PubMed] [Google Scholar]
- Richardson CG, Ratner PA. Further support for multidimensionality within the Rosenberg Self-Esteem Scale. Current Psychology. 2009;28:98–114. [Google Scholar]
- Risch N, Herrell R, Lehner T, Liang KY, Eaves L, Hoh J, et al. Interaction between the serotonin transporter gene (5-HTTLPR), stressful life events, and risk of depression a meta-analysis. Journal of the American Medical Association. 2009;301 (23):2462–2471. doi: 10.1001/jama.2009.878. [DOI] [PMC free article] [PubMed] [Google Scholar]
- Robbins DR, Alessi NE. Depressive symptoms and suicidal behavior in adolescents. American Journal of Psychiatry. 1985;142 (5):588–592. doi: 10.1176/ajp.142.5.588. [DOI] [PubMed] [Google Scholar]
- Rosenberg M. Society and the Adolescent Self-image. Princeton University Press; Princeton, NJ: 1965. [Google Scholar]
- Rosenberg M, Schooler C, Schoenbach C. Self-esteem and adolescent problems: modeling reciprocal effects. American Sociological Review. 1989;54 (6):1004–1018. [Google Scholar]
- Rutter M. Resilience in the face of adversity. Protective factors and resistance to psychiatric disorder. British Journal of Psychiatry. 1985;147:598–611. doi: 10.1192/bjp.147.6.598. [DOI] [PubMed] [Google Scholar]
- Rutter M, Thaper A, Pickles A. Gene–environment interactions: biologically valid pathways or artifact? Archives of General Psychiatry. 2009;66 (12):1287–1289. doi: 10.1001/archgenpsychiatry.2009.167. [DOI] [PubMed] [Google Scholar]
- Serretti A, Kato M, De Ronchi D, Kinoshita T. Meta-analysis of serotonin transporter gene promoter polymorphism (5-HTTLPR) association with selective serotonin reuptake inhibitor efficacy in depressed patients. Molecular Psychiatry. 2007;12 (3):247–257. doi: 10.1038/sj.mp.4001926. [DOI] [PubMed] [Google Scholar]
- Smart RG, Walsh GW. Predictors of depression in street youth. Adolescence. 1993;28 (109):41–53. [PubMed] [Google Scholar]
- Stamatakis KA, Lynch J, Everson SA, Raghunathan T, Salonen JT, Kaplan GA. Self-esteem and mortality: prospective evidence from a population-based study. Annals of Epidemiology. 2004;14 (1):58–65. doi: 10.1016/s1047-2797(03)00078-4. [DOI] [PMC free article] [PubMed] [Google Scholar]
- Stokes ME, Davis CS, Koch GG. Categorical Data Analysis Using SAS. SAS Institute, Inc; Cary, NC: 1995. [Google Scholar]
- Swallen KC, Reither EN, Haas SA, Meier AM. Overweight, obesity, and health-related quality of life among adolescents: the National Longitudinal Study of Adolescent Health. Pediatrics. 2005;115 (2):340–347. doi: 10.1542/peds.2004-0678. [DOI] [PubMed] [Google Scholar]
- Thomas D. Gene–environment-wide association studies: emerging approaches. Nature Reviews Genetics. 2010a;11 (4):259–272. doi: 10.1038/nrg2764. [DOI] [PMC free article] [PubMed] [Google Scholar]
- Thomas D. Methods for investigating gene–environment interactions in candidate pathway and genome-wide association studies. Annual Review of Public Health. 2010b;31:21–36. doi: 10.1146/annurev.publhealth.012809.103619. [DOI] [PMC free article] [PubMed] [Google Scholar]
- Uher R, McGuffin P. The moderation by the serotonin transporter gene of environmental adversity in the aetiology of mental illness: review and methodological analysis. Molecular Psychiatry. 2008;13 (2):131–146. doi: 10.1038/sj.mp.4002067. [DOI] [PubMed] [Google Scholar]
- Uher R, McGuffin P. The moderation by the serotonin transporter gene of environmental adversity in the etiology of depression: 2009 update. Molecular Psychiatry. 2010;15 (1):18–22. doi: 10.1038/mp.2009.123. [DOI] [PubMed] [Google Scholar]
- Walitzer KS, Sher KJ. A prospective study of self-esteem and alcohol use disorders in early adulthood: evidence for gender differences. Alcoholism, Clinical and Experimental Research. 1996;20 (6):1118–1124. doi: 10.1111/j.1530-0277.1996.tb01956.x. [DOI] [PubMed] [Google Scholar]
- Xie P, Kranzler HR, Poling J, Stein MB, Anton RF, Brady K, et al. Interactive effect of stressful life events and the serotonin transporter 5-HTTLPR genotype on posttraumatic stress disorder diagnosis in 2 independent populations. Archives of General Psychiatry. 2009;66 (11):1201–1209. doi: 10.1001/archgenpsychiatry.2009.153. [DOI] [PMC free article] [PubMed] [Google Scholar]
- Zammit S, Owen MJ. Stressful life events, 5-HTT genotype and risk of depression. British Journal of Psychiatry. 2006;188 (3):199–201. doi: 10.1192/bjp.bp.105.020644. [DOI] [PubMed] [Google Scholar]
- Zimmerman MA, Arunkumar R. Resiliency research: implications for schools and policy. Social Policy Report. 1994;8:1–18. [Google Scholar]
Associated Data
This section collects any data citations, data availability statements, or supplementary materials included in this article.