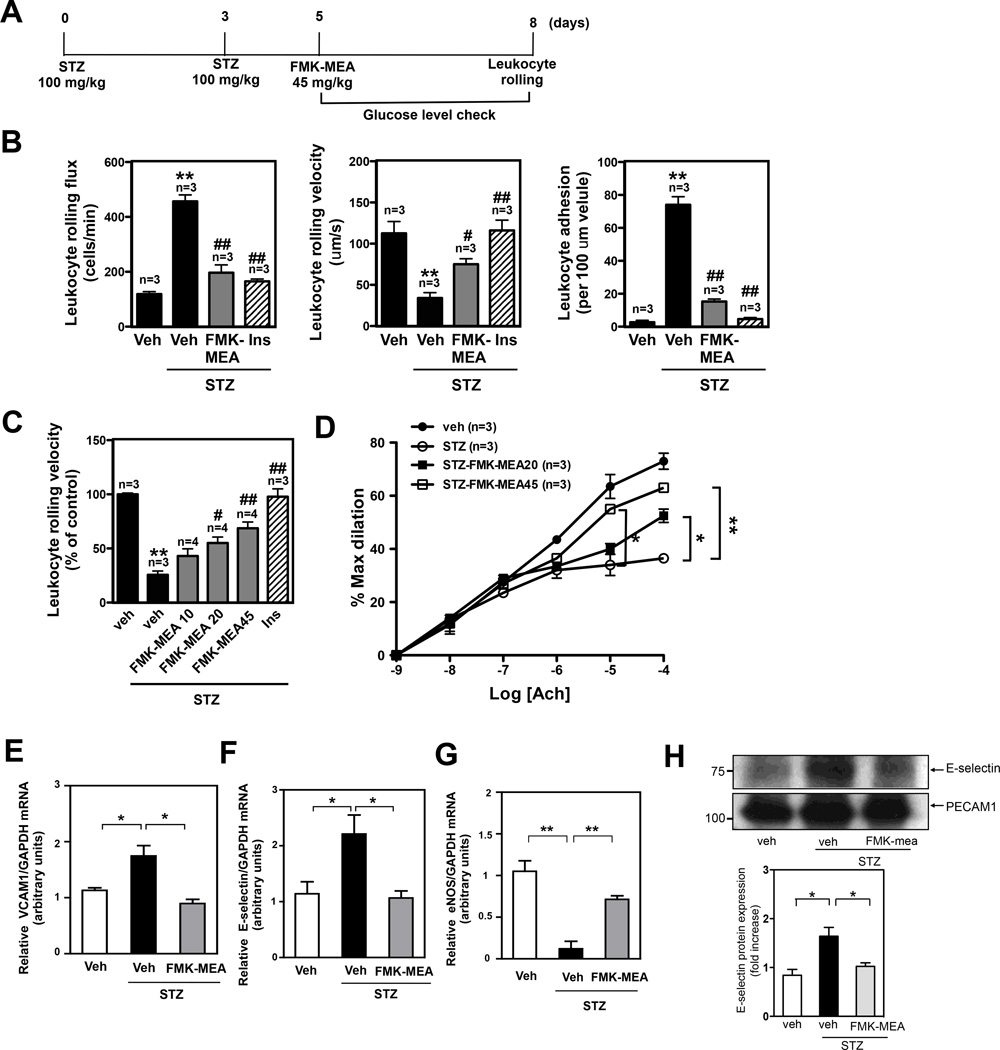
Figure 5.
The DM condition in STZ treated mice increases leukocyte rolling and reduces vasodilatation, and FMK-MEA treatment improves EC dysfunction with inhibition of EC inflammation and up-regulation of eNOS expression in these mice in vivo. (A) Scheme for STZ and FMK-MEA treatment. (B) Leukocyte rolling in vivo. Insulin (Humalin N, twice daily, 5IU/kg) treatment was stated after 4 days of first STZ injection. Mice were anesthetized and injected with rhodamine 6G to label leukocytes. Leukocyte rolling was imaged with a digital video camera for 2 min (n=3–4). Quantification of leukocyte rolling flux (number of rolling leukocytes passing a perpendicular line placed across the observed vessel in one minute), leukocyte rolling velocity, and leukocyte adhesion in vivo. To analyze these parameters, image analysis software (NIS elements, Nikon) was used (mean ± SEM, n=4 mice; **P<0.01 compared to vehicle with no STZ treatment group. #P<0.05, ##P<0.01 compared with vehicle with STZ treatment group.). (Supplemental video 2) (C) Effects of FMK-MEA (10- 45 mg/kg/day, i.p.) and insulin on leukocyte rolling. Results are expressed relative to vehicle with no STZ treatment (100%). Shown is mean ± SEM (n = 3–4 mice); **P<0.01 compared to vehicle with no STZ treatment group. #P<0.05, ##P<0.01 compared to vehicle with STZ treatment group.) (D) Endothelium-dependent relaxations to Ach. Compared to -non-diabetic mice, vasodilatation in STZ-treated diabetic mice was significantly diminished. FMK treatment improved vessel reactivity to Ach in STZ-treated diabetic mice. Data are shown as means ± SEM, **P<0.01 compared to STZ treatment group (n=3). (E-H) C57BL/6 wild type mice were intraperitoneally injected for three days with vehicle or STZ (100mg/kg/day), followed by vehicle or FMK-MEA injection as described in Fig. 5A. After four days of FMK-MEA injection, MECs were isolated from the lungs of these mice and then (for E-G) RNA was immediately extracted for real-time PCR (E) VCAM-1 mRNA (F) E-selectin mRNA (G) eNOS mRNA levels were detected by qRT-PCR as described in Methods. (H) RIPA buffer was added to lyse the cells, then E-selectin (upper) and PECAM-1 (lower) protein expressions were assayed by Western blotting using each specific antibody. Quantification of E-selectin protein was expressed as the relative ratio compared to PECAM-1 bands. Data (E-H) are shown as means ± SEM, n=3.

