

Abstract
Background
The purpose of this study was to determine whether a mixture of the polyphenol, resveratrol, and the leucine metabolite, hydroxymethylbutyrate (HMB), acts synergistically with low doses of metformin to impact insulin sensitivity and AMP-activated protein kinase-dependent outcomes in cell culture and in diabetic mice.
Methods
C2C12 skeletal myotubes and 3T3-L1 adipocytes were treated with resveratrol 0.2 μM, HMB 5 μM, and metformin 0.1 mM alone or in combination. db/db mice were treated for 2 weeks with high (1.5 g/kg diet), low (0.75 g/kg diet), or very low (0.25 g/kg diet) doses of metformin alone or in combination with a diet containing resveratrol 12.5 mg and CaHMB 2 g/kg.
Results
The combination of metformin-resveratrol-HMB significantly increased fat oxidation, AMP-activated protein kinase, and Sirt1 activity in muscle cells compared with metformin or resveratrol-HMB alone. A similar trend was found in 3T3L1 adipocytes. In mice, the two lower doses of metformin exerted no independent effect but, when combined with resveratrol-HMB, both low-dose and very low-dose metformin improved insulin sensitivity (HOMAIR), plasma insulin levels, and insulin tolerance test response to a level comparable with that found for high-dose metformin. In addition, the metformin-resveratrol-HMB combination decreased visceral fat and liver weight in mice.
Conclusion
Resveratrol-HMB combined with metformin may act synergistically on AMP-activated protein kinase-dependent pathways, leading to increased insulin sensitivity, which may reduce the therapeutic doses of metformin necessary in the treatment of diabetes.
Keywords: diabetes, AMP-activated protein kinase, Sirt1, fat oxidation
Introduction
The rapid growth in prevalence of type 2 diabetes mellitus is mainly attributable to changes in lifestyle and diet, and has been concomitant with an increase in obesity.1 It is also recognized as one of the major causes of other chronic morbidities, such as cardiovascular and kidney disease, and of early mortality, thus posing a serious public health problem.2 Therefore, identification of safer approaches to improve insulin sensitivity is important as a means to control diabetes and to improve the efficacy of lifestyle approaches for the reduction of obesity and risk of diabetes.
Metformin, a biguanide, either alone or as part of combination therapy, is the drug of choice for oral treatment of diabetes, particularly in overweight and obese people.3 Its main action is to lower blood glucose levels by inhibiting hepatic gluconeogenesis as well as increasing insulin sensitivity.3,7 Metformin acts, in part, via activation of AMP-activated protein kinase (AMPK), thereby stimulating oxidation of fat in muscle.4–6 A daily oral dose of 2000–2500 mg/day is typically required for optimal effect8 and oral bioavailability is dose-dependent, with decreased bioavailability at higher doses, suggesting an active, saturable absorption process.9 Although severe adverse effects are rare, up to 30% of patients report gastrointestinal symptoms, including diarrhea, cramps, nausea, and vomiting, which can cause severe discomfort and lead to discontinuation of the drug.10 Therefore, finding strategies to reduce the dose of metformin required without compromising its efficacy is a useful approach for managing and reducing adverse events.
AMPK is a key regulator of cell and whole body energy metabolism. Increases in the AMP/ATP ratio activate AMPK, resulting in increased glucose uptake and a shift from anabolic to catabolic ATP-producing pathways,11 including fat oxidation. AMP binding results in a conformational change which promotes Thr 172 phosphorylation by upstream kinases, including tumor suppressor liver kinase B1 and the Ca2+/calmodulin-dependent kinase (CamKKβ) and prevents its dephosphorylation by protein phosphatases.12 When purified recombinant AMPK activity from bacterial cell lysates was measured, AMP stimulated the activity of AMPK by up to 10-fold and upstream kinases by up to 100-fold, and the combination of AMP with the upstream kinases by up to 1000-fold.13 In addition, there is a bidirectional interaction between the sirtuin, Sirt1, and AMPK, leading to mutual activation.14,15 The sirtuins, Sirt1 and Sirt3, are also well known regulators of glucose and lipid metabolism. Their activation converges on the same pathways activated by AMPK16 and results in increased mitochondrial biogenesis and fatty acid oxidation. Because lipid and glucose metabolism is dysregulated in type 2 diabetes mellitus, AMPK and sirtuin modulators have been suggested to be promising therapies.
We have recently demonstrated that a nutritional mixture of resveratrol, a naturally occurring polyphenol found in the skin of red grapes, and either leucine or HMB, a naturally occurring metabolite of leucine, produces profound improvement in insulin sensitivity, muscle glucose, and palmitate uptake, as well as a reduction in inflammatory and oxidative stress in mice with diet-induced obesity; notably, these effects occurred at concentrations that were without effect when the compounds were provided independently of each other.17 These effects are mediated by activation of AMPK, Sirt1, and Sirt3.17 Thus, they converge upon the same metabolic pathways activated by metformin. Consequently, this study was designed to determine whether a blend of resveratrol-HMB would act synergistically with metformin to control diabetes in diabetic mice. The intention was to develop a formulation that uses very low levels of metformin in combination with the resveratrol-HMB blend in order to lower the effective dose of metformin required for management of diabetes.
Materials and methods
Cell culture
3T3-L1 preadipocytes were incubated at a density of 8000 cells/cm2 (10 cm2 dish) and grown in the absence of insulin in Dulbecco’s modified Eagle’s medium (25 mM glucose) containing 10% fetal bovine serum and 1% penicillin-streptomycin (adipocyte medium) at 37°C in a 5% CO2 atmosphere. Confluent preadipocytes were induced to differentiate using a standard differentiation medium (DM2-L1, Zen-Bio Inc, Research Triangle Park, NC, USA). The preadipocytes were maintained in this differentiation medium for 3 days and subsequently cultured in adipocyte medium for a further 8–10 days to allow at least 90% of cells to reach full differentiation before treatment. The medium was changed every 2–3 days, and differentiation was determined microscopically as inclusion of fat droplets.
C2C12 muscle cells were incubated at a density of 8000 cells/cm2 (10 cm2 dish) and grown in Dulbecco’s modified Eagle’s medium containing 10% fetal bovine serum and antibiotics at 37°C in a 5% CO2 atmosphere. Cells were grown to 100% confluence, transferred into differentiation medium (Dulbecco’s modified Eagle’s medium with 2% horse serum and 1% penicillin-streptomycin), and fed with fresh differentiation medium every day until myotubes were fully formed (6 days).
Treatment concentrations for all cell experiments were 200 nM resveratrol (Sigma-Aldrich, St Louis, MO, USA), 5 μM HMB (PureBulk Inc, Roseburg, OR, USA), and 0.1 nM or 1 mM metformin (Sigma-Aldrich) as indicated. The incubation time was 4–48 hours, depending on the experiment.
Fatty acid oxidation
Cellular oxygen consumption was measured using an XF24 analyzer (Seahorse Bioscience, Billerica, MA, USA) in 24-well plates at 37°C, as described by Feige et al,18 with slight modifications. Cells were seeded at 40,000 cells per well, differentiated as described above, treated for 24 hours with the indicated treatments, washed twice with nonbuffered carbonate-free pH 7.4 low glucose (2.5 mM) Dulbecco’s modified Eagle’s medium containing carnitine 0.5 mM, equilibrated with 550 μL of the same medium in a non-CO2 incubator for 30 minutes, and then inserted into the instrument for 15 minutes of further equilibration. O2 consumption was measured in three successive baseline measures at five-minute intervals prior to injection of palmitate (200 μM final concentration). Post-palmitate injection measurements were taken over a 4-hour period with cycles consisting of a 10-minute break and four successive measurements of O2 consumption.
Sirt1 activity
Sirt1 activity was measured using the Sirt1 fluorimetric drug discovery kit (BML-AK555, ENZO Life Sciences International Inc, Plymouth Meeting, PA, USA). The sensitivity and specificity of this assay kit has been tested by Nin et al.19 Using this assay, Sirt1 activity is assessed by the degree of deacetylation of a standardized substrate containing an acetylated lysine side chain. The substrate utilized is a peptide containing amino acids 379–382 of human p53 (Arg-His-Lys-Lys[Ac]), an established target of Sirt1 activity; Sirt1 activity is directly proportional to the degree of deacetylation of Lys-382. Samples were incubated with peptide substrate (25 μM) and NAD+ (500 μM) in phosphate-buffered solution at 37°C on a horizontal shaker for 45 minutes. The reaction was stopped by addition of 2 mM nicotinamide and a developing solution that binds to the deacetylated lysine to form a fluorophore. Following 10 minutes of incubation at 37°C, fluorescence was read in a plate-reading fluorometer with excitation and emission wavelengths of 360 nm and 450 nm, respectively. Resveratrol 100 mM served as a Sirt1 activator (positive control) and suramin sodium 25 mM as a Sirt1 inhibitor (negative control). Endogenous Sirt1 activity in muscle cells and mouse white adipose tissue was measured using a modified assay with 5 μL of cell lysate. The lysates were prepared by homogenizing cells in ice-cold RIPA buffer with protease inhibitor mix (MP Biomedicals LLC, Solon, OH, USA). After 10 minutes of incubation on ice, the homogenate was centrifuged at 14,000 g and the supernatant was used for further experiments. Data for endogenous Sirt1 activation were normalized to cellular protein concentration measured using a bicinchoninic acid assay.
AMPK activity
AMPK activity in cells was measured using an AMPK assay kit (CycLex Co, Ltd Nagano, Japan) according to the manufacturer’s instructions. This assay provides a nonisotopic, sensitive, and specific method in the form of an enzyme-linked immunosorbent assay and uses anti-phospho-mouse IRS-1 S789 monoclonal antibody and peroxidase-coupled anti-mouse IgG antibody as a reporter molecule. The amount of phosphorylated substrate is determined by measuring absorbance at 450 nm. Differentiated cells were incubated with the treatments indicated for 24 hours. The cells were washed three times with ice-cold phosphate-buffered solution, lysed in cell lysis buffer for 90 minutes on ice, and centrifuged at 3500 rpm for 15 minutes at 4°C. Next, 10 μL of clear supernatant was used for each assay. Purified recombinant AMPK active enzyme was included as a positive control for phosphorylation, and 0.5 mM AICAR, a potent AMPK activator, was included in some experiments as an additional positive control. To calculate the relative AMPK activity of the samples, an inhibitor control with compound C for each sample was included once, and inhibitor control absorbance values were subtracted from the test sample absorbance values. Each experiment was assayed in triplicate from four independent cell replicates.
Western blotting
The antibodies P-AMPKα (Thr-172) and AMPKα were obtained from Cell Signaling Technology Inc (Danvers, MA, USA) and EMD Millipore (Billerica, MA, USA), respectively. 3T3L1 adipocytes were treated as indicated and the cells were washed with ice-cold phosphate-buffered solution, then lysed with ice-cold RIPA buffer and protease and phosphatase inhibitor cocktails (Sigma-Aldrich), centrifuged at 14,000 g at 4°C for 10 minutes, and the resulting supernatant was used for experiments. Protein was measured using a bicinchoninic acid kit (Thermo Scientific Inc, Waltham, MA, USA). For Western blotting, equal amounts of protein per sample (10 μg) were resolved on 10% gradient polyacrylamide gels (Criterion precast gel, Bio-Rad Laboratories, Hercules, CA, USA), transferred to polyvinylidene difluoride membranes, incubated in blocking buffer (3% bovine serum albumin in Tris-buffered saline), then incubated with primary antibody (1:1000) overnight, washed and incubated with secondary horseradish peroxidase-conjugated antibody (1:10.000) for one hour. Visualization and chemiluminescent detection was done using BioRad ChemiDoc instrumentation and software (Bio-Rad Laboratories), and band intensity was assessed using Image Lab 4.0 (Bio-Rad Laboratories), with correction for background and loading controls.
Animals and diets
Diabetic 8–10-week-old male db/db mice (C57BLKS/J-leprdb/leprdb) were purchased from Harlan Laboratories (Indianapolis, IA). After acclimatization to their environment for 5–7 days, they were randomized into six different dietary groups with 10 animals per group and kept on their diet for 2 weeks. The metformin concentrations in the diets were based on literature values of high (300 mg/kg body weight), low (150 mg/kg body weight), and very low (50 mg/kg body weight) metformin studies in mice,20–23 based on average food consumption (8 g/day) and average body weight (40 g or 0.04 kg) for diet-induced mice; this was calculated to be equivalent to a 1.5 g, 0.75 g, and 0.25 g metformin/kg diet, respectively. The dietary groups were either the standard diet (AIN 93G) only (control group), or the standard diet combined with one of the three different concentrations of metformin (high [300 mg/kg body weight], low [150 mg/kg body weight], or very low metformin group [50 mg/kg body weight]); the two lowest doses of metformin were provided with or without a mixture of resveratrol (12.5 mg/kg diet) and CaHMB 2 g/kg diet (low-dose metformin + resveratrol-HMB and very low-dose metformin + resveratrol-HMB groups, respectively).
The animals were housed in polypropylene cages at a room temperature of 22°C ± 2°C and on a 12-hour light/dark cycle. The animals had free access to water and food throughout the experiment, and food intake was not measured. Body weight was measured at days 0, 7, and 14 of the study period. At the end of the 14-day treatment period all animals were fasted overnight and humanely euthanized with isoflurane overdose and cervical dislocation. Blood and tissues were collected for further experiments as described below. Liver and visceral adipose tissue mass was weighed immediately after removal.
The University of Tennessee is accredited by the American Association for Accreditation of Laboratory Animal Care. This study and all animal procedures were performed under the auspices of a protocol approved by the Institutional Animal Care and Use Committee and in accordance with Public Health Service policy and recommendations of the guide.
HOMAIR
The homeostasis model assessment of insulin resistance (HOMAIR) was used as a screening index for changes in insulin sensitivity. HOMAIR is calculated via a standard formula from fasting plasma insulin and glucose as follows: HOMAIR = [Insulin (μU/mL) × glucose (mM)]/22.5. Plasma glucose and insulin concentrations were measured using a glucose assay kit from Cayman (Ann Arbor, MI, USA) and an insulin kit from Millipore, respectively.
Insulin tolerance test
Insulin tolerance tests were performed at 2 pm on day 7. The mice were injected intraperitoneally with insulin (0.75 U/kg body weight) in approximately 0.1 mL of 0.9% NaCl. A 5 μL drop of blood was taken from the cut tail vein before injection of insulin and after 15, 30, 45, and 60 minutes for determination of blood glucose. Change in blood glucose over the linear portion of the response curve was then calculated.
Statistical analysis
All data are expressed as the mean ± standard error of the mean. Data were analyzed by one-way analysis of variance, and significantly different group means (P < 0.05) were separated by the least significant difference test using GraphPad Prism (GraphPad Software Inc, La Jolla, CA, USA).
Results
Palmitate oxidation, as measured by palmitate-stimulated oxygen consumption rate, was significantly increased by both metformin and the resveratrol-HMB combination in muscle cells (P < 0.002, Figure 1), while the combination of metformin and resveratrol-HMB showed a 30% greater effect compared with either metformin or resveratrol-HMB alone (P < 0.04, Figure 1A). A similar pattern was seen in adipocytes (Figure 1B), where the combination of HMB with either resveratrol or metformin increased the area under the concentration-time curve by about 100%. The combination of metformin and resveratrol-HMB enhanced this effect by a further 16%. However, in contrast with muscle cells, metformin alone did not show any effects in adipocytes. Consistent with these observations, AMPK activity in C2C12 was significantly increased by the combination of metformin and resveratrol-HMB (P < 0.01, Figure 2B), but not by low-dose metformin or HMB alone or by metformin-HMB in the absence of resveratrol (Figure 2A). We also assessed AMPK activation by measuring phosphorylation at Thr-172. Consistent with our activity measurements, low-dose (0.1 mM) metformin exerted no independent effect on P-AMPK, but when low-dose metformin was combined with either HMB or a resveratrol-HMB combination, it produced an increase of about 40%, similar to that found with resveratrol-HMB (Figure 2D and E, P < 0.001). Expressing the data as an P-AMPK/AMPK ratio produced similar results (Figure 2F). In addition, Sirt1 activity was augmented to a significant extent by the combination of metformin and HMB compared with either treatment alone (Figure 2C, P < 0.02).
Figure 1.

Synergistic effects of metformin and resveratrol-HMB on fatty acid oxidation in C2C12 muscle cells and 3T3L1 adipocytes. Differentiated C2C12 muscle cells (A) and 3T3L1 adipocytes (B) were treated with the treatments indicated for 24 hours.
Notes: OCR was measured after palmitate injection (point A and C) and represented as a percentage of baseline. The AUC is calculated by subtracting the starting rate (third baseline point) from each average rate point. Data are expressed as the mean ± standard deviation (n = 4). Bars with the same letter superscripts are not significantly different from each other; bars with nonmatching letter superscripts indicate significant differences between groups (P < 0.04).
Abbreviations: AUC, area under curve; CTRL, control; HMB, hydroxymethylbutyrate; MET, metformin; OCR, oxygen consumption rate; RESV, resveratrol.
Figure 2.

Synergistic effects of metformin and resveratrol-HMB on AMPK and Sirt1 activity in C2C12 muscle cells and 3T3L1 adipocytes. Differentiated muscle cells and adipocytes were treated with the treatments indicated. (A and B) AMPK activity in C2C12 cell lysates. (C) Sirt1 activity in 3T3L1 cell lysates. (D) Quantitative band analysis of AMPK phosphorylation in 3T3L1 adipocytes. (E) Western blots of AMPK in 3T3L1 cell lysates using anti-phospho-AMPK-α (Thr172) and anti-AMPKα antibodies. AICAR was used as a positive control. (F) P-AMPK/AMPK ratio in 3T3L1 adipocytes.Notes: Data are expressed as the mean ± standard error of the mean (n = 4). Bars with the same letter superscripts are not significantly different from each other; bars with nonmatching letter superscripts indicate significant differences between groups (P < 0.05).
Abbreviations: AFU, arbitrary fluorescent units; AMPK, AMP-activated protein kinase; HMB, hydroxymethylbutyrate; MET, metformin; RESV, resveratrol.
Based on these in vitro data, we investigated the synergistic effects of low-dose metformin and resveratrol-HMB on insulin sensitivity in diabetic mice. Consistent with previous reports in the literature,21,24,25 high-dose metformin reduced plasma insulin by 27% (P < 0.02, Figure 3A) and HOMAIR by 35% (P < 0.025, Figure 3B), although no change was found in plasma glucose levels in these highly insulin-resistant mice (Table 1). In contrast, low-dose metformin and very low-dose metformin exerted no significant independent effects, while combining either the low-dose or very low-dose of metformin with resveratrol and HMB resulted in significant decreases in plasma insulin from 62 μU/mL to 43 μU/mL (P < 0.02, Figure 3A), comparable with that seen with high-dose metformin. Moreover, there was no significant difference between the low-dose metformin-HMB combination versus the very low-dose metformin-HMB combination. Consistent with this observation, the HOMAIR index decreased from 29 units on the control diet to 19 on the low-dose metformin-resveratrol-HMB blend and to 16 units on the very low-dose metformin-resveratrol-HMB blend (P < 0.025, Figure 3B), refecting an improvement in insulin sensitivity comparable with that found with high-dose metformin. Similar results were found for the insulin tolerance test (Figure 4). Animals on the control, low-dose, or very low-dose of metformin showed minimal changes in blood glucose in response to insulin challenge. In contrast, those on the standard metformin dose and those on either low-dose or very low-dose metformin combined with resveratrol-HMB showed decreases in blood glucose of about 60 mg/dL over the 30-minute linear portion of the response curve (P < 0.02). Moreover, the metformin-resveratrol-HMB combination reduced visceral adiposity (Table 1). Animals on the control diet had a mean visceral fat mass of 4.5 g, and this was not affected by metformin at any dose in the absence of resveratrol-HMB. Low-dose metformin combined with resveratrol-HMB and very low-dose metformin combined with resveratrol-HMB reduced visceral fat by about 20%, to 3.8 and 3.6 g, respectively (P < 0.03). These treatments also reduced liver mass, from 2.78 g (control) to 2.35 g and 2.41 g, respectively (P < 0.05), while no effect on body weight was seen (Table 1).
Figure 3.
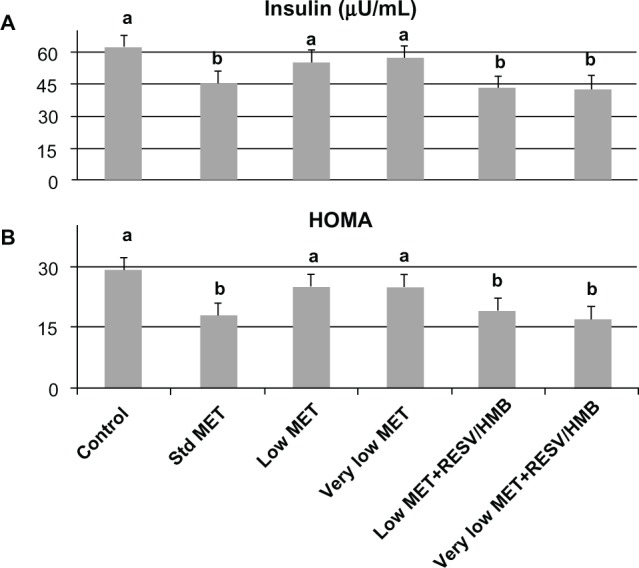
Synergistic effects of metformin and resveratrol-HMB on insulin sensitivity in mice. Effects of standard dose, low-dose, and very low-dose of metformin compared with low-dose metformin-resveratrol-CaHMB and with very low-dose metformin-resveratrol-CaHMB on (A) plasma insulin and (B) HOMAIR in db/db mice.
Notes: Data are expressed as the mean ± standard error of the mean (n = 10). Bars with the same letter superscripts are not significantly different from each other; bars with nonmatching letter superscripts indicate significant differences between groups (P < 0.025).
Abbreviations: HOMA, homeostatic assessment of insulin resistance; HMB, hydroxymethylbutyrate; MET, metformin; RESV, resveratrol.
Table 1.
Effects of indicated treatments on body weight, visceral fat mass, liver weight, plasma glucose, and food intake in mice
| Control | Standard metformin | Low-dose metformin | Very low-dose metformin | Low-dose metformin + resveratrol-HMB | Very low-dose metformin + resveratrol-HMB | |
|---|---|---|---|---|---|---|
| Body weight (g) (start) | 45.0 ± 0.6a | 45.2 ± 0.8a | 45.1 ± 0.6a | 44.4 ± 0.9a | 45.6 ± 1.0a | 46.7 ± 0.6a |
| Body weight (g) (end) | 46.8 ± 0.7a | 48.6 ± 0.6a | 48.2 ± 0.4a | 46.3 ± 1.1a | 48.3 ± 1.0a | 47.9 ± 1.0a |
| Plasma glucose (mg/dL) | 481.3 ± 25.0a | 460.1 ± 24.7a | 482.3 ± 15.4a | 503.0 ± 17.0a | 433.7 ± 51.6a | 529.1 ± 18.6a |
| Visceral fat (g) | 4.5 ± 0.18a | 4.3 ± 0.29a | 4.6 ± 0.14a | 4.4 ± 0.13a | 3.8 ± 0.19b | 3.6 ± 0.23b |
| Liver (g) | 2.78 ± 0.16a | 2.76 ± 0.09a | 2.65 ± 0.09a | 2.68 ± 0.12a | 2.35 ± 0.13b | 2.41 ± 0.08b |
Notes:db/db mice were fed the indicated diets for 2 weeks. Data are expressed as the mean ± standard error of the mean (n = 10). Values with the same letter superscripts in each row are not significantly different from each other; values with nonmatching letter superscripts in each row indicate significant differences between groups (P < 0.03).
Abbreviation: HMB, hydroxymethylbutyrate.
Figure 4.
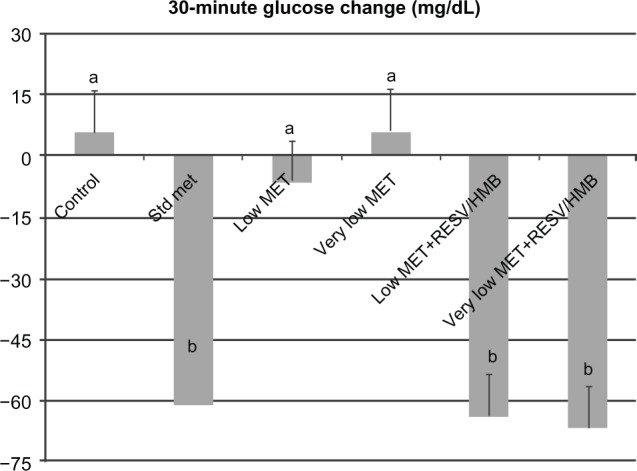
Synergistic effects of metformin and resveratrol-HMB on insulin tolerance test in mice.
Notes: Effects of standard dose, low-dose, and very low-dose metformin compared with low-dose metformin-resveratrol-CaHMB and with very low-dose metformin-resveratrol-CaHMB on 30-minute plasma glucose response to insulin (0.75 U/kg body weight) in db/db mice. Data are expressed as the mean ± standard error of the mean (n = 10). Bars with the same letter superscripts are not significantly different from each other; bars with nonmatching letter superscripts indicate significant differences between groups (P < 0.02).
Abbreviations: HMB, hydroxymethylbutyrate; Met, metformin; RESV, resveratrol.
Discussion
Our results demonstrate potentiation of the effect of the antidiabetic drug, metformin, using a mixture of resveratrol and HMB, on fat oxidation and insulin sensitivity in vitro and in vivo. These effects were found with concentrations of each compound that were too low to exert significant independent effects, demonstrating a synergistic action. We have recently shown that the amino acid leucine, as well as its metabolite HMB, acts synergistically with the polyphenol, resveratrol, on insulin sensitivity and fat metabolism.17 These effects were mediated by activation of AMPK, Sirt1, and Sirt3 in muscle cells and adipocytes. Therefore, we hypothesized that the addition of another activator of this pathway may act synergistically and may be able to enhance this effect. Indeed, consistent with our previous data, the combination of resveratrol with HMB enhanced fatty acid oxidation by about 100% in adipocytes and by about 160% in muscle when measured over a 2-hour period in this study. However, addition of low-dose metformin, which had little or no effect by itself, resulted in a further significant increase of this effect; these effects were accompanied by corresponding increases in AMPK and Sirt1 activity.
Consistent with our previous observations,17 leucine combined with resveratrol was able to exert effects similar to those of the resveratrol-HMB combination; however, in combination with metformin, HMB was superior (data not shown). Although no significant difference between the metformin-HMB and metformin-resveratrol-HMB combinations was detected in adipocytes, there was an enhanced effect of metformin-resveratrol-HMB in muscle cells.
For this reason, we conducted our animal study using only the resveratrol-HMB combination, and found that this combination significantly potentiated the effects of low-dose metformin on insulin sensitivity, resulting in efficacy comparable with that of treatment with higher doses of metformin. Although mean plasma glucose was highest in the very low-dose metformin-resveratrol-HMB group, it was not significantly different from that in the other groups, while the insulin concentration and calculated HOMAIR were significantly lower, indicating an improvement in insulin sensitivity. Further, consistent with our previous results in diet-induced obesity in mice,17 combination with resveratrol-HMB reduced visceral fat mass and liver weight, while no effect on these outcomes were found using metformin alone. Because the number of mice used in the animal study was limited, we did not include a resveratrol-HMB group. Therefore, we cannot rule out that these effects were caused simply by resveratrol-HMB treatment alone. However, the demonstration of synergy in the in vitro studies of myotubes suggests that low-dose metformin acts synergistically with resveratrol-HMB in vivo as well.
The primary action of metformin is to lower blood glucose concentration by inhibiting hepatic glucose production and stimulating glucose disposal in skeletal muscle.3 Metformin also activates AMPK, although it is not clear whether this is by direct or indirect stimulation.26 It has been postulated that inhibition of mitochondrial respiration at complex 1 resulting in decreased ATP production is responsible for AMPK activation,5,27 but this model would be contrary to the finding of increased fatty acid oxidation in muscle with metformin. Metformin also acts via inhibition of AMP deaminase, thereby inhibiting AMP catabolism and increasing the cellular AMP/ATP ratio, resulting in phosphorylation and activation of AMPK.28 In addition, metformin may interact directly with the γ-subunit of the AMPK complex, producing a structural change that promotes phosphorylation and activation by upstream kinases.6
Resveratrol has also been shown to activate AMPK by two mechanisms, ie, high doses of resveratrol inhibit cAMP-phosphodiesterase, thus increasing cellular cAMP concentrations and activating the upstream kinase CaMKKβ,29 and moderate doses of resveratrol lead to Sirt1-dependent activation of AMPK.30 We have demonstrated direct effects of HMB on Sirt1 activation in a cell-free system31 as well as the synergistic effects of resveratrol and HMB on Sirt1 both in vitro and in vivo.17 Considering the two different mechanisms of AMPK activation of these compounds, it is possible that metformin in the low concentrations used in our study acts as an allosteric effector to promote AMPK phosphorylation by resveratrol and HMB.
Although the pathogenesis of insulin resistance in type 2 diabetes mellitus is still not fully understood, there is evidence that accumulation of intracellular lipid metabolites in skeletal muscle and hepatocytes, as observed in obesity or lipodystrophy, leads to impairment in insulin signaling pathways.33 Moreover, decreased mitochondrial oxidative capacity may result in impaired lipid oxidation in skeletal muscle in obese and diabetic individuals,34,35 potentially exacerbating lipid overflow. Therefore, finding strategies to improve mitochondrial function and to stimulate catabolic oxidative pathways may contribute to both the prevention and treatment of diabetes.
AMPK, as a key regulator of energy metabolism, mediates the switch from anabolic processes to catabolic pathways. AMPK activity is decreased in obese insulin-resistant patients compared with obese insulin-sensitive patients.36 Further, lack of skeletal muscle AMPKα2 activity in transgenic mice exacerbates the development of diet-induced glucose intolerance and insulin resistance.37 In contrast, activation of AMPK improves symptoms of impaired glucose homeostasis and insulin resistance.38–40 Given that lifestyle interventions such as caloric restriction or exercise, which are physiological activators of AMPK, are difficult to incorporate or to maintain in the daily routine of most people, finding agents mimicking these effects are of great interest. Unfortunately, many of these compounds require concentrations which are associated with adverse effects. However, obtaining synergy from three unrelated compounds permits the use of very low concentrations of each individual component, reducing the likelihood of adverse effects while preserving the effects of higher-dose metformin on fat oxidation and insulin sensitivity.
Conclusion
In this study we have demonstrated the synergistic effects of a mixture of resveratrol and HMB with a low dose of metformin on activation of AMPK and Sirt1, with an associated increase in fat oxidation in muscle and adipose tissue in cell culture. Consistent with our in vitro data, 2 weeks of treatment with a combination of these compounds increased insulin sensitivity and reduced adiposity in mice, and these effects were comparable with those found with high-dose metformin treatment. Therefore, this combination may be a useful approach to lowering the therapeutic metformin concentration required and may be beneficial for the management of type 2 diabetes.
Footnotes
Disclosure
Financial support for this study was provided by NuSirt Sciences Inc, Knoxville TN. AB and MBZ are employees and stockholders of NuSirt Sciences Inc.
References
- 1.Hardoon SL, Morris RW, Thomas MC, Wannamethee SG, Lennon LT, Whincup PH. Is the recent rise in type 2 diabetes incidence from 1984 to 2007 explained by the trend in increasing BMI?: evidence from a prospective study of British men. Diabetes Care. 2010;33(7):1494–1496. doi: 10.2337/dc09-2295. [DOI] [PMC free article] [PubMed] [Google Scholar]
- 2.Sarwar N, Gao P, Seshasai SR, et al. Diabetes mellitus, fasting blood glucose concentration, and risk of vascular disease: a collaborative meta-analysis of 102 prospective studies. Lancet. 2010;375(9733):2215–2222. doi: 10.1016/S0140-6736(10)60484-9. [DOI] [PMC free article] [PubMed] [Google Scholar]
- 3.Viollet B, Guigas B, Sanz Garcia N, Leclerc J, Foretz M, Andreelli F. Cellular and molecular mechanisms of metformin: an overview. Clin Sci (Lond) 2012;122(6):253–270. doi: 10.1042/CS20110386. [DOI] [PMC free article] [PubMed] [Google Scholar]
- 4.Fryer LG, Parbu-Patel A, Carling D. The anti-diabetic drugs rosiglitazone and metformin stimulate AMP-activated protein kinase through distinct signaling pathways. J Biol Chem. 2002;277(28):25226–25232. doi: 10.1074/jbc.M202489200. [DOI] [PubMed] [Google Scholar]
- 5.Hawley SA, Ross FA, Chevtzoff C, et al. Use of cells expressing gamma subunit variants to identify diverse mechanisms of AMPK activation. Cell Metab. 2010;11(6):554–565. doi: 10.1016/j.cmet.2010.04.001. [DOI] [PMC free article] [PubMed] [Google Scholar]
- 6.Zhang Y, Wang Y, Bao C, et al. Metformin interacts with AMPK through binding to gamma subunit. Mol Cell Biochem. 2012;368(1–2):69–76. doi: 10.1007/s11010-012-1344-5. [DOI] [PubMed] [Google Scholar]
- 7.Grisouard J, Timper K, Radimerski TM, et al. Mechanisms of metformin action on glucose transport and metabolism in human adipocytes. Biochem Pharmacol. 2010;80(11):1736–1745. doi: 10.1016/j.bcp.2010.08.021. [DOI] [PubMed] [Google Scholar]
- 8.Garber AJ, Duncan TG, Goodman AM, Mills DJ, Rohlf JL. Efficacy of metformin in type II diabetes: results of a double-blind, placebo-controlled, dose-response trial. Am J Med. 1997;103(6):491–497. doi: 10.1016/s0002-9343(97)00254-4. [DOI] [PubMed] [Google Scholar]
- 9.Proctor WR, Bourdet DL, Thakker DR. Mechanisms underlying saturable intestinal absorption of metformin. Drug Metab Dispos. 2008;36(8):1650–1658. doi: 10.1124/dmd.107.020180. [DOI] [PubMed] [Google Scholar]
- 10.Okayasu S, Kitaichi K, Hori A, et al. The evaluation of risk factors associated with adverse drug reactions by metformin in type 2 diabetes mellitus. Biol Pharm Bull. 2012;35(6):933–937. doi: 10.1248/bpb.35.933. [DOI] [PubMed] [Google Scholar]
- 11.Hardie DG, Pan DA. Regulation of fatty acid synthesis and oxidation by the AMP-activated protein kinase. Biochem Soc Trans. 2002;30(Pt 6):1064–1070. doi: 10.1042/bst0301064. [DOI] [PubMed] [Google Scholar]
- 12.Srivastava RA, Pinkosky SL, Filippov S, Hanselman JC, Cramer CT, Newton RS. AMP-activated protein kinase: an emerging drug target to regulate imbalances in lipid and carbohydrate metabolism to treat cardio-metabolic diseases. J Lipid Res. 2012;53(12):2490–2514. doi: 10.1194/jlr.R025882. [DOI] [PMC free article] [PubMed] [Google Scholar]
- 13.Suter M, Riek U, Tuerk R, Schlattner U, Wallimann T, Neumann D. Dissecting the role of 5′-AMP for allosteric stimulation, activation, and deactivation of AMP-activated protein kinase. J Biol Chem. 2006;281(43):32207–32216. doi: 10.1074/jbc.M606357200. [DOI] [PubMed] [Google Scholar]
- 14.Salminen A, Hyttinen JM, Kaarniranta K. AMP-activated protein kinase inhibits NF-kappaB signaling and inflammation: impact on healthspan and lifespan. J Mol Med (Berl) 2011;89(7):667–676. doi: 10.1007/s00109-011-0748-0. [DOI] [PMC free article] [PubMed] [Google Scholar]
- 15.Lan F, Cacicedo JM, Ruderman N, Ido Y. SIRT1 modulation of the acetylation status, cytosolic localization, and activity of LKB1. Possible role in AMP-activated protein kinase activation. J Biol Chem. 2008;283(41):27628–27635. doi: 10.1074/jbc.M805711200. [DOI] [PMC free article] [PubMed] [Google Scholar]
- 16.Canto C, Auwerx J. PGC-1alpha, SIRT1 and AMPK, an energy sensing network that controls energy expenditure. Curr Opin Lipidol. 2009;20(2):98–105. doi: 10.1097/MOL.0b013e328328d0a4. [DOI] [PMC free article] [PubMed] [Google Scholar]
- 17.Bruckbauer A, Zemel MB, Thorpe T, et al. Synergistic effects of leucine and resveratrol on insulin sensitivity and fat metabolism in adipocytes and mice. Nutr Metab (Lond) 2012;9(1):77. doi: 10.1186/1743-7075-9-77. [DOI] [PMC free article] [PubMed] [Google Scholar]
- 18.Feige JN, Lagouge M, Canto C, et al. Specific SIRT1 activation mimics low energy levels and protects against diet-induced metabolic disorders by enhancing fat oxidation. Cell Metab. 2008;8(5):347–358. doi: 10.1016/j.cmet.2008.08.017. [DOI] [PubMed] [Google Scholar]
- 19.Nin V, Escande C, Chini CC, et al. Role of deleted in breast cancer 1 (DBC1) protein in SIRT1 deacetylase activation induced by protein kinase A and AMP-activated protein kinase. J Biol Chem. 2012;287(28):23489–23501. doi: 10.1074/jbc.M112.365874. [DOI] [PMC free article] [PubMed] [Google Scholar]
- 20.Souza-Mello V, Gregorio BM, Cardoso-de-Lemos FS, de Carvalho L, Aguila MB, Mandarim-de-Lacerda CA. Comparative effects of telmisartan, sitagliptin and metformin alone or in combination on obesity, insulin resistance, and liver and pancreas remodelling in C57BL/6 mice fed on a very high-fat diet. Clin Sci (Lond) 2010;119(6):239–250. doi: 10.1042/CS20100061. [DOI] [PubMed] [Google Scholar]
- 21.Okamoto T, Kanemoto N, Ohbuchi Y, Okano M, Fukui H, Sudo T. Characterization of STZ-induced type 2 diabetes in Zucker fatty rats. Exp Anim. 2008;57(4):335–345. doi: 10.1538/expanim.57.335. [DOI] [PubMed] [Google Scholar]
- 22.Grace MH, Ribnicky DM, Kuhn P, et al. Hypoglycemic activity of a novel anthocyanin-rich formulation from lowbush blueberry, Vaccinium angustifolium Aiton. Phytomedicine. 2009;16(5):406–415. doi: 10.1016/j.phymed.2009.02.018. [DOI] [PMC free article] [PubMed] [Google Scholar]
- 23.Hou M, Venier N, Sugar L, et al. Protective effect of metformin in CD1 mice placed on a high carbohydrate-high fat diet. Biochem Biophys Res Commun. 2010;397(3):537–542. doi: 10.1016/j.bbrc.2010.05.152. [DOI] [PubMed] [Google Scholar]
- 24.Caton PW, Nayuni NK, Kieswich J, Khan NQ, Yaqoob MM, Corder R. Metformin suppresses hepatic gluconeogenesis through induction of SIRT1 and GCN5. J Endocrinol. 2010;205(1):97–106. doi: 10.1677/JOE-09-0345. [DOI] [PubMed] [Google Scholar]
- 25.Caton PW, Kieswich J, Yaqoob MM, Holness MJ, Sugden MC. Metformin opposes impaired AMPK and SIRT1 function and deleterious changes in core clock protein expression in white adipose tissue of genetically-obese db/db mice. Diabetes Obes Metab. 2011;13(12):1097–1104. doi: 10.1111/j.1463-1326.2011.01466.x. [DOI] [PubMed] [Google Scholar]
- 26.Hawley SA, Gadalla AE, Olsen GS, Hardie DG. The antidiabetic drug metformin activates the AMP-activated protein kinase cascade via an adenine nucleotide-independent mechanism. Diabetes. 2002;51(8):2420–2425. doi: 10.2337/diabetes.51.8.2420. [DOI] [PubMed] [Google Scholar]
- 27.Owen MR, Doran E, Halestrap AP. Evidence that metformin exerts its anti-diabetic effects through inhibition of complex 1 of the mitochondrial respiratory chain. Biochem J. 2000;348(Pt 3):607–614. [PMC free article] [PubMed] [Google Scholar]
- 28.Ouyang J, Parakhia RA, Ochs RS. Metformin activates AMP kinase through inhibition of AMP deaminase. J Biol Chem. 2011;286(1):1–11. doi: 10.1074/jbc.M110.121806. [DOI] [PMC free article] [PubMed] [Google Scholar]
- 29.Park SJ, Ahmad F, Philp A, et al. Resveratrol ameliorates aging-related metabolic phenotypes by inhibiting cAMP phosphodiesterases. Cell. 2012;148(3):421–433. doi: 10.1016/j.cell.2012.01.017. [DOI] [PMC free article] [PubMed] [Google Scholar]
- 30.Price NL, Gomes AP, Ling AJ, et al. SIRT1 is required for AMPK activation and the beneficial effects of resveratrol on mitochondrial function. Cell Metab. 2012;15(5):675–690. doi: 10.1016/j.cmet.2012.04.003. [DOI] [PMC free article] [PubMed] [Google Scholar]
- 31.Bruckbauer A, Zemel MB. Effects of dairy consumption on SIRT1 and mitochondrial biogenesis in adipocytes and muscle cells. Nutr Metab (Lond) 2011;8:91. doi: 10.1186/1743-7075-8-91. [DOI] [PMC free article] [PubMed] [Google Scholar]
- 32.Ismail-Beigi F. Pathogenesis and glycemic management of type 2 diabetes mellitus: a physiological approach. Arch Iran Med. 2012;15(4):239–246. [PubMed] [Google Scholar]
- 33.Petersen KF, Shulman GI. Etiology of insulin resistance. Am J Med. 2006;119(5 Suppl 1):S10–S16. doi: 10.1016/j.amjmed.2006.01.009. [DOI] [PMC free article] [PubMed] [Google Scholar]
- 34.Morino K, Petersen KF, Dufour S, et al. Reduced mitochondrial density and increased IRS-1 serine phosphorylation in muscle of insulin-resistant offspring of type 2 diabetic parents. J Clin Invest. 2005;115(12):3587–3593. doi: 10.1172/JCI25151. [DOI] [PMC free article] [PubMed] [Google Scholar]
- 35.Petersen KF, Befroy D, Dufour S, et al. Mitochondrial dysfunction in the elderly: possible role in insulin resistance. Science. 2003;300(5622):1140–1142. doi: 10.1126/science.1082889. [DOI] [PMC free article] [PubMed] [Google Scholar]
- 36.Gauthier MS, O’Brien EL, Bigornia S, et al. Decreased AMP-activated protein kinase activity is associated with increased inflammation in visceral adipose tissue and with whole-body insulin resistance in morbidly obese humans. Biochem Biophys Res Commun. 2011;404(1):382–387. doi: 10.1016/j.bbrc.2010.11.127. [DOI] [PMC free article] [PubMed] [Google Scholar]
- 37.Fujii N, Ho RC, Manabe Y, et al. Ablation of AMP-activated protein kinase alpha2 activity exacerbates insulin resistance induced by high-fat feeding of mice. Diabetes. 2008;57(11):2958–2966. doi: 10.2337/db07-1187. [DOI] [PMC free article] [PubMed] [Google Scholar]
- 38.Bergeron R, Previs SF, Cline GW, et al. Effect of 5-aminoimidazole-4-carboxamide-1-beta-D-ribofuranoside infusion on in vivo glucose and lipid metabolism in lean and obese Zucker rats. Diabetes. 2001;50(5):1076–1082. doi: 10.2337/diabetes.50.5.1076. [DOI] [PubMed] [Google Scholar]
- 39.Pold R, Jensen LS, Jessen N, et al. Long-term AICAR administration and exercise prevents diabetes in ZDF rats. Diabetes. 2005;54(4):928–934. doi: 10.2337/diabetes.54.4.928. [DOI] [PubMed] [Google Scholar]
- 40.Cool B, Zinker B, Chiou W, et al. Identification and characterization of a small molecule AMPK activator that treats key components of type 2 diabetes and the metabolic syndrome. Cell Metab. 2006;3(6):403–416. doi: 10.1016/j.cmet.2006.05.005. [DOI] [PubMed] [Google Scholar]