

Abstract
Introduction
Growth traits are important in poultry production, however, little is known for its regulatory mechanism at epigenetic level. Therefore, in this study, we aim to compare DNA methylation profiles between fast- and slow-growing broilers in order to identify candidate genes for chicken growth. Methylated DNA immunoprecipitation-sequencing (MeDIP-seq) was used to investigate the genome-wide DNA methylation pattern in high and low tails of Recessive White Rock (WRRh; WRRl) and that of Xinhua Chickens (XHh; XHl) at 7 weeks of age. The results showed that the average methylation density was the lowest in CGIs followed by promoters. Within the gene body, the methylation density of introns was higher than that of UTRs and exons. Moreover, different methylation levels were observed in different repeat types with the highest in LINE/CR1. Methylated CGIs were prominently distributed in the intergenic regions and were enriched in the size ranging 200–300 bp. In total 13,294 methylated genes were found in four samples, including 4,085 differentially methylated genes of WRRh Vs. WRRl, 5,599 of XHh Vs. XHl, 4,204 of WRRh Vs. XHh, as well as 7,301 of WRRl Vs. XHl. Moreover, 132 differentially methylated genes related to growth and metabolism were observed in both inner contrasts (WRRh Vs. WRRl and XHh Vs. XHl), whereas 129 differentially methylated genes related to growth and metabolism were found in both across-breed contrasts (WRRh Vs. XHh and WRRl Vs. XHl). Further analysis showed that overall 75 genes exhibited altered DNA methylation in all four contrasts, which included some well-known growth factors of IGF1R, FGF12, FGF14, FGF18, FGFR2, and FGFR3. In addition, we validate the MeDIP-seq results by bisulfite sequencing in some regions.
Conclusions
This study revealed the global DNA methylation pattern of chicken muscle, and identified candidate genes that potentially regulate muscle development at 7 weeks of age at methylation level.
Introduction
Chicken growth is important economic traits in poultry production. It was determined by the interactions among genetic, nutritional, and environmental factors [1]. Until now, there have been extensive genome-wide association studies, which have identified some genetic factors affecting chicken growth [2], [3]. And many candidate genes were reported to have important effects on growth [4]–[6]. Moreover, a large number of quantitative trait loci (QTLs) for chicken growth have been identified [7]–[11]. However, the genetic mechanisms in chicken growth system are still unknown and, polymorphism or QTL alone can not provide adequate explanations for them. Recently, epigenetic factors especially DNA methylation have received considerable attention because of its potential influence on complex traits and diseases [12]. Nevertheless, so far the epigenetic mechanisms responsible for chicken growth remain poorly understood.
DNA methylation is a stably inherited epigenetic modification in eukaryotes. Previous work has demonstrated the importance of DNA methylation in many biological processes like gene expression regulation, genomic imprinting, X chromosome inactivation, and disease development [13]–[19]. Recently, the research on genomic methylation has been extensively conducted in plants and mammals [20]–[22]. In birds, the genome-wide DNA methylation was firstly profiled in the muscle and liver tissues from two breeds including the red jungle fowl and avian broiler using Methylated DNA immunoprecipitation-sequencing (MeDIP-seq) [23].
The objective of the present study was to assay the genome-wide DNA methylation pattern in the muscle and to identify methylated genes that were involved in the chicken growth. Here, we collected breast muscle tissues of the two-tail samples from two chicken breeds exhibiting different growth performance at 7 weeks of age: Recessive White Rock (WRR) and Xinhua Chickens (XH), and compared the DNA methylation differences between these two breeds and within each breed by MeDIP-seq. Our analysis showed the landscape of DNA methylome distribution in the genome, revealed a large number of differentially methylated genes in different comparisons between or within two breeds, and identified genes related to the regulation of chicken growth at 7 weeks of age.
Materials and Methods
Ethics Statement
All animal experiments were handled in compliance with and approved by the Animal Care Committee of South China Agricultural University (Guangzhou, People’s Republic of China) with approval number SCAU#0011. All efforts were made to minimize suffering.
Animals
Two chicken breeds, WRR and XH, were used for DNA methylation investigation in the present study. WRR, a breed with fast growth rate, were obtained from Guangdong Wens Foodstuff Company Ltd, Guangdong, China. XH, a Chinese native breed with slow growth rate, were obtained from Zhicheng Avian Breeding Company Ltd, Guangdong, China. All broilers were reared in cages with a 24-h photoperiod for the first 2 d of age and then changed to a 16-h photoperiod. They were fed with free access to water and fed ad libitum with 16.5% CP and 2, 800 kcal of ME/kg. At 7 weeks of age, according to the body weight records, 3 female birds from each of the two-tail samples of WRR and XH were selected and then four groups including WRRh, WRRl, XHh, and XHl were generated. The BW values were 1,064.0±11.1, 695.0±24.4, 305.8±23.3, and 207.6±11.1 g in the WRRh, WRRl, XHh, and XHl group, respectively. Breast muscle tissues of the 12 individuals were collected and stored at −80°C until DNA extraction.
DNA Extraction and Preparation for MeDIP-seq
Genomic DNA was isolated using TaKaRa Universal Genomic DNA Extraction Kit Ver. 3.0 (DV811A) (TaKaRa, Osaka, Japan) according to the manufacturer’s protocol and then DNA quality was evaluated by agarose gel electrophoresis and spectrophotometer. DNA from 3 birds within each group was mixed in equal amounts to generate a pooled sample using Quant-iT dsDNA HS Assay Kit (Invitrogen, Carlsbad, CA, USA). Subsequently, these four pooled samples were sonicated to produce DNA fragments ranging from 100–500 bp. After end repairing, phosphorylating and A-tailing with Paired-End DNA Sample Prep kit (Illumina, San Diego, CA, USA), DNA was ligated to an Illumina sequencing primer adaptor. Then the fragments were used for MeDIP enrichment using Magnetic Methylated DNA Immunoprecipitation kit (Diagenod, Liège, Belgium) following the manufacturer’s recommendation and the qualifying DNA was used for PCR amplification. Then bands between 220 and 320 bp were excised from the gel and purified with QIAquick Gel Extraction Kit (Qiagen, Valencia, CA, USA). Products were quantified with Quant-iTTM dsDNA HS Assay Kit (Invitrogen, Carlsbad, CA, USA) on an Agilent 2100 Analyzer (Agilent Technologies, Santa Clara, CA, USA). Following qPCR qualification, DNA libraries were sequenced on the Illumina Hiseq 2000 (Illumina, San Diego, CA, USA) to generate paired-end 50-bp reads by the Beijing Genomics Institute (BGI, Shenzhen, Guangdong, China).
Bisulfite Sequencing
Five pairs of primers (Table 1) were designed with Methyl Primer Express Software v1.0, including one pair (P1) for the validation of relatively low methylated regions and four pairs (P2–P5) for high methylated regions. Two micrograms of pooled DNA from each group was firstly treated with the EpiTect Bisulfite kit (Qiagen, Valencia, CA, USA) and used as the template for the following semi-nested PCR amplification. PCR for PM1 and PM2 was performed in 50-µL reaction mixtures containing 50 ng of DNA, 1 µM of each primer and 25 µL Premix EX Taq™ Hot Start Version (TaKaRa, Osaka, Japan) with the conditions as: 94°C for 1 min; 35 cycles of 98°C for 10 s, 62°C for 30 s and 72°C for 30 s; and 72°C for 5 min. Reactions for PM3 to PM5 were carried out in a total volume of 50 µL including 50 ng of DNA, 1 µM of each primer and 2.5 U LA Taq HS (TaKaRa, Osaka, Japan). Both of the first and the second reaction rounds were performed under the following conditions: 94°C for 3 min; 35 cycles of 94°C for 30 s, 62°C for 30 s and 72°C for 30 s; and 72°C for 5 min. The PCR products were purified with a Gel Extraction Kit (Tiangen, Beijing, China) according to the manufacturer’s instructions and then cloned into the pMD18-T vector (Takara, Osaka, Japan). For each primer, 10 clones were sequenced by BGI (Shenzhen, Guangdong, China) with commercial service and the resulting data were analyzed using ClustalW.
Table 1. The information of primers for bisulfite sequencing.
| Primers | Primer sequence (5′→3′) | Length1 (bp) | AT2 (°C) | Location3 |
| PM1 | F: GGTGGTAGTTGTATTTTTTTTGT | 415 | 62 | chr9: 6199130–6199544 |
| R: CTATACACAACTCCCCTAAACATA | ||||
| PM2 | F:TTGATTGTAGTGGATTTGGATT | 354 | 62 | chr6: 10360074–10360427 |
| R: TACTCTCCTTCCAAACAAACC | ||||
| PM3 | F: GGTTTGTTTGGAAGGAGAGTAA | 357 | 62 | chr6: 1036407–10360763 |
| R: AAAAAACCTCTACTCCACCTCC | ||||
| PM4 | F: AGTAGGGGTGGATTTGGAATAT | 346 | 62 | chrUn_ Random: 45286930–45287275 |
| R: CAATCTTCCCTTCCCTAAAACT | ||||
| PM5 | F: GTGAGTAGTTTTAGGGAAGGGA | 433 | 62 | chrUn_Random: 45287248–45287680 |
| R: ACTCCACCCCTACAAACTAAAC |
referred to the product length.
indicated annealing temperature.
indicated the PCR amplified locations in chicken chromosomes.
Bioinformatic Analysis
Raw data obtained from Illumina sequencing were first processed to filter out reads containing adapters, unknown or low quality bases and then were mapped to the chicken reference genome (ftp://ftp.ensembl.org/pub/release-63/fasta/gallus_gallus/dna/) by SOAPaligner v 2.21 (http://soap.genomics.org.cn/) with no more than 2 bp mismatches [24]. The uniquely mapped data were retained for reads distribution analysis including the distribution in chicken chromosomes and the distribution in different components of the genome. Gene information was downloaded from the public FTP site of Ensembl (ftp://ftp.ensembl.org/pub/release-63/gtf/gallus_gallus/) and the region from transcript starting site to transcript ending site was defined as gene body region. The CpG islands (CGIs) were scanned by CpGPlot (https://gcg.gwdg.de/emboss/cpgplot.html) with the criteria as: length exceeding 200 bp, GC content greater than 50%, and observed-to-expected CpG ratio greater than 0.6. Repeat annotations were obtained from the UCSC database (http://hgdownload.cse.ucsc.edu/goldenPath/rn4/bigZips/chromOut.tar.gz) and the analysis of reads distribution on repeats was carried out by RepeatMasker (http://www.repeatmasker.org/). Then genome-wide methylation peak scanning was conducted using the MACS V 1.4.2 (http://liulab.dfci.harvard.edu/MACS/) [25]. The number of peaks in different components of the chicken genome (such as promoters, 5′ UTR, 3′ UTR, exon, intron, intergenic regions, CGIs, and repeats) was analyzed in our study. Moreover, the number of methylated peaks in the whole genome, called total peak number, was also analyzed in each sample and here a peak overlapping among the different components was just counted for one time. The methylation densities in different components of the genome were compared by calculating the ratio of methylated peaks in a particular component to the total area of that region. Statistical analyses of methylation level differences in different components of the genome and CGIs density differences in different size classes were processed with least square method by JMP 8.0 software (http://www.jmp.com/; SAS Institute Inc., Cary, NC, USA). All genes with peaks were used for the subsequent gene ontology (GO) analysis and pathway analysis. GO term information was obtained from the UniProtKB-GOA database (http://www.ebi.ac.uk/GOA/). Genes exhibiting more than 2-fold methylation level changes in different samples were analyzed for GO and KEGG pathway enrichments using the DAVID Functional Annotation Tool (http://david.abcc.ncifcrf.gov/) [26], with P<0.005 and Benjiamini adjusted p<0.05.
Online Data Deposition
The MeDIP-Seq data from this study have been deposited in NCBI Sequence Read Archive with accession number GSE42751 (http://www.ncbi.nlm.nih.gov/geo/query/acc.cgi?acc=GSE42751).
Results
Assemble and Blast Analysis of MeDIP-seq Reads
In the present study, three breast muscle tissues were used to generate one pooled DNA sample for each group of WRRh, WRRl, XHh, and XHl. A range of 36,734,694 to 33,399,566 raw reads were generated for the four groups, respectively. In each group, about 65% of the reads were mapped and about 36% of the reads were uniquely mapped to the chicken genome (Table 2). The uniquely mapping reads of WRRh, WRRl, XHh, and XHl covered 21.05%, 18.10%, 21.26%, and 20.03% of the chicken genome, respectively.
Table 2. Data generated by MeDIP-seq.
| Sample1 | Total numberof reads | Total MappedReads | Total Unique MappedReads | Percentage of mappedreads in total reads | Percentage of unique mapped reads |
| WRRh | 36,734,694 | 23,877,624 | 13,087,223 | 65.00% | 35.63% |
| WRRl | 33,399,566 | 21,861,843 | 12,287,910 | 65.46% | 36.79% |
| XHh | 36,734,694 | 23,472,733 | 12,875,987 | 63.90% | 35.05% |
| XHl | 36,734,694 | 23,897,397 | 13,728,925 | 65.05% | 37.37% |
WRRh, WRRl, XHh, and XHl indicated the group of Recessive White Rock with high body weight, Recessive White Rock with low body weight, Xinhua Chickens with high body weight, and Xinhua Chickens with low body weight, respectively.
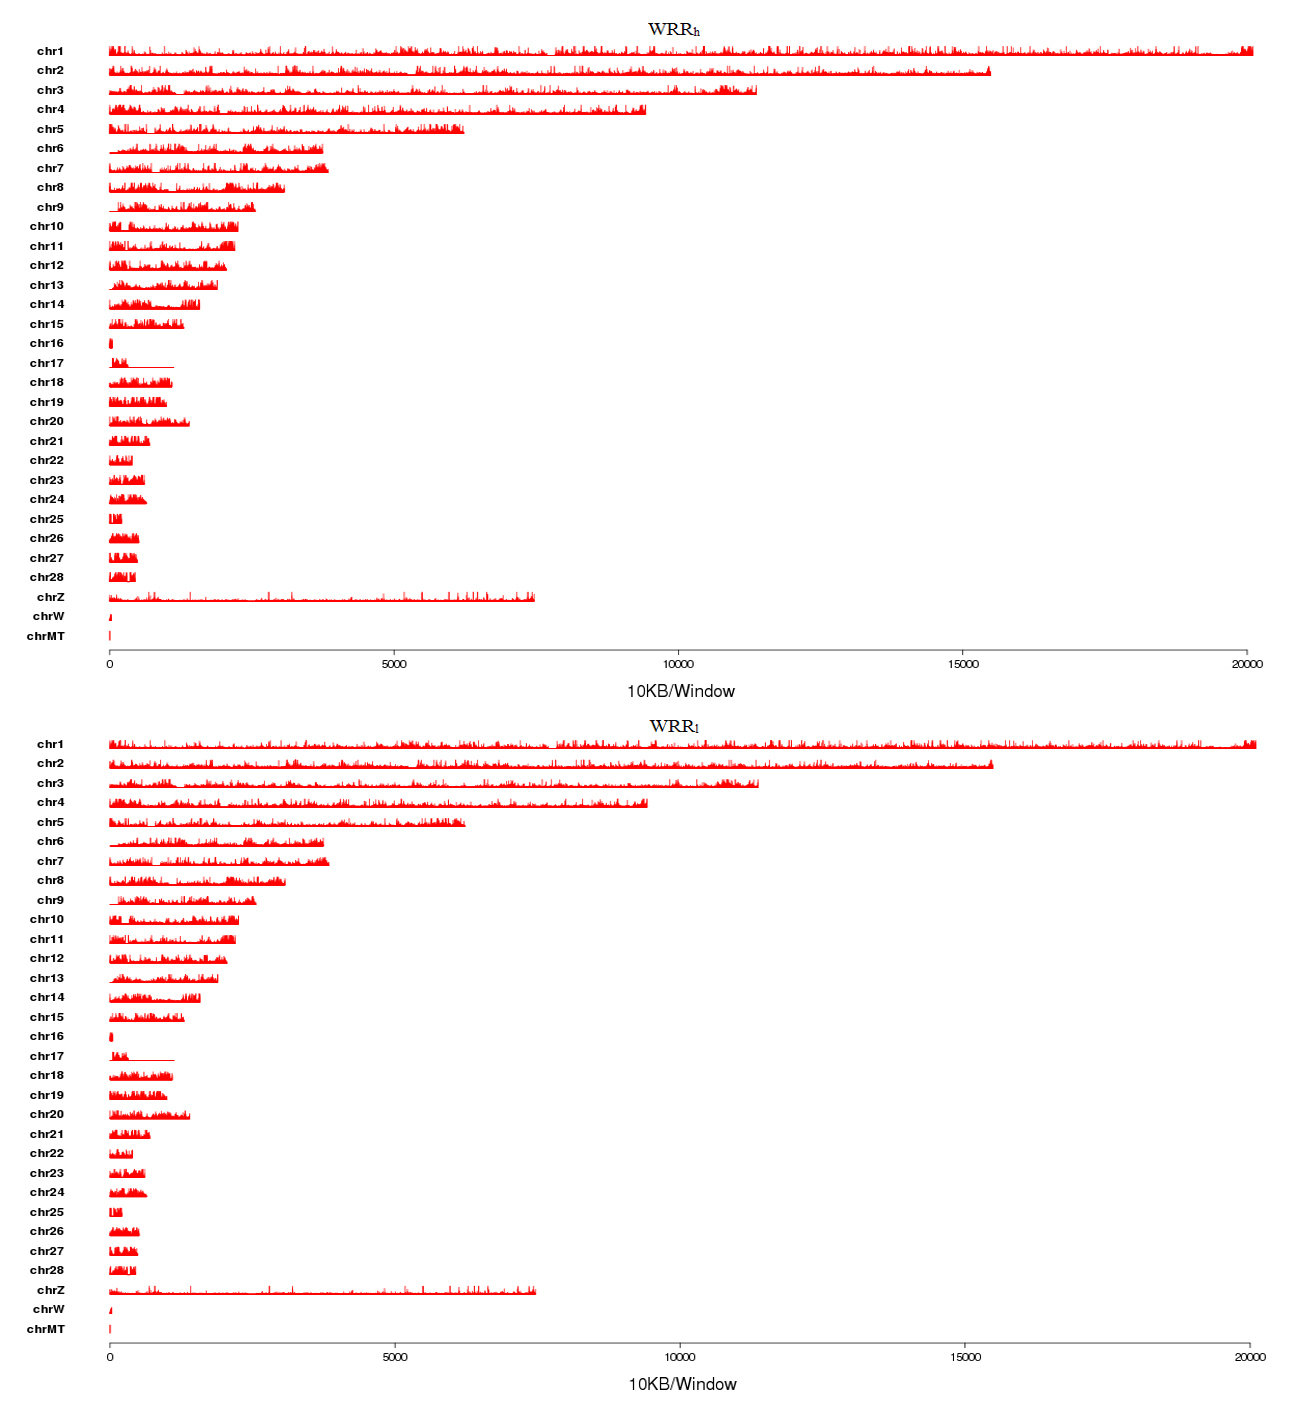
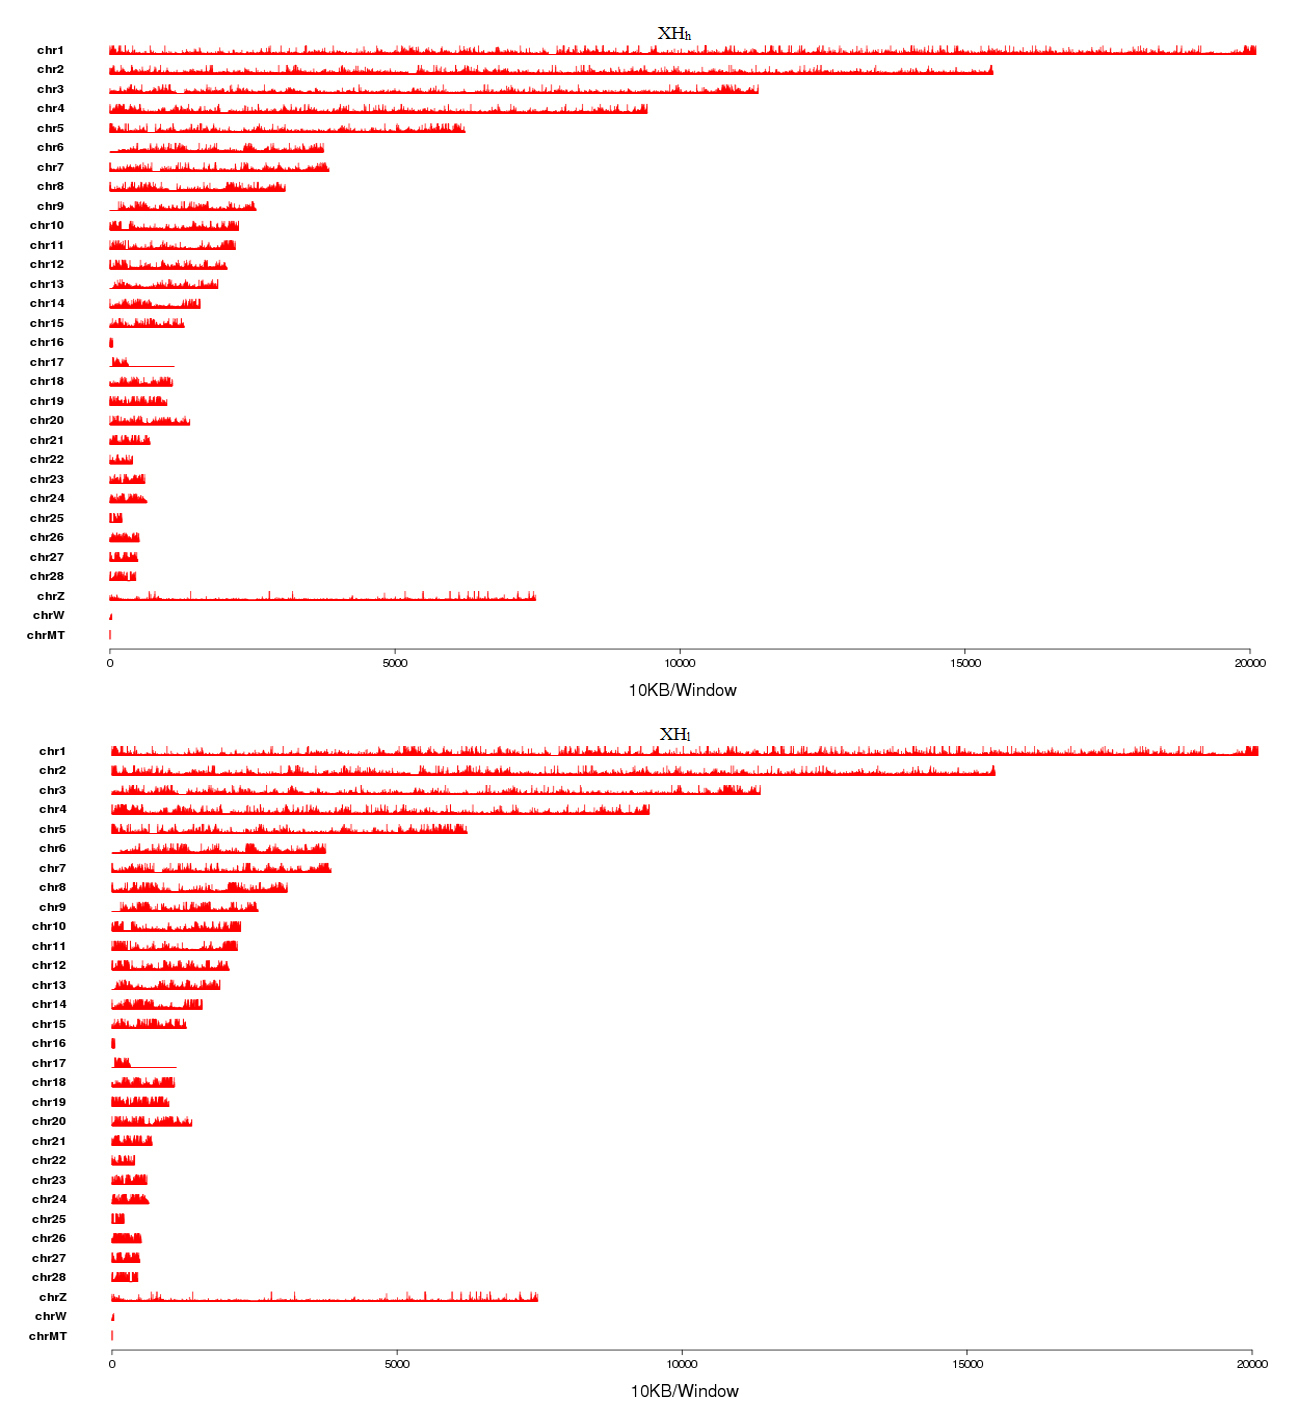
MeDIP-seq reads were detected in most chromosomal regions (GGA1-28, chromosome Z, chromosome W, and chromosome MT) in each group except for some gaps (Figure S1, S2). However, no uniquely mapped but just multi-mapped reads could be found in a long region of GGA17 (from 3,180,001 to 11,182,526 bp).
The analysis of read distribution in different components of the genome showed that the uniquely mapped reads were mainly present in repeat elements. A range of 17.42% to 19.84% of them belonged to the gene body regions. The proportion of reads uniquely mapped to CGIs in WRRh, WRRl, XHh, and XHl was only 1.00%, 0.87%, 0.97%, and 1.02%, respectively (Figure 1).
Figure 1. Genomic distribution of the uniquely mapped reads.

All uniquely mapped reads were classified into four types: reads uniquely mapped to CpG islands (dark blue), genes bodies (green), repeats (red), others (light blue). The percentage for each class was given at the top of each graph. WRRh, WRRl, XHh, and XHl indicated the group of Recessive White Rock with high body weight, Recessive White Rock with low body weight, Xinhua Chickens with high body weight, and Xinhua Chickens with low body weight, respectively.
MeDIP-seq Data Validation
In this study, one region with relatively low methylation and two regions with high methylation were selected randomly to carry out bisulfite sequencing for the validation of MeDIP-seq data. We found that the bisulfite sequencing results were almost in accordance with the MeDIP-seq results (Figure 2, Figure S3 and S4).
Figure 2. The validation of MeDIP-seq data by bisulfite sequencing.

One region with high methylation obtained from MeDIP-Seq data was selected and its methylation pattern was assessed by bisulfite sequencing. Each line corresponded to a single strand of DNA and each circle represented a single CpG dinucleotide. Filled circles and open circles indicated methylated sites and unmethylated sites, respectively.
DNA Methylation Profiles of the Chicken
In order to decipher the genome-wide DNA methylation profiles of the chicken, we used the uniquely mapped reads to detect the methylated peak and further analyzed the peak distribution in different components of the genome through the comparison of their methylation densities. Here, the genomic regions 2 Kb upstream and downstream of the TSS were regarded as the proximal promoter. We obtained 44,945, 44,832, 42,747, and 53,821 methylated peaks in WRRh, WRRl, XHh, and XHl, respectively (Table 3). A major portion of them were present in the intergenic regions followed by introns and exons. The average methylation density comparison showed that there were significantly differential methylation levels in different components of the genome (P<0.01) (Figure 3). Among all the classes, the average methylation density of promoters was the lowest followed by CGIs. The exon and intron regions exhibited significantly higher methylation levels than the intergenic regions (P<0.01). Within the gene body, the methylation density of introns was significantly higher than UTRs and exons (P<0.01). Repeats showed a relatively high methylation level. Moreover, we observed different methylation levels in different repeat types with high methylation in LINE/CR1 (44.5%), LTR/ERVL (20.6%), and simple repeat (9.3%) (Table 4).
Table 3. The peak distribution in different components of the chicken genome.
| Sample1 | Total peak number2 | Promoter | 5′UTR | Exon | Intron | 3′UTR | Intergenic | CGI | Repeats |
| WRRh | 44945 | 3838 | 608 | 10633 | 17689 | 1362 | 29390 | 4406 | 7493 |
| WRRl | 44832 | 3582 | 537 | 10388 | 17593 | 1268 | 31712 | 4020 | 6239 |
| XHh | 42747 | 3930 | 554 | 9970 | 16510 | 1278 | 27270 | 4412 | 6995 |
| XHl | 53821 | 4185 | 740 | 12781 | 20746 | 1563 | 36962 | 5084 | 7239 |
WRRh, WRRl, XHh, and XHl indicated the group of Recessive White Rock with high body weight, Recessive White Rock with low body weight, Xinhua Chickens with high body weight, and Xinhua Chickens with low body weight, respectively.
Total peak number indicated the number of methylated peaks in the whole genome in each sample.
Figure 3. Methylation distribution in different genomic regions.

Methylation density within promoter, gene body and intergenic regions was calculated with the ratio of methylated peaks in a particular component to the total area of that region.
Table 4. The distribution of methylated peaks in different repeat types.
| Repeat type | WRRh 1 | WRRl 1 | XHh 1 | XHl 1 |
| DNA | 2.19 | 2.85 | 2.37 | 3.38 |
| DNA/TcMar | 0.87 | 1.09 | 0.81 | 1.22 |
| LINE/CR1 | 44.57 | 43.23 | 41.39 | 48.78 |
| Low_complexity | 6.7 | 8.74 | 9.96 | 6.87 |
| LTR | 0.39 | 0.38 | 0.31 | 0.41 |
| LTR/ERV1 | 3.88 | 2.48 | 2.56 | 2.69 |
| LTR/ERVK | 4.55 | 3.27 | 3.65 | 3.18 |
| LTR/ERVL | 21.83 | 21.16 | 20.24 | 19.34 |
| rRNA | 0.08 | 0.08 | 0.09 | 0.12 |
| Satellite | 2.72 | 3.14 | 4.15 | 3.34 |
| Satellite/macro | 2.88 | 1.28 | 0.96 | 1.41 |
| Satellite/W-chromosome | 1.07 | 1.23 | 1.16 | 1.11 |
| Simple_repeat | 7.79 | 10.34 | 11.68 | 7.39 |
| SINE | 0.19 | 0.3 | 0.29 | 0.43 |
| tRNA | 0.05 | 0.1 | 0.07 | 0.07 |
| Unknown | 0.23 | 0.32 | 0.31 | 0.26 |
WRRh, WRRl, XHh, and XHl indicated the group of Recessive White Rock with high body weight, Recessive White Rock with low body weight, Xinhua Chickens with high body weight, and Xinhua Chickens with low body weight, respectively.
Distribution of DNA Methylation in CGIs
CGIs were associated with the majority of the annotated gene promoters and were reported to be lowly methylated in the vertebrate genome [27], [28]. In this study, CGIs were classified into two types based on their methylation status. CGIs containing methylated peaks were regarded as methylated CGIs and the rest were termed as unmethylated. In the chicken genome, there were a total of 33,915 CGIs. Of these CGIs, about 13.0% (n = 4,406) were methylated in WRRh, 11.9% (n = 4,020) in WRRl, 13.0% (n = 4,412) in XHh, and 15.0% (n = 5,084) in XHl (Table 5). Most of the methylated CGIs were present in the intergenic regions. Within the gene body, exons showed more methylated CGIs than UTRs and introns. Moreover, when classified methylated CGIs of each class according to their sizes, we found that the CGI number significantly decreased (P<0.05) with increase in the size of islands except for that in the 3′UTR region and more than 20% of methylated CGIs were in the size range of 200–300 bp (Figure 4). The number of unmethylated CGIs was significantly more (P<0.01) than that of methylated CGIs in each size. The densities of unmethylated CGIs in different size classes were significantly different (P<0.05) for each region. Furthermore, we found that unmethylated CGIs were enriched in promoters compared to other classes (25%).
Table 5. Summary of methylated CGIs in the group of WRRh, WRRl, XHh, and XHl.
| Sample1 | 5′UTR | 3′UTR | Exon | Intron | Intergenic | Total methylated CGIs | Total CGIs | Methylated (%) |
| WRRh | 54 | 88 | 1154 | 844 | 3195 | 4406 | 33915 | 13.0 |
| WRRl | 49 | 80 | 1044 | 750 | 2853 | 4020 | 33915 | 11.9 |
| XHh | 56 | 96 | 1158 | 838 | 3208 | 4412 | 33915 | 13.0 |
| XHl | 66 | 101 | 1322 | 970 | 3687 | 5084 | 33915 | 15.0 |
WRRh, WRRl, XHh, and XHl indicated the group of Recessive White Rock with high body weight, Recessive White Rock with low body weight, Xinhua Chickens with high body weight, and Xinhua Chickens with low body weight, respectively.
Figure 4. Genomic distribution of methylated and unmethylated CpG islands.

We subdivided CpG islands into methylated and unmethylated islands and then categorized them into different bins according to their sizes. A. Genomic distribution of methylated CpG islands. B. Genomic distribution of unmethylated CpG islands. The number of CpG islands in a particular bin was calculated in different regions and subsequently it was normalized by the total number of CpG islands in that bin. Here the genomic region 2 kb upstream and downstream of the transcription start site was regarded as promoter. A, B, C, and D indicated the group of Recessive White Rock with high body weight (WRRh), Recessive White Rock with low body weight (WRRl), Xinhua Chickens with high body weight (XHh), and Xinhua Chickens with low body weight (XHl), respectively.
GO Analysis of Methylated Genes in the Four Samples
In the present study, genes that overlapped with the methylation peaks in promoters or gene body regions were termed as methylated genes. A total of 13,294 methylated genes were found in the four samples, including 9,415 in WRRh, 9,360 in WRRl, 9,124 in XHh, and 10,075 in XHl (Figure 5). Of them, 5,473 methylated genes were identified in all of the four groups. GO assignments showed that these methylated genes were involved in one or more of the three categories: biological process, cellular component, and molecular function (Table S1, Dataset S1). Among them, 2,163 belonged to biological process categories, including cellular process (1,776; 23.55%), metabolic process (1,703; 22.58%), response to stimulus (690; 9.15%), localization (428; 5.67%), biological regulation (425; 5.64%), establishment of localization (416; 5.52%), and others (Figure 6A). Furthermore, 2,064 methylated genes belonged to cellular component categories, including cell part (2,025; 27.49%), cell (2,025; 27.49%), organelle (1,403; 19.05%), membrane (651; 8.84%), organelle part (457; 6.21%), macromolecular complex (399; 5.42%), membrane part (237; 3.22%), membrane-enclosed lumen (114; 1.55%), and others (54; 0.73%) (Figure 6B). On the other hand, a total of 2,471 methylated genes were found to be involved in molecular function categories, including catalytic activity (1,992; 45.73%), binding (1,868; 42.89%), transporter activity (218; 5.00%), molecular transducer activity (75; 1.72%), enzyme regulator activity (60; 1.38%), structural molecule activity (58; 1.33%), and others (85; 1.95%) (Figure 6C).
Figure 5. Methylated genes among four groups of WRRh, WRRl, XHh, and XHl.
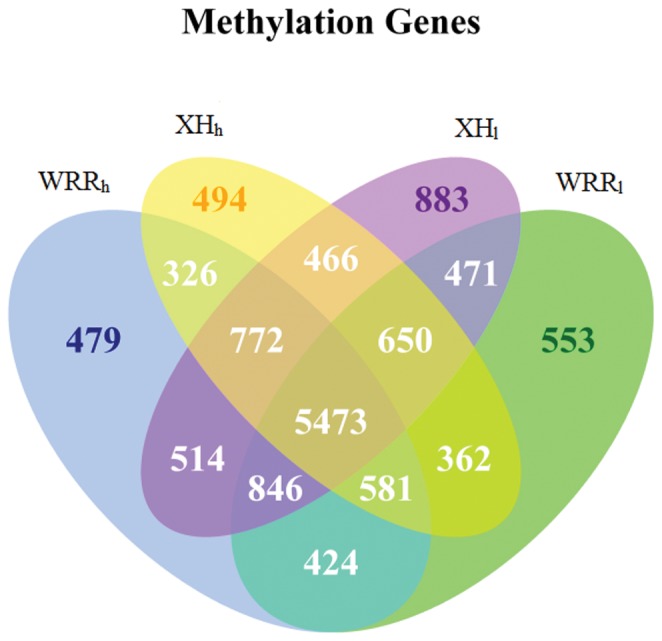
The methylated gene number was given at the top of each figure section. WRRh, WRRl, XHh, and XHl indicated the group of Recessive White Rock with high body weight, Recessive White Rock with low body weight, Xinhua Chickens with high body weight, and Xinhua Chickens with low body weight, respectively.
Figure 6. Functional classification of the whole methylated genes.

(A) GO: Biological process. (B) Cellular component. (C) GO: Molecular function.
Differentially Methylated Genes Among the Four Samples
Comparison of gene methylation showed that there were 4,085 differentially methylated genes (coverage changes was more than two folds; p value <0.01) between WRRh and WRRl (WRRh Vs. WRRl), 5,599 between XHh and XHl (XHh Vs. XHl), 4,204 between WRRh and XHh (WRRh Vs. XHh), as well as 7,301 between WRRl and XHl (WRRl Vs. XHl) (Figure 7, Dataset S2). Moreover, 2,259 differentially methylated genes were found in both WRRh Vs. WRRl and XHh Vs. XHl, while 2,758 were identified in both WRRh Vs. XHh and WRRl Vs. XHl. Of these, 1,400 genes were differently methylated in all of the four comparisons. We subsequently analyzed the direction and degree of methylation difference for the four contrasts in different gene regions. The results showed that there were more down-methylated genes than up-methylated genes in the WRRh Vs. WRRl and WRRh Vs. XHh contrasts, whereas a greater number of up-methylated than down-methylated genes were observed in both XHh Vs. XHl and WRRl Vs. XHl (Table 6). Furthermore, there were 12, 3, 151, 562, 4, and 7 common differentially methylated genes between WRRh Vs. WRRl (up) and XHh Vs. Xhl (up) in the upstream 2 k, 5′ UTR, exon, intron, 3′ UTR, and downstream 2 k, respectively, and 5, 0, 74, 528, 2, and 3 common genes between WRRh Vs. WRRl (down) and XHh Vs. Xhl (down) in those regions, respectively (Table S2). On the other hand, 56, 26, 332, 947, 15, and 45 common genes were found between WRRh Vs. XHh (up) and WRRl Vs. Xhl (up) in the upstream 2 k, 5′ UTR, exon, intron, 3′ UTR, and downstream 2 k, respectively, and 13, 3, 113, 570, 1, and 18 common genes between WRRh Vs. XHh (down) and WRRl Vs. Xhl (down) in those regions, respectively (Table S2).
Figure 7. Differentially methylated genes unique or shared among four contrasts of WRRh Vs. WRRl, XHh Vs. XHl, WRRh Vs. XHh, and WRRl Vs. XHl.

The number of differently methylated genes in each comparison was given at the top of each section of figures. WRRh Vs. WRRl indicated the comparison between the two-tail samples of Recessive White Rock. XHh Vs. XHl indicated the comparison between the two-tail samples of Xinhua Chickens. WRRh Vs. XHh indicated the comparison between the groups of Recessive White Rock and Xinhua Chickens with high body weight. WRRl Vs. XHl indicated the comparison between the groups of Recessive White Rock and Xinhua Chickens with low body weight.
Table 6. Numbers of differentially methylated genes for each contrast in different gene regions.
| Contrast1 | Upstream 2 k | 5′UTR | Exon | Intron | 3′UTR | Downstream 2 k |
| WRRh Vs. WRRl (up) | 108 | 20 | 474 | 1135 | 32 | 89 |
| WRRh Vs. WRRl (down) | 367 | 71 | 1447 | 2396 | 160 | 303 |
| XHh Vs. XHl (up) | 700 | 179 | 2665 | 3373 | 341 | 578 |
| XHh Vs. XHl (down) | 100 | 12 | 449 | 1198 | 33 | 84 |
| WRRh Vs. XHh (up) | 192 | 48 | 739 | 1571 | 57 | 161 |
| WRRh Vs. XHh (down) | 291 | 65 | 1187 | 2127 | 132 | 257 |
| WRRl Vs. XHl (up) | 1138 | 349 | 3830 | 4587 | 585 | 996 |
| WRRl Vs. XHl (down) | 115 | 16 | 468 | 1276 | 33 | 107 |
WRRh, WRRl, XHh, and XHl indicated the group of Recessive White Rock with high body weight, Recessive White Rock with low body weight, Xinhua Chickens with high body weight, and Xinhua Chickens with low body weight, respectively. For each contrast, up meant that there were greater peaks in the second group than the first group within the same region, whereas down meant there were greater peaks in the first group than the second group (p value<0.01).
KEGG Pathway Analysis
In order to investigate the pathway categories of differentially methylated genes, we performed a DAVID functional annotation analysis. The results showed that the common differentially methylated genes of the WRRh Vs. WRRl and XHh Vs. XHl contrasts were significantly enriched (Benjiamini adjusted p<0.05) in 9 predicted pathways, including several growth and metabolic related pathways such as Wnt signaling pathway, MAPK signaling pathway, ErbB signaling pathway, focal adhesion, and adherens junction (Table 7). A total of 132 differentially methylated genes involved in these 5 pathways were observed in the contrasts within the two breeds (WRR and XH) (Table S3) and some of those genes were crucial to chicken growth: IGF1, IGF1R, MYL9, MYLK, FGF12, FGF13, FGF14, FGF18, FGFR1, FGFR2, FGFR3, etc. Analysis of the common differentially methylated genes in the WRRh Vs. XHh and WRRl Vs. XHl contrasts showed significant enrichment (Benjiamini adjusted p<0.05) in 8 KEGG pathways, including some related to growth and metabolic such as MAPK signaling pathway, adherens junction, focal adhesion, and tight junction (Table 8). There were 129 differentially methylated genes in these 4 pathways, including some affecting growth such as IGF1R, MYH11, MYH15, MYH7B, MYLK2, FGF12, FGF14, FGF18, FGFR2, FGFR3, TGFBR1, and TGFBR2 (Table S4). Further analysis of differentially methylated genes in pathways we concerned showed that 75 genes exhibited altered DNA methylation in all of the four contrasts including WRRh Vs. WRRl, XHh Vs. XHl, WRRh Vs. XHh, and WRRl Vs. XHl (Table 9). Moreover, IGF1R and several genes belonging to the FGF family and receptors (FGF12, FGF14, FGF18, FGFR2, and FGFR3) were contained among them.
Table 7. KEGG pathways in which the common differentially methylated genes of WRRh Vs. WRRl and XHh Vs. XHl enriched.
| No. | Pathways | P value | Benjiamini1 |
| 1 | Focal adhesion | 4.60E−05 | 5.90E−03 |
| 2 | Wnt signaling pathway | 2.30E−04 | 1.50E−02 |
| 3 | MAPK signaling pathway | 2.80E−04 | 1.20E−02 |
| 4 | Melanogenesis | 3.10E−04 | 1.00E−02 |
| 5 | ErbB signaling pathway | 4.70E−04 | 1.20E−02 |
| 6 | Vascular smooth muscle contraction | 4.80E−04 | 1.00E−02 |
| 7 | Phosphatidylinositol signaling system | 1.40E−03 | 2.50E−02 |
| 8 | Calcium signaling pathway | 1.50E−03 | 2.50E−02 |
| 9 | Adherens junction | 2.60E−03 | 3.70E−02 |
KEGG pathway enrichments were performed with the DAVID Functional Annotation Tool (http://david.abcc.ncifcrf.gov/) and Benjiamini adjusted p<0.05 was regarded as enriched.
Table 8. KEGG pathways in which the common differentially methylated genes of WRRh Vs. XHh and WRRl Vs. XHl enriched.
| No. | Pathways | P value | Benjiamini1 |
| 1 | MAPK signaling pathway | 3.00E−04 | 3.80E−02 |
| 2 | Adherens junction | 4.10E−04 | 2.60E−02 |
| 3 | Focal adhesion | 4.50E−04 | 1.90E−02 |
| 4 | Melanogenesis | 5.60E−04 | 1.80E−02 |
| 5 | Tight junction | 1.20E−03 | 3.00E−02 |
| 6 | Phosphatidylinositol signaling system | 1.40E−03 | 2.90E−02 |
| 7 | Calcium signaling pathway | 1.80E−03 | 3.20E−02 |
| 8 | Vascular smooth muscle contraction | 2.00E−03 | 3.20E−02 |
KEGG pathway enrichments were performed with the DAVID Functional Annotation Tool (http://david.abcc.ncifcrf.gov/) and Benjiamini adjusted p<0.05 was regarded as enriched.
Table 9. Differentially methylated genes shared by WRRh Vs. WRRl, XHh Vs. XHl, WRRh Vs. XHh, and WRRl Vs. XHl.
| No. | Gene | Description |
| 1 | ACTN1 | actinin, alpha 1 |
| 2 | AKT3 | v-akt murine thymoma viral oncogene homolog 3 (protein kinase B, gamma) |
| 3 | BCL2 | B-cell CLL/lymphoma 2 |
| 4 | CACNA1B | calcium channel, voltage-dependent, N type, alpha 1B subunit |
| 5 | CACNA1D | calcium channel, voltage-dependent, L type, alpha 1D subunit |
| 6 | CACNA1H | calcium channel, voltage-dependent, T type, alpha 1H subunit |
| 7 | CACNA1I | calcium channel, voltage-dependent, T type, alpha 1I subunit |
| 8 | CACNA2D1 | calcium channel, voltage-dependent, alpha 2/delta subunit 1; similar to voltage-gated calcium channel alpha2/delta-1 subunit |
| 9 | CACNA2D3 | calcium channel, voltage-dependent, alpha 2/delta 3 subunit |
| 10 | CACNB2 | calcium channel, voltage-dependent, beta 2 subunit |
| 11 | CACNG2 | calcium channel, voltage-dependent, gamma subunit 2 |
| 12 | CAPN2 | calpain 2, (m/II) large subunit |
| 13 | COL5A2 | collagen, type V, alpha 2 |
| 14 | COL6A2 | collagen, type VI, alpha 2 |
| 15 | CREBBP | CREB binding protein (Rubinstein-Taybi syndrome) |
| 16 | CSNK2A1 | casein kinase 2, alpha 1 polypeptide |
| 17 | CTNNA2 | catenin (cadherin-associated protein), alpha 2 |
| 18 | CTNNA3 | catenin (cadherin-associated protein), alpha 3 |
| 19 | EP300 | E1A binding protein p300 |
| 20 | EVI1 | ecotropic viral integration site 1 |
| 21 | FARP2 | FERM, RhoGEF and pleckstrin domain protein 2 |
| 22 | FGF12 | fibroblast growth factor 12 |
| 23 | FGF14 | fibroblast growth factor 14 |
| 24 | FGF18 | fibroblast growth factor 18 |
| 25 | FGFR2 | fibroblast growth factor receptor 2 |
| 26 | FGFR3 | fibroblast growth factor receptor 3 |
| 27 | FLNB | filamin B, beta (actin binding protein 278) |
| 28 | FLT1 | fms-related tyrosine kinase 1 (vascular endothelial growth factor/vascular permeability factor receptor) |
| 29 | GSK3B | glycogen synthase kinase 3 beta |
| 30 | HRAS | v-Ha-ras Harvey rat sarcoma viral oncogene homolog |
| 31 | IGF1R | insulin-like growth factor 1 receptor |
| 32 | ITGA9 | integrin, alpha 9 |
| 33 | ITGB1 | integrin, beta 1 (fibronectin receptor, beta polypeptide, antigen CD29 includes MDF2, MSK12) |
| 34 | ITGB5 | integrin, beta 5 |
| 35 | KRAS | v-Ki-ras2 Kirsten rat sarcoma viral oncogene homolog |
| 36 | LAMA3 | laminin, alpha 3 |
| 37 | LAMB3 | laminin, beta 3 |
| 38 | LMO7 | LIM domain 7 |
| 39 | LOC422316 | similar to receptor tyrosine kinase flk-1/VEGFR-2 |
| 40 | MAP2K4 | mitogen-activated protein kinase kinase 4 |
| 41 | MAP2K5 | mitogen-activated protein kinase kinase 5 |
| 42 | MAP3K3 | mitogen-activated protein kinase kinase kinase 3 |
| 43 | MAP3K5 | mitogen-activated protein kinase kinase kinase 5 |
| 44 | MAP3K7 | mitogen-activated protein kinase kinase kinase 7 |
| 45 | MAP4K4 | mitogen-activated protein kinase kinase kinase kinase 4; similar to mitogen-activated protein kinase kinase kinase kinase 4 |
| 46 | MAPK14 | mitogen-activated protein kinase 14 |
| 47 | MAPKAPK2 | mitogen-activated protein kinase-activated protein kinase 2 |
| 48 | MAPKAPK5 | mitogen-activated protein kinase-activated protein kinase 5 |
| 49 | MKNK1 | MAP kinase interacting serine/threonine kinase 1 |
| 50 | NF1 | neurofibromin 1 |
| 51 | NFKB1 | nuclear factor of kappa light polypeptide gene enhancer in B-cells 1 |
| 52 | PAK7 | p21(CDKN1A)-activated kinase 7 |
| 53 | PARD3 | par-3 partitioning defective 3 homolog (C. elegans) |
| 54 | PARVA | parvin, alpha |
| 55 | PARVB | parvin, beta |
| 56 | PDGFA | platelet-derived growth factor alpha polypeptide |
| 57 | PIK3CB | phosphoinositide-3-kinase, catalytic, beta polypeptide |
| 58 | PIK3R3 | phosphoinositide-3-kinase, regulatory subunit 3 (p55, gamma) |
| 59 | PIK3R5 | phosphoinositide-3-kinase, regulatory subunit 5, p101 |
| 60 | PLA2G4A | phospholipase A2, group IVA (cytosolic, calcium-dependent) |
| 61 | PPP1R12A | protein phosphatase 1, regulatory (inhibitor) subunit 12A |
| 62 | PPP2CB | protein phosphatase 2 (formerly 2A), catalytic subunit, beta isoform |
| 63 | PPP3CB | protein phosphatase 3 (formerly 2B), catalytic subunit, beta isoform |
| 64 | PRKCA | protein kinase C, alpha |
| 65 | PTK2 | PTK2 protein tyrosine kinase 2 |
| 66 | PTPRR | protein tyrosine phosphatase, receptor type, R |
| 67 | RELN | reelin |
| 68 | RPS6KA2 | ribosomal protein S6 kinase, 90kDa, polypeptide 2 |
| 69 | SOS2 | son of sevenless homolog 2 (Drosophila) |
| 70 | SSX2IP | synovial sarcoma, X breakpoint 2 interacting protein |
| 71 | TCF7 | transcription factor 7 (T-cell specific, HMG-box) |
| 72 | TCF7L2 | transcription factor 7-like 2 (T-cell specific, HMG-box) |
| 73 | VAV3 | vav 3 oncogene |
| 74 | XIAP | X-linked inhibitor of apoptosis |
| 75 | YES1 | v-yes-1 Yamaguchi sarcoma viral oncogene homolog 1 |
Discussion
DNA Methylation Profiles
Although global DNA methylation surveys have been performed on liver and muscle tissues [23], this study is the first to systematically compare the genome-wide muscle methylation profiles of fast- and slow-growing broilers using two-tail samples of two breeds with different growth performance. The objective was to identify methylated genes affecting chicken growth. In the present study, the MeDIP-seq method was applied and 4 lines were employed in all, each line using pooled DNA samples from 3 birds. Such a pooling strategy can reduce the cost. To confirm results from MeDIP-seq, methylation tests of three regions were done with bisulfite sequencing in each pooled samples. And the methylation levels between the two methods were generally in accord with each other. Reads distribution analysis of our study found that uniquely mapped reads were enriched in the repeats and the gene body regions. It was consistent with previous findings [23].
The scan of methylation enriched regions (called peak) in MeDIP-seq was important to survey the global methylation pattern. In this study, peak distribution analysis demonstrated that promoter and CGIs were hypomethylated, whereas the methylation levels in gene body regions and repeats were relatively high. These results were in accordance with findings in other species [22], [29]. It has been well documented that most of the promoter regions were lowly methylated and promoter DNA methylation had repressive effects on gene expression [30]. DNA methylation in the gene body regions might alter chromatin structure and transcription elongation efficiency [31]. However, in contrast to previous research in animals [22], [29], [32], we did not observed a higher methylation level in exons than in introns in chickens. Further analysis of the methylation levels in the gene body regions showed that there was no significant difference (P>0.05) among the methylation densities of the first exon (1.06±0.14), mid exon (1.43±0.14), last exon (1.23±0.14), and exons (1.34±0.14). Also no significant difference (P>0.05) was found among the methylation levels of the first intron (2.11±0.14), mid intron (2.32±0.14), last intron (2.55±0.14) and the intron region (2.39±0.14). On the other hand, it has been demonstrated that most of the CGIs were unmethylated and CGIs could influence local chromatin structure [33], [34]. Like the findings in the present study, the majority of methylated CGIs were observed in intragenic and intergenic regions [35], [36]. Intragenic or intergenic CGIs were proved to have the characteristics of functional promoters and the methylation of intragenic CGIs played a crucial role in regulating alternative promoters [34], [36], [37]. In chicken genome, the LINE/CR1 was the predominant interspersed repeat element and it accounted for over 80% of all interspersed repeats [38]. Our study here found that LINE/CR1 was the predominant repeats of DNA methylation, which was consistent with findings in previous study of chicken [23].
Potential Pathways Involved in Chicken Growth at 7 Weeks of Age
Growth is under complex genetic control [39]. In the current study, in order to uncover its regulation mechanisms, the regulatory network underlying growth was examined. For those differentially methylated genes common for the contrasts compared within breeds or between breeds, enriched growth and metabolic related pathways were explored. As expected, several important pathways were found, including MAPK signaling pathway, Wnt signaling pathway, and ErbB signaling pathway. The MAPK signaling pathway is a well-known signal transduction pathway that can transduce a variety of external signals and subsequently lead to a wide range of cellular responses including growth, differentiation, inflammation and apoptosis. Currently, three major MAPK pathways, the extracellular-signal regulated kinases (ERK1/ERK2), the c-jun N-terminal kinases (JNK), and p38 kinase, have been identified [40]. Previous research showed that the MAPK (RAF/MEK/ERK) signaling pathway played a key role in skeletal muscle and its activation was indispensable for muscle cell proliferation [41]. And the p38 MAPK signaling pathway was proved to be a major regulator of skeletal muscle development [42]. On the other hand, the MAPK pathway is a common target downstream of all ErbB receptors, which are well-known mediators of cell proliferation, differentiation, apoptosis, and cell motility [43]. Thus, the ErbB signaling pathway was also selected as a possible pathway affecting growth in the present study. The Wnt signaling pathway was crucial for embryogenesis in vertebrates. In chicken, the Wnt signaling pathway was found to be strongly associated with some carcass traits [44]. In addition, our analyses also found some pathways related to cell junctions (tight junction, focal adhesion, adherens junction) enriched. Focal adhesion was the signaling center of numerous intracellular pathways that regulated cell growth, survival, and gene expression [45]. Moreover, recent studies suggested that the tight junction was involved in the regulation of cell growth and differentiation, while the adherens junction could limit cell growth [46]–[48]. Therefore, those three pathways were regarded as pathways potentially related to chicken growth at 7 weeks of age in this study.
Function of Potential Methylated Genes Affecting Chicken Growth at 7 Weeks of Age
WRR and XH were two chicken breeds with divergent growth rate. In this study, the body weight of WRR was more than three times of the XH at seven weeks of age. Further, for the two-tail samples within each breed, the body weight of fast-growing samples was about 1.5 times more than slow-growing samples. Therefore, the identified differentially methylated genes within or between the two breeds in breast muscle tissues were potentially involved in chicken growth at 7 weeks of age. Eventually, we found that a total of 75 differentially methylated genes shared by all the four contrasts (WRRh Vs. WRRl, XHh Vs. XHl, WRRh Vs. XHh, and WRRl Vs. XHl) might contribute to the regulation of chicken growth at 7 weeks of age. Among them, IGF1R and several genes belonging to the FGF family and receptors (FGF12, FGF14, FGF18, FGFR2, and FGFR3) were contained. IGF1R has been well demonstrated to play an important role in the skeletal muscle development [49], [50]. In chicken, several polymorphisms of the IGF1R gene were identified to be associated with early growth traits and carcass traits [4]. FGFs were originally isolated as growth factors for fibroblasts, and now they were recognized as growth factors with diverse biological activities [51]. For instance, previous studies in rodents and chicken demonstrated that FGF18 was a pleiotropic growth factor involved in the development of various organs [52], [53]. Studies using FGF knockout mice also indicated that FGF18 played a crucial role in development [51]. FGFRs were also demonstrated to have crucial effects on cell proliferation [51]. The results from this study indicated that these genes might affect chicken growth at 7 weeks of age via the change of DNA methylation.
In addition, many other differentially methylated genes related to muscle development were found in both inner contrasts (WRRh Vs. WRRl and XHh Vs. XHl), including the key modulator of skeletal muscle differentiation, IGF1 and well-known genes related to the biosynthesis of myosin (MYL9 and MYLK) [54]. The methylation of these genes might partially contribute to the chicken growth difference within breeds at 7 weeks of age. On the other hand, some well-known genes related to the biosynthesis of myosin (MYH11, MYH15, MYH7B, and MYLK2) and two genes essential for normal growth and development (TGFBR1 and TGFBR2) were observed in both across-breed contrasts (WRRh Vs. XHh and WRRl Vs. XHl) [55], [56]. We believed that the methylation of these genes might partially contribute to the chicken growth difference between WRR and XH at 7 weeks of age. However, the epigenetic effects of these genes on chicken growth still require further study in the future.
In summary, this study provided a comprehensive analysis of DNA methylation profiles of chicken breast muscle and revealed 75 differentially methylated genes between fast- and slow-growing birds at 7 weeks of age. Several genes (IGF1R, FGF12, FGF14, FGF18, FGFR2, and FGFR3) may play key roles in affecting chicken growth at 7 weeks of age. Our observations provide new clues for deciphering the epigenetic mechanisms of chicken growth and will contribute to the improvement of poultry production.
Supporting Information
Chromosome distribution of reads in WRRh and WRRl. The distribution of reads in the chromosome 1–28, Z, W, and chromosome MT of the chicken genome was shown with red color for each sample. MeDIP-seq reads were plotted in 10 kb windows along chromosome. WRRh and WRRl indicated the group of Recessive White Rock with high body weight and Recessive White Rock with low body weight, respectively.
(JPG)
Chromosome distribution of reads in XHh and XHl. The distribution of reads in the chromosome 1–28, Z, W, and chromosome MT of the chicken genome was shown with red color for each sample. MeDIP-seq reads were plotted in 10 kb windows along chromosome. XHh and XHl indicated the group of Xinhua Chickens with high body weight and Xinhua Chickens with low body weight, respectively.
(JPG)
Bisulfite sequencing validation of MeDIP-seq data in one region with relatively low methylation. WRRh, WRRl, XHh, and XHl indicated the group of Recessive White Rock with high body weight, Recessive White Rock with low body weight, Xinhua Chickens with high body weight, and Xinhua Chickens with low body weight, respectively.
(JPG)
The GO categories of methylated genes.
(XLS)
Differentially methylated genes overlapped among the four comparisons including WRRh Vs.WRRl, WRRh Vs.XHh, WRRl Vs.XHl, and XHh Vs.XHl based on the up/down and gene body regions classifications.
(XLS)
Differentially methylated genes related to chicken growth in both contrasts of WRRh Vs. WRRl and XHh Vs. XHl.
(XLS)
Differentially methylated genes related to chicken growth in both contrasts of WRRh Vs. XHh and WRRl Vs. XHl.
(XLS)
The GO categories of methylated genes when genes were subdivided according to their methylated regions.
(RAR)
Detail information of differentially methylated genes in the four comparisons including WRRh Vs.WRRl, WRRh Vs.XHh, WRRl Vs.XHl, and XHh Vs.XHl.
(RAR)
Funding Statement
This research was supported by grants from the National Natural Scientific Foundation of China (31172200; 31000544), the National Broiler Industry Technology System (CARS-42-G05) and the National High Technology Research and Development Program (863) of China (2011AA100301; 2010AA10A102). The funders had no role in study design, data collection and analysis, decision to publish, or preparation of the manuscript.
References
- 1. Scanes CG, Harvey S, Marsh JA, King DB (1984) Hormones and growth in poultry. Poult Sci 63: 2062–2074. [DOI] [PubMed] [Google Scholar]
- 2. Gu X, Feng C, Ma L, Song C, Wang Y, et al. (2011) Genome-wide association study of body weight in chicken F2 resource population. PLoS One 6: e21872. [DOI] [PMC free article] [PubMed] [Google Scholar]
- 3. Xie L, Luo C, Zhang C, Zhang R, Tang J, et al. (2012) Genome-wide association study identified a narrow chromosome 1 region associated with chicken growth traits. PLoS One 7: e30910. [DOI] [PMC free article] [PubMed] [Google Scholar]
- 4. Lei M, Peng X, Zhou M, Luo C, Nie Q, et al. (2008) Polymorphisms of the IGF1R gene and their genetic effects on chicken early growth and carcass traits. BMC Genet 9: 70. [DOI] [PMC free article] [PubMed] [Google Scholar]
- 5. Rubin CJ, Zody MC, Eriksson J, Meadows JR, Sherwood E, et al. (2010) Whole-genome resequencing reveals loci under selection during chicken domestication. Nature 464: 587–591. [DOI] [PubMed] [Google Scholar]
- 6. Zhang H, Liu SH, Zhang Q, Zhang YD, Wang SZ, et al. (2011) Fine-mapping of quantitative trait loci for body weight and bone traits and positional cloning of the RB1 gene in chicken. J Anim Breed Genet 128: 366–375. [DOI] [PubMed] [Google Scholar]
- 7. Abasht B, Dekkers JC, Lamont SJ (2006) Review of quantitative trait loci identified in the chicken. Poult Sci 85: 2079–2096. [DOI] [PubMed] [Google Scholar]
- 8. Zhou H, Deeb N, Evock-Clover CM, Ashwell CM, Lamont SJ (2006) Genome-wide linkage analysis to identify chromosomal regions affecting phenotypic traits in the chicken. I. Growth and average daily gain. Poult Sci 85: 1700–1711. [DOI] [PubMed] [Google Scholar]
- 9. Nadaf J, Pitel F, Gilbert H, Duclos MJ, Vignoles F, et al. (2009) QTL for several metabolic traits map to loci controlling growth and body composition in an F2 intercross between high- and low-growth chicken lines. Physiol Genomics 38: 241–249. [DOI] [PubMed] [Google Scholar]
- 10. Uemoto Y, Sato S, Odawara S, Nokata H, Oyamada Y, et al. (2009) Genetic mapping of quantitative trait loci affecting growth and carcass traits in F2 intercross chickens. Poult Sci 88: 477–482. [DOI] [PubMed] [Google Scholar]
- 11. Ankra-Badu GA, Le Bihan-Duval E, Mignon-Grasteau S, Pitel F, Beaumont C, et al. (2010) Mapping QTL for growth and shank traits in chickens divergently selected for high or low body weight. Anim Genet 41: 400–405. [DOI] [PubMed] [Google Scholar]
- 12. Petronis A (2010) Epigenetics as a unifying principle in the aetiology of complex traits and diseases. Nature 465: 721–727. [DOI] [PubMed] [Google Scholar]
- 13. Sasaki H, Allen ND, Surani MA (1993) DNA methylation and genomic imprinting in mammals. EXS 64: 469–486. [DOI] [PubMed] [Google Scholar]
- 14. Courtier B, Heard E, Avner P (1995) Xce haplotypes show modified methylation in a region of the active X chromosome lying 3′ to Xist. Proc Natl Acad Sci U S A 92: 3531–3535. [DOI] [PMC free article] [PubMed] [Google Scholar]
- 15. Siegfried Z, Eden S, Mendelsohn M, Feng X, Tsuberi BZ, et al. (1999) DNA methylation represses transcription in vivo. Nat Genet 22: 203–206. [DOI] [PubMed] [Google Scholar]
- 16. Bird A (2002) DNA methylation patterns and epigenetic memory. Genes Dev 16: 6–21. [DOI] [PubMed] [Google Scholar]
- 17. Robertson KD (2005) DNA methylation and human disease. Nat Rev Genet 6: 597–610. [DOI] [PubMed] [Google Scholar]
- 18. Conerly M, Grady WM (2010) Insights into the role of DNA methylation in disease through the use of mouse models. Dis Model Mech 3: 290–297. [DOI] [PMC free article] [PubMed] [Google Scholar]
- 19. Kulis M, Esteller M (2010) DNA methylation and cancer. Adv Genet 70: 27–56. [DOI] [PubMed] [Google Scholar]
- 20. Zhang X, Yazaki J, Sundaresan A, Cokus S, Chan SW, et al. (2006) Genome-wide high-resolution mapping and functional analysis of DNA methylation in Arabidopsis. Cell 126: 1189–1201. [DOI] [PubMed] [Google Scholar]
- 21. Ruike Y, Imanaka Y, Sato F, Shimizu K, Tsujimoto G (2010) Genome-wide analysis of aberrant methylation in human breast cancer cells using methyl-DNA immunoprecipitation combined with high-throughput sequencing. BMC Genomics 11: 137. [DOI] [PMC free article] [PubMed] [Google Scholar]
- 22. Sati S, Tanwar VS, Kumar KA, Patowary A, Jain V, et al. (2012) High resolution methylome map of rat indicates role of intragenic DNA methylation in identification of coding region. PLoS One 7: e31621. [DOI] [PMC free article] [PubMed] [Google Scholar]
- 23. Li Q, Li N, Hu X, Li J, Du Z, et al. (2011) Genome-wide mapping of DNA methylation in chicken. PLoS One 6: e19428. [DOI] [PMC free article] [PubMed] [Google Scholar]
- 24. Li R, Li Y, Kristiansen K, Wang J (2008) SOAP: short oligonucleotide alignment program. Bioinformatics 24: 713–714. [DOI] [PubMed] [Google Scholar]
- 25. Zhang Y, Liu T, Meyer CA, Eeckhoute J, Johnson DS, et al. (2008) Model-based analysis of ChIP-Seq (MACS). Genome Biol 9: R137. [DOI] [PMC free article] [PubMed] [Google Scholar]
- 26. Huang da W, Sherman BT, Lempicki RA (2009) Systematic and integrative analysis of large gene lists using DAVID bioinformatics resources. Nat Protoc 4: 44–57. [DOI] [PubMed] [Google Scholar]
- 27. Saxonov S, Berg P, Brutlag DL (2006) A genome-wide analysis of CpG dinucleotides in the human genome distinguishes two distinct classes of promoters. Proc Natl Acad Sci U S A 103: 1412–1417. [DOI] [PMC free article] [PubMed] [Google Scholar]
- 28. Illingworth RS, Bird AP (2009) CpG islands–‘a rough guide’. FEBS Lett 583: 1713–1720. [DOI] [PubMed] [Google Scholar]
- 29. Laurent L, Wong E, Li G, Huynh T, Tsirigos A, et al. (2010) Dynamic changes in the human methylome during differentiation. Genome Res 20: 320–331. [DOI] [PMC free article] [PubMed] [Google Scholar]
- 30. Klose RJ, Bird AP (2006) Genomic DNA methylation: the mark and its mediators. Trends Biochem Sci 31: 89–97. [DOI] [PubMed] [Google Scholar]
- 31. Lorincz MC, Dickerson DR, Schmitt M, Groudine M (2004) Intragenic DNA methylation alters chromatin structure and elongation efficiency in mammalian cells. Nat Struct Mol Biol 11: 1068–1075. [DOI] [PubMed] [Google Scholar]
- 32. Feng S, Cokus SJ, Zhang X, Chen PY, Bostick M, et al. (2010) Conservation and divergence of methylation patterning in plants and animals. Proc Natl Acad Sci U S A 107: 8689–8694. [DOI] [PMC free article] [PubMed] [Google Scholar]
- 33. Thomson JP, Skene PJ, Selfridge J, Clouaire T, Guy J, et al. (2010) CpG islands influence chromatin structure via the CpG-binding protein Cfp1. Nature 464: 1082–1086. [DOI] [PMC free article] [PubMed] [Google Scholar]
- 34. Deaton AM, Bird A (2011) CpG islands and the regulation of transcription. Genes 25: 1010–1022. [DOI] [PMC free article] [PubMed] [Google Scholar]
- 35. Illingworth R, Kerr A, Desousa D, Jørgensen H, Ellis P, et al. (2008) A novel CpG island set identifies tissue-specific methylation at developmental gene loci. PLoS Biol 6: e22. [DOI] [PMC free article] [PubMed] [Google Scholar]
- 36. Maunakea AK, Nagarajan RP, Bilenky M, Ballinger TJ, D’Souza C, et al. (2010) Conserved role of intragenic DNA methylation in regulating alternative promoters. Nature 466: 253–257. [DOI] [PMC free article] [PubMed] [Google Scholar]
- 37.Illingworth RS, Gruenewald-Schneider U, Webb S, Kerr AR, James KD, et al.. (2010) Orphan CpG islands identify numerous conserved promoters in the mammalian genome. PLoS Genet 6. pii: e1001134. [DOI] [PMC free article] [PubMed]
- 38. International Chicken Genome Sequencing Consortium (2004) Sequence and comparative analysis of the chicken genome provide unique perspectives on vertebrate evolution. Nature 432: 695–716. [DOI] [PubMed] [Google Scholar]
- 39. Deeb N, Lamont SJ (2002) Genetic architecture of growth and body composition in unique chicken populations. J Hered 93: 107–118. [DOI] [PubMed] [Google Scholar]
- 40. Arbabi S, Maier RV (2002) Mitogen-activated protein kinases. Crit Care Med 30: S74–S79. [PubMed] [Google Scholar]
- 41. Coolican SA, Samuel DS, Ewton DZ, McWade FJ, Florini JR (1997) The mitogenic and myogenic actions of insulin-like growth factors utilize distinct signaling pathways. Biol Chem 272: 6653–6662. [DOI] [PubMed] [Google Scholar]
- 42. Keren A, Tamir Y, Bengal E (2006) The p38 MAPK signaling pathway: a major regulator of skeletal muscle development. Mol Cell Endocrinol 252: 224–230. [DOI] [PubMed] [Google Scholar]
- 43. Holbro T, Hynes NE (2004) ErbB receptors: directing key signaling networks throughout life. Annu Rev Pharmacol Toxicol 44: 195–217. [DOI] [PubMed] [Google Scholar]
- 44. Lu Y, Chen SR, Liu WB, Hou ZC, Xu GY, et al. (2012) Polymorphisms in Wnt signaling pathway genes are significantly associated with chicken carcass traits. Poult Sci 91: 1299–1307. [DOI] [PubMed] [Google Scholar]
- 45. Sastry SK, Burridge K (2000) Focal adhesions: a nexus for intracellular signaling and cytoskeletal dynamics. Exp Cell Res 261: 25–36. [DOI] [PubMed] [Google Scholar]
- 46. Balda MS, Matter K (1998) Tight junctions. J Cell Sci 111: 541–547. [DOI] [PubMed] [Google Scholar]
- 47. Pötter E, Bergwitz C, Brabant G (1999) The cadherin-catenin system: implications for growth and differentiation of endocrine tissues. Endocr Rev 20: 207–239. [DOI] [PubMed] [Google Scholar]
- 48. Bazzoni G, Dejana E (2004) Endothelial cell-to-cell junctions: molecular organization and role in vascular homeostasis. Physiol Rev 84: 869–901. [DOI] [PubMed] [Google Scholar]
- 49. Liu JP, Baker J, Perkins AS, Robertson EJ, Efstratiadis A (1993) Mice carrying null mutations of the genes encoding insulin-like growth factor I (Igf-1) and type 1 IGF receptor (Igf1r). Cell 75: 59–72. [PubMed] [Google Scholar]
- 50. Huang MB, Xu H, Xie SJ, Zhou H, Qu LH (2011) Insulin-like growth factor-1 receptor is regulated by microRNA-133 during skeletal myogenesis. PLoS One 6: e29173. [DOI] [PMC free article] [PubMed] [Google Scholar]
- 51. Itoh N (2007) The Fgf families in humans, mice, and zebrafish: their evolutional processes and roles in development, metabolism, and disease. Biol Pharm Bull 30: 1819–1825. [DOI] [PubMed] [Google Scholar]
- 52. Ohuchi H, Kimura S, Watamoto M, Itoh N (2000) Involvement of fibroblast growth factor (FGF)18-FGF8 signaling in specification of left-right asymmetry and brain and limb development of the chick embryo. Mech Dev 95: 55–66. [DOI] [PubMed] [Google Scholar]
- 53. Cormier S, Leroy C, Delezoide AL, Silve C (2005) Expression of fibroblast growth factors 18 and 23 during human embryonic and fetal development. Gene Expr Patterns 5: 569–573. [DOI] [PubMed] [Google Scholar]
- 54. Florini JR, Ewton DZ, Magri KA (1991) Hormones, growth factors, and myogenic differentiation. Annu Rev Physiol 53: 201–216. [DOI] [PubMed] [Google Scholar]
- 55. Loeys BL, Chen J, Neptune ER, Judge DP, Podowski M, et al. (2005) A syndrome of altered cardiovascular, craniofacial, neurocognitive and skeletal development caused by mutations in TGFBR1 or TGFBR2. Nat Genet 37: 275–281. [DOI] [PubMed] [Google Scholar]
- 56. Chen K, Hawken R, Flickinger GH, Rodriguez-Zas SL, Rund LA, et al. (2012) Association of the porcine transforming growth factor beta type I receptor (TGFBR1) gene with growth and carcass traits. Anim Biotechnol 23: 43–63. [DOI] [PubMed] [Google Scholar]
Associated Data
This section collects any data citations, data availability statements, or supplementary materials included in this article.
Supplementary Materials
Chromosome distribution of reads in WRRh and WRRl. The distribution of reads in the chromosome 1–28, Z, W, and chromosome MT of the chicken genome was shown with red color for each sample. MeDIP-seq reads were plotted in 10 kb windows along chromosome. WRRh and WRRl indicated the group of Recessive White Rock with high body weight and Recessive White Rock with low body weight, respectively.
(JPG)
Chromosome distribution of reads in XHh and XHl. The distribution of reads in the chromosome 1–28, Z, W, and chromosome MT of the chicken genome was shown with red color for each sample. MeDIP-seq reads were plotted in 10 kb windows along chromosome. XHh and XHl indicated the group of Xinhua Chickens with high body weight and Xinhua Chickens with low body weight, respectively.
(JPG)
Bisulfite sequencing validation of MeDIP-seq data in one region with relatively low methylation. WRRh, WRRl, XHh, and XHl indicated the group of Recessive White Rock with high body weight, Recessive White Rock with low body weight, Xinhua Chickens with high body weight, and Xinhua Chickens with low body weight, respectively.
(JPG)
Bisulfite sequencing validation of MeDIP-seq data in one region with relatively low methylation. WRRh, WRRl, XHh, and XHl indicated the group of Recessive White Rock with high body weight, Recessive White Rock with low body weight, Xinhua Chickens with high body weight, and Xinhua Chickens with low body weight, respectively.
(JPG)
The GO categories of methylated genes.
(XLS)
Differentially methylated genes overlapped among the four comparisons including WRRh Vs.WRRl, WRRh Vs.XHh, WRRl Vs.XHl, and XHh Vs.XHl based on the up/down and gene body regions classifications.
(XLS)
Differentially methylated genes related to chicken growth in both contrasts of WRRh Vs. WRRl and XHh Vs. XHl.
(XLS)
Differentially methylated genes related to chicken growth in both contrasts of WRRh Vs. XHh and WRRl Vs. XHl.
(XLS)
The GO categories of methylated genes when genes were subdivided according to their methylated regions.
(RAR)
Detail information of differentially methylated genes in the four comparisons including WRRh Vs.WRRl, WRRh Vs.XHh, WRRl Vs.XHl, and XHh Vs.XHl.
(RAR)