Abstract
Although it is generally assumed that brain damage predominantly affects only the function of the damaged region, here we show that focal damage to critical locations causes disruption of network organization throughout the brain. Using resting state fMRI, we assessed whole-brain network structure in patients with focal brain lesions. Only damage to those brain regions important for communication between subnetworks (e.g., “connectors”)—but not to those brain regions important for communication within sub-networks (e.g., “hubs”)—led to decreases in modularity, a measure of the integrity of network organization. Critically, this network dysfunction extended into the structurally intact hemisphere. Thus, focal brain damage can have a widespread, nonlocal impact on brain network organization when there is damage to regions important for the communication between networks. These findings fundamentally revise our understanding of the remote effects of focal brain damage and may explain numerous puzzling cases of functional deficits that are observed following brain injury.
INTRODUCTION
The brain can be thought of as a complex network composed of functionally separable sets of regions, referred to here as subnetworks or modules, which supports both local processing within and distributed processing across modules. The study of patients with focal brain lesions provides a unique approach for understanding this organization, allowing one to link cognitive functions to specific brain regions (e.g., the inability to recognize faces after damage to the fusiform gyrus implicates this area in face processing). Yet, despite some rough correspondence between the location of a lesion and the resultant cognitive deficits, an explanation for why focal lesions can also lead to nonspecific deficits continues to elude neuroscientists and clinicians. Localization of function relies on the assumption that undamaged brain regions continue to function normally, suggesting that deficits are solely attributable to the damaged tissue (Farah, 1994). Arguments against this assumption have pointed to (i) specific cognitive deficits that occur following focal white matter damage (i.e., disconnection syndromes such as alexia without agraphia; Geschwind, 1965a, 1965b), (ii) neurophysiological changes remote from a lesion (referred to as diaschisis; Price, Warburton, Moore, Frackowiak, & Friston, 2001; Feeney & Baron, 1986), and (iii) PDP models of complex cognitive functions (Farah, 1994). These observations provide suggestive evidence that cognitive functions are driven not only by local processing but also by interactions between a distributed set of brain regions (Mesulam, 1990).
Despite 150 years of neuropsychological evidence for local and distributed effects of focal brain damage, a mechanistic framework to reconcile these observations is lacking. Although recent studies have examined changes in brain activity distant from the area of damage, these have been limited to studying changes within specific brain subsystems (e.g., regions subserving cognitive control [Nomura et al., 2010], attention [Carter et al., 2010; He et al., 2007], somatomotor function [Carter et al., 2010; Mintzopoulos et al., 2009; Sharma, Baron, & Rowe, 2009; Grefkes et al., 2008; Gerloff et al., 2006], and language [Warren, Crinion, Lambon Ralph, & Wise, 2009; Price et al., 2001]), because it has proven difficult to precisely characterize the global changes in brain organization that may occur following focal damage. Recently, mathematical tools based on graph theory have emerged as a method to quantify large-scale network properties of the brain (Guye, Bettus, Bartolomei, & Cozzone, 2010; Sporns, 2010b; Bullmore & Sporns, 2009), to parcellate these networks into modules, and to identify the roles of individual brain regions within this structure (Meunier, Lambiotte, & Bullmore, 2010; He, Wang, et al., 2009; Meunier, Lambiotte, Fornito, Ersche, & Bullmore, 2009). Initial studies simulating brain damage point to a potential mechanism describing why only some focal lesions may show robust long-distance effects (Alstott, Breakspear, Hagmann, Cammoun, & Sporns, 2009; He, Wang, et al., 2009; Honey & Sporns, 2008; Sporns, Honey, & Kotter, 2007; Young, Hilgetag, & Scannell, 2000). In these analyses, simulated damage to brain regions that connect different network modules (connectors) predicted widespread effects on whole-brain communication, whereas damage to areas that connect regions within a module (hubs) predicted more local, nonextensive effects (He, Wang, et al., 2009; Honey & Sporns, 2008; see Figure 1 for a schematic depiction of these nodal roles). The extent to which damage affects large-scale brain organization can be measured with Newman's modularity, Q (Newman & Girvan, 2004), a comparison between the number of connections within a module to the number of connections between modules. Modularity quantifies the ability of the brain to differentiate into separable subnetworks and is an essential property found in many complex systems that allows the system to easily evolve, develop, and engage in flexible, dynamic behaviors (Meunier et al., 2010).
Figure 1.
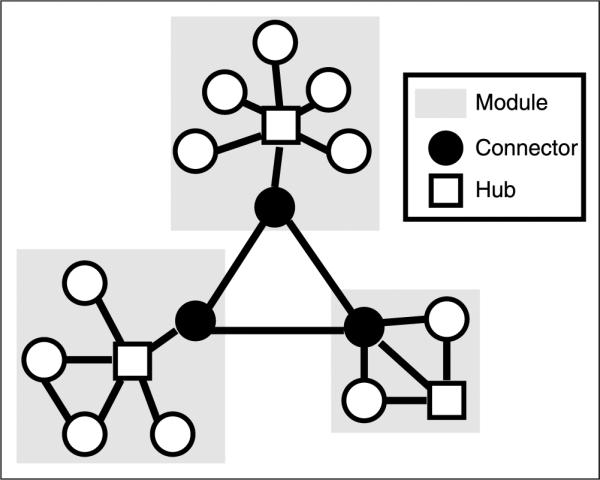
Schematic of nodal roles. Schematic illustrating the role of connectors (black circles) and hubs (white squares) in modular organization. Hubs have many within-module connections, and connectors have many between-module connections. Note that any brain region may have both connector- and hub-like properties and can have continuous values for hubness and connectorness (see Figure 5).
We empirically tested the hypothesis generated by studies of simulated lesion data by collecting resting state fMRI (rs-fMRI) data from 35 patients with focal brain lesions and a set of 24 healthy control participants. Studies of spontaneous coherent fluctuations at rest consistently identify stable (Shehzad et al., 2009) intrinsic functional networks that, in a short fMRI recording session, recapitulate a number of subnetworks normally engaged by a variety of different tasks (Smith et al., 2009). Here, we sought to investigate the differential vulnerability of brain regions with a range of nodal properties within these subnetworks by studying patients with focal damage to a variety of areas distributed throughout the brain (Figure 2). This enabled us to test how damage to regions with different nodal properties (e.g., hubness or connectorness) influenced large-scale network structure, without regard for potential differences in the specific anatomical site of damage and neuropsychological characteristics of each patient.
Figure 2.
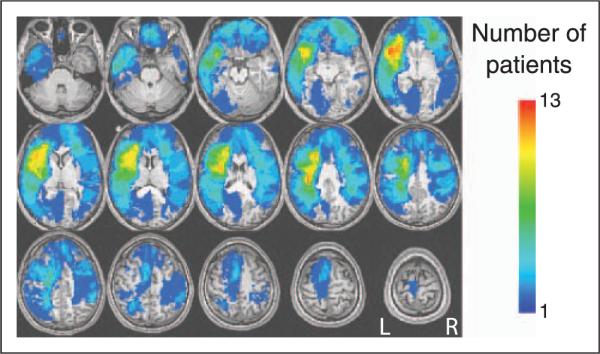
Overlap of individual patient lesions. An overlap plot of the location of brain damage in 35 patients with focal lesions. The color designates the number of patients with damage to a particular brain region. On this and subsequent figures: R = right hemisphere; L = left hemisphere.
METHODS
Participants
Thirty-five patients (age range = 17–84 years, mean age = 60 years) with focal lesions because of stroke (n = 25), traumatic brain injury (n = 6), and tumors (n = 4) and 24 healthy participants (age range = 18–37 years, mean age = 24 years) were studied. Four of the 35 lesion patients had bilateral lesions and were excluded from the single hemisphere analyses, leaving 31 unilateral patients (21 left and 10 right). All healthy participants were prescreened to exclude individuals with a history of neurologic or psychiatric conditions. Informed consent was obtained from participants in accordance with procedures approved by the Committees for Protection of Human Subjects at the University of California, Berkeley.
MRI Acquisition Procedure
T2*-weighted EPIs were collected on a whole-body 3-T Siemens MAGNETOM Trio MRI scanner using a 12-channel head coil. Structural images were acquired using an axial magnetization prepared rapid gradient echo 3-D T1-weighted sequence (repetition time [TR] = 2,300 msec, echo time [TE] = 2.98 msec, flip angle = 9°, 1 × 1 × 1 mm voxels) for patients and controls. An additional FLAIR image was collected for each patient to better localize the lesion. For patients, 10 min of EPI data were analyzed (300 time points, TR = 2000 msec, TE = 30 msec, twenty-eight 3.30-mm-thick axial slices). For controls, 10 blocks of 4 min and 20 sec of EPI data were analyzed (217 time points, TR = 1370 msec, TE = 50 msec, twenty-four 3.85-mm-thick axial slices). All participants were instructed to stay awake with their eyes open. No other task instruction was provided.
MRI Preprocessing
Image preprocessing was carried out in AFNI (Cox, 1996). The following prestatistics processing was applied: removal of nonbrain structures from the EPI volumes and spatial smoothing using a 5-mm Gaussian kernel. Following Fox et al. (2005), signal from movement, white matter, and ventricles was regressed out. The high-resolution T1-weighted image was coregistered to the mean functional data and then segmented using SPM5 (Friston, Ashburner, Kiebel, Nichols, & Penny, 2007). The template used for segmentation was derived from 152 normal participants (MNI152; Montreal Neurological Institute, Montreal, QC, Canada) and relied upon probabilistic tissue maps. Spatial transformation parameters to translate between native and standard space were obtained from the brain segmentation andusedtonormalizeeachindividual's T1-weighted brain. This extra segmentation step was necessary for accurate registration, which is often confounded by structural brain damage.
Lesion Mapping
Lesion masks were manually traced by authors E.N. and C.G. in native patient space according to visible damage on a T1-weighted anatomical scan and guided by damage and hyperintensities on a T2-weighted FLAIR image. All lesion masks were examined by M.D. for anatomical specificity.
Regions of Interest
Ninety cortical and subcortical regions from the Automated Anatomical Labeling (AAL) Atlas (Tzourio-Mazoyer et al., 2002) were reverse normalized into individual participant space to create subject-specific ROIs. ROIs in which EPIs covered less than 25% of voxels within an ROI in any participant within a group were excluded from further analysis, resulting in 90 regions in control participants and 88 regions in patients.
For single-hemisphere analyses, the standard 90 AAL atlas ROIs were divided into two equally sized halves (superior and inferior) to ensure that a sufficient number of ROIs would be present within each hemisphere for graph theory analyses. Although ROI size was not matched between whole brain and single hemisphere analyses, results were only compared between each single hemisphere or between whole-brain graphs, not across these two classes. As described above, regions with less than 25% EPI coverage within an ROI in either hemisphere in any single participant in a group were excluded, resulting in 87 regions in controls and 86 regions in lesion patients in each hemisphere.
Functional Connectivity
Voxel time series were averaged within each ROI. These averages were bandpass filtered (0.009–0.08 Hz) to remove physiological noise such as cardiac and respiratory artifacts (Fox et al., 2005). Functional connectivity was assessed in each participant by computing time series correlations between average time series across all pairs of ROIs, resulting in a correlation matrix for each control participant and lesion patient. Similarly, for single-hemisphere analyses, all of the pairs of averaged time series from ROIs within that hemisphere were used to construct a correlation matrix. Separate correlation matrices were constructed for each hemisphere in each participant.
It should be noted that pairwise correlation values derived from this type of analysis will only reflect the synchronized or alternate activations and deactivations in different regions and will not detect similar time courses that are phase-shifted (i.e., these will show up as low correlations). Because of the low frequency of the filtered signal and the nature of the resting state activity, we assumed that such phase-shifted patterns would not signal the presence of healthy interactions.
Graph Theory, Simulated Annealing, and Modularity
ROI-by-ROI correlation matrices were derived for each participant as described above and Fisher-transformed to produce normally distributed values. We thresholded each correlation matrix to create an adjacency matrix (a matrix of 1s and 0s reflecting above-threshold correlations and below-threshold correlations respectively), which then served as the basis for defining an unweighted, undirected graph. Graphs are defined as a set of nodes (ROIs from the correlation matrix) connected by a number of edges (correlation values above a threshold). Graphs were created and analyzed using the NetworkX Python package (Hagberg, Schult, & Swart, 2008).
The number of edges was equated between individual participant graphs by thresholding at a set cost, rather than correlation, value. A cost value represents the fraction of total possible edges that is present in the graph. By thresholding in this manner, we are able to directly compare the pattern of connections that exists across different graphs, removing differences in the graph structure that would only result from differences in correlation magnitudes across individuals (Achard & Bullmore, 2007; Bartolomei et al., 2006). All analyses were done over a range of possible cost values (0.05–0.25) to determine the stability of the results. These values are within the ideal cost range (approximately 0.01–0.30) where the sparsity of the graph is considered optimal, because within this range many graph theory metrics, including small worldness, are maximal (Bullmore & Bassett, 2011; Bassett et al., 2008; Achard & Bullmore, 2007). The main results in the manuscript are presented at a cost of 0.15 or 0.20, that is, points in the center of the ideal cost range (although results were largely consistent across costs).
This procedure of creating graphs from correlation matrices was done for each lesion and control participant separately, by using their individual correlation matrices (control participant blocks were averaged to create a single matrix), and for the control participants as a group, by averaging the Fisher-transformed correlation matrices across all control participants to create a control template. At the end of this step, we produced a separate graph for each lesion patient, control participant, and the control template at each cost value for the whole brain and for each individual hemisphere.
Each graph created above was partitioned into separate subnetworks or modules derived by optimizing Newman's modularity (Newman & Girvan, 2004) using simulated annealing (Guimera & Nunes Amaral, 2005). Simulated annealing is a data-driven method that makes no assumptions about the number of modules to be found in a graph. This method is computationally slow but very robust at finding the optimal modularity structure (Danon, Díaz-Guilera, Duch, & Arenas, 2005; Guimera & Nunes Amaral, 2005); for this size of graphs, the computational cost was not a limiting factor. Modularity is a measure that compares the number of within-module with between-module connections and reflects the strength of a graph's modular organization. Modularity, or Q, is defined as:
where eii is the fraction of edges that connect two nodes within a module, i; ai is the fraction of edges connecting a node in module i to any other node; and m is the total number of modules. Modularity will be 1 if all edges fall within a module, and it will be 0 if there are no more connections within a module than would be expected by chance (Newman & Girvan, 2004).
At each cost, three modularity-optimized partitions were derived for each patient, for each control subject, and for the control template (the whole-brain network and each hemisphere network independently). These optimized partitions were then evaluated using modularity and compared with one another using a normalized mutual information (MI) measure (Danon et al., 2005). MI quantifies the similarity of two partitions and is defined as
where mA is the number of communities in one partition, A, and mB is the number of communities in a second partition, B. This measure is based on defining a confusion mA × mB matrix, N, with rows corresponding to modules in partition A and columns corresponding to modules in partition B. The elements of N, Nij, then quantify the number of nodes that were in module i of partition A and module j of partition B. MI will be 1 if the two partitions are identical; low values can result either from modules containing different nodes or the presence of different numbers of modules (Danon et al., 2005).
We compared modularity and MI values between control participants and lesion patients in the whole brain using a two-tailed two-sample t test and between the two hemispheres in each participant group using a paired-sample t test. Because of the a priori hypothesis that lesioned hemispheres should have more disruption than nonlesioned hemispheres, these tests were conducted with a one-tailed test.
Hemisphere effects between patient and control groups were tested with a two-sample t test after matching the groups for the hemispheres tested (i.e., the same number of left and right hemispheres went into the patient and control participant analyses).
Nodal Roles, Damage Scores, and Correlations with Modularity
From the control template partition, we calculated metrics reflecting the roles of each node. The participation coefficient (PC) is a measure of the number of intermodule connections for each node normalized by their expected value. The PC value for each node i, PCi, is defined as
where ki is the total number of connections to node i and kis is the number of connections between node i and nodes in module s. If a node has connections uniformly distributed to all modules, then its PC value will be 1; on the other hand, if its links are concentrated within its own module, its PC value will be 0 (Guimera & Nunes Amaral, 2005).
The within-module degree (WD) is a z-scored measure of the number of intramodule connections to each node. The WD value for each node i, WDi, is defined as
where ki is the number of connections between node i and other nodes in its module si, is the average degree of all nodes in si, and σksi is the standard deviation of the degree of all nodes in si. This gives a relative (z-scored) measure of how well connected any node is to other nodes within its own module (Guimera & Nunes Amaral, 2005).
Nodes with higher PC values are considered connectors and nodes with higher WD values are considered modular hubs (sometimes called “provincial” or “connector” hubs depending on their corresponding PC value; Guimera & Nunes Amaral, 2005). It should be noted, however, that the term “hubs” in the literature has also been applied to nodes scoring high on a variety of different properties (e.g., high on a variety of measures of degree or centrality; see, e.g., Sporns, 2010a; Buckner et al., 2009; Bassett et al., 2008).
In each patient, we used the control template nodal roles to calculate separate PC and WD damage scores. PC damage scores were calculated by averaging the PC nodal values from the control template for each AAL ROI that was lesioned in that patient and then multiplying that value by the percent damage sustained by the node. Similarly, WD damage scores were the average of the WD nodal values from the control template for each AAL ROI that was lesioned in that patient, weighted by the amount of damage to each node.
To study the relationship between the healthy role of nodes that are damaged and the resultant modular strength in patients we examined the linear relationship between damage scores and modularity using a Pearson's correlation. The significance of correlations at each threshold was tested with a nonparametric permutation test (two-tailed). The significance of the differences between WD and PC correlations was tested using the z statistic described by Steiger (1980) to compare dependent correlations (two-tailed test).
For individual hemisphere analyses, the mean and standard deviation of individual control participants was used to normalize the modularity values from each patient based on the hemisphere damaged. Hemispheric values of modularity (m) were normalized in patients to account for potential hemispheric differences using the formula:
Here m is the original patient modularity, is the average modularity of control participants in the hemisphere under examination, σcontrols is the standard deviation in modularity of control participants in the hemisphere, and mz is the resultant normalized modularity score. These values were then correlated with the PC and WD damage scores as described previously.
RESULTS
We estimated functional connectivity in rs-fMRI using time series correlations (Fox et al., 2005) between different brain regions defined from the AAL digital brain atlas in both patients with focal lesions and healthy controls. Functional connectivity graphs are defined as a set of nodes (regions within the AAL atlas) connected by edges (pairs of nodes for which connectivity values passed a threshold; see Methods). Graphs from individual patients were compared with a control template graph formed from the averaged functional connectivity data of healthy controls.
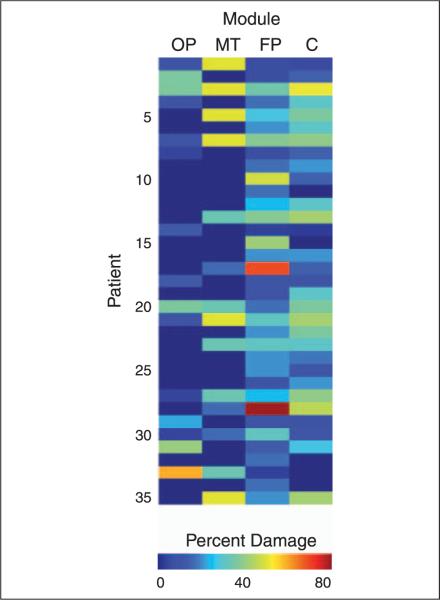
We found four modules in the healthy control network: a fronto-parietal, centro-temporal, occipital-parietal, and medial-temporal module (Figure 3). This modular organization, which is similar to that observed in other rs-fMRI studies in healthy individuals (He, Wang, et al., 2009; Meunier et al., 2009), was consistent across individual participants. The MI (a measure of the similarity between two graph partitions that ranges from 0 for unrelated partitions to 1 for the same partition) was 0.59 on average between the control template graph and the individual healthy participant graphs and was stronger in the right hemisphere than the left [t(23) = −2.15, p = .04]. Across patients, damage was distributed across all modules, and many patients had damage to more than one module (Figure 4). No clear relationship between modularity and the pattern of damage to different modules was observed. On average, patients had lower modularity values than controls [t(57) = 4.14, p = 10−4]. As expected, the lesioned hemisphere was significantly less modular [t(30) = 1.93, p = .03] and less similar to the control template [t(30) = 2.48, p = .01] than the nonlesioned hemisphere. However, the nonlesioned hemisphere was also significantly less modular than the corresponding hemisphere in controls [t(53) = 3.75, p = 10−4], suggesting that dysfunction extended into the intact hemisphere in patients.
Figure 3.
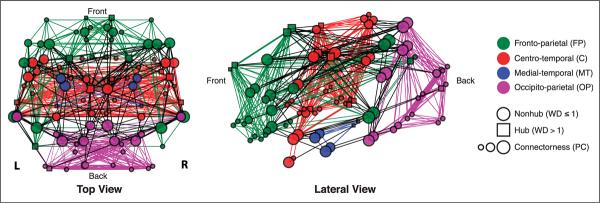
Modular organization of the healthy control template. Top (left) and lateral (right) views of the control template graph created from averaged rs-fMRI data from 24 healthy participants. Brain regions (nodes) are represented by squares (hubs, WD > 1) or circles (nonhubs, WD ≤ 1), and node size represents connectorness (PC). The modularity-optimized partition of the graph resulted in four modules: fronto-parietal (FP), centro-temporal (C), medial-temporal (MT), and occipito-parietal (OP). Within-module edges match module color and between-module edges are black. This partitioning scheme was consistent across thresholds and present in both hemispheres when analyzed separately (see Figure 8). R = right hemisphere; L = left hemisphere.
Figure 4.
Damage to each module. Patients had focal brain damage to a heterogeneous set of cortical regions that overlapped with multiple modules. Color indicates percentage of damage to the module, and patients are sorted based on their modularity scores, ranging from low (top) to high (bottom) levels of modularity. FP = fronto-parietal; C = centro-temporal; MT = medial-temporal; OP = occipito-parietal.
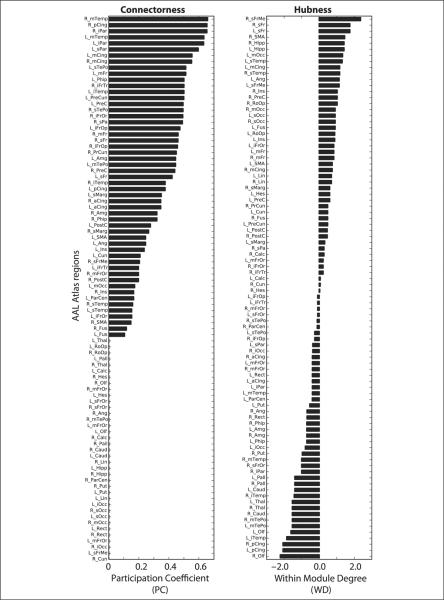
For the set of damaged nodes in each patient, we assessed the normal role of those nodes within a healthy brain (defined by the control template) based on two characteristics: WD and PC (Figure 5). WD is a measure of the number of intramodule connections of a node, and PC is a measure of the number of intermodule connections of a node (Guimera & Nunes Amaral, 2005). Nodes with high PC values are connectors, and nodes with high WD values are hubs (see Figure1 for illustration). We created a PC and WD damage score by averaging these healthy PC or WD values from the control template for all nodes that were damaged in each patient, weighted by the amount of damage to each node. We then examined the relationship between patients' weighted damage scores and modularity after damage. Patients' PC damage score correlated negatively with modularity (Figure 6), suggesting that modular organization decreased with increasing amounts of damage to connectors (r = −41, p = .02, cost = 0.15). No such relationship, however, was seen between WD damage scores and modularity (r = .14). Thus, increasing damage to connectors predicted decreases in modularity significantly more than damage to hubs (z = 2.37, p = .02).
Figure 5.
Nodal roles. Nodes in the control template were characterized based on their PC (left), a measure of the number of intermodule connections, and WD (right), a measure of the number of intramodule connections. Individual nodes from different modules had a wide range of values, providing a continuum over which patient damage could be assessed. In the figure, AAL region names correspond to abbreviations reported in the AAL atlas (Tzourio-Mazoyer et al., 2002); R = right hemisphere; L = left hemisphere.
Figure 6.
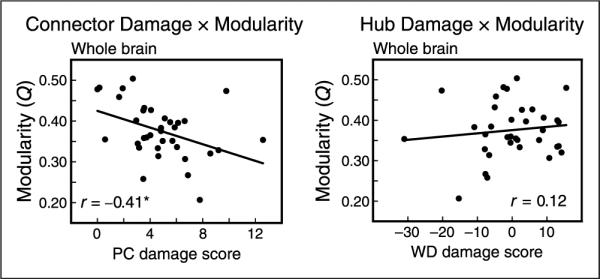
PC and WD damage score correlations with modularity across the whole brain. (Left) PC damage score was negatively correlated with the modularity of individual participants, across the whole brain (cost = 0.15, r = −.41, p = .02). (Right) WD damage score was not related to modularity, and the correlation between PC and modularity was more negative than the correlation between WD and modularity. These relationships were consistent across a range of cost thresholds.
Mathematically, modularity is inversely proportional to the number of connections between modules (see Methods), suggesting that having fewer nodes with high PC values should lead to increased modularity. We observed this inverse relationship in healthy control participants, where those participants who had fewer connector nodes had higher modularity values (r =.49, p <.01, cost = 0.15). However, in patients with focal lesions, we observed that a loss of connectors was related to decreases, rather than increases, in modularity. This indicates that in patients the loss of connectors does not simply cause the loss of a select number of edges, but rather leads to a reorganization of the graph that is detrimental to its modular structure.
To determine whether this network reorganization extended to regions remote from the lesion, we examined the relationship between damage and modularity in graphs constructed independently for the lesioned and nonlesioned hemisphere. Given the potential hemispheric differences in modularity in control participants, we first normalized the patients' modularity values according to the side on which the lesion occurred to correct for hemispheric asymmetries (see Methods). Similar to the whole-brain results, we observed a negative relationship between PC damage score and normalized modularity in the lesioned hemisphere (r = −.41, p = .02). Critically, this relationship was also present in the nonlesioned hemisphere (r = −.44, p = .01), demonstrating that damage to connectors disrupts network structure even in the intact hemisphere. In both hemispheres, the PC damage score was more negatively correlated with modularity than the WD damage score (Figure 7; lesioned: z = 2.16, p = .03; nonlesioned: z = 1.95, p = .05) demonstrating a specific relationship between connector damage and modular organization. Examples of individual patients with low and high connector damage are shown in Figure 8, clearly emphasizing the global and hemispheric disruptions that result from damage to connectors.
Figure 7.
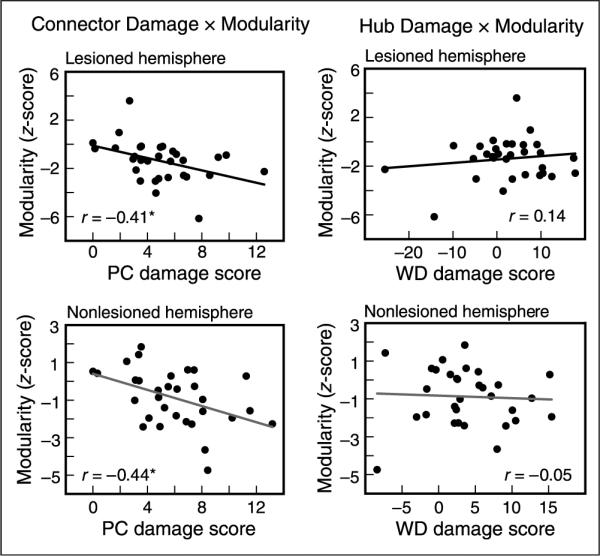
PC and WD damage score correlations with modularity for each hemisphere. (Left) PC damage score was negatively correlated with the modularity of individual participants in the (top) lesioned (cost = 0.15, r = −.41, p = .02) and (bottom) nonlesioned hemisphere (cost = 0.20, r = −.44, p = .01). (Right) WD damage score was not related to modularity in either hemisphere. The correlation between PC and modularity was more negative than the correlation between WD and modularity in both hemispheres and these relationships were consistent across a range of cost thresholds.
Figure 8.
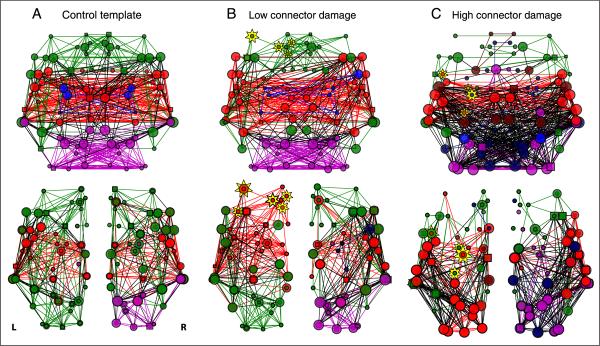
Examples of individual patients with low and high PC damage scores. (A) Control template graphs from the average of the healthy control participants across (top) the whole brain and (bottom) each hemisphere separately. (B) Patients with low connector damage tended to have preserved modular structure across the whole brain (top; Q = 0.48) and both hemispheres (bottom; lesioned: Q = 0.36, nonlesioned: Q = 0.41). (C) Patients with high connector damage, however, had highly disrupted modular organization across the whole brain (top; Q = 0.21) and both hemispheres (bottom; lesioned: Q = 0.20; nonlesioned Q = 0.19). Plotting conventions follow Figure 3. Module colors are assigned to match control template modules with the highest number of overlapping nodes. Yellow stars represent lesioned nodes, with size of the star proportional to the percent damage to that node (these two patients were approximately matched for the sizes of their lesions).
To ensure that the relationship between brain damage and modularity was specific to the nodal role of the damaged region and the network structure of the lesioned brain, we performed several additional analyses to rule out alternate explanations. First, we determined that the correlations between damage scores and modularity were consistent across graph thresholds (costs), demonstrating that the results were not an artifact of the particular threshold applied for analyses The correlation between modularity and PC damage score for whole-brain analyses was r = −.36, −.28, −.41, −.36, −.30, respectively, for costs = 0.05, 0.10, 0.15, 0.20, 0.25 (for the lesioned hemisphere, r = −.14, −.20, −.41, −.36, −.27, and for the nonlesioned hemisphere, r = −.09, −.24, −.33, −.44, −.38). Second, it is possible that changes in modularity are related to the extent of tissue damage, rather than the nodal role of the damaged region. However, we found that correlations between modularity and lesion size were nonsignificant (r = −.095, p = .58 at cost = 0.15; not significant at any threshold), suggesting that nodal role determines network disruption. Third, lesions to connectors may simply decrease the average magnitude of connectivity of the brain, rather than modifying the modular structure of those connections. However, the correlation between PC damage score and the average functional connectivity magnitude in each graph was not significant (r = .091, p =.59 at cost = 0.15, not significant at any threshold), suggesting that it was the pattern of connections across the brain, rather than their overall strength, that was modified. Finally, we tested whether the individual thresholds applied to achieve the same edge density across patients (see Methods) could explain the relationship with connector damage. Again, these correlations were not significant across any cost (r = .071, p = .68 at cost = 0.15). Taken together, these analyses strengthen our finding that damage to critical sites represented by connectors results in a disruption in modular organization of the brain.
DISCUSSION
Here, we analyzed rs-fMRI data from a population of patients with focal brain damage to examine the effects of lesions on the structure of large-scale functional brain networks. This study provides direct evidence that global changes in brain organization occur specifically after focal damage to brain regions that are normally necessary for communication between subnetworks. Importantly, this disruption in hemispheric network organization extends to an intact hemisphere without any structural damage. This demonstrates that connectors (e.g., brain regions that connect different modules), but not hubs (e.g., brain regions that connect regions within a module), are crucial for the maintenance of large-scale modular structure.
Our findings confirm predictions derived from studies simulating the effects of local damage on brain networks (He, Wang, et al., 2009; Honey & Sporns, 2008) that specifically implicated connector damage with disruption in measures of network organization. Furthermore, these results provide the first empirical quantification of the large-scale, long-distance, functional effects that can be caused by focal lesions to critical network locations. Although previous studies of patient populations (Carter et al., 2010; Nomura et al., 2010; Sharma et al., 2009; Grefkes et al., 2008; He et al., 2007; Gerloff et al., 2006; Price et al., 2001) have suggested that focal lesions may impact regions remote from the site of structural damage, the focus in these studies was on changes in connectivity magnitude among a small number of brain regions. Studies examining changes in whole-brain functional connectivity networks that occur following traumatic brain injury (Cao & Slobounov, 2010; Castellanos et al., 2010; Nakamura, Hillary, & Biswal, 2009) and tumors (Bosma et al., 2009; Guggisberg et al., 2008; Bartolomei et al., 2006) have shown evidence for disruption in these functional networks. In addition, a recent study (Crofts et al., 2011) using diffusion MRI tractography after focal lesions to the BG and internal capsule found widespread changes in the organization of white matter connections extending into the intact hemisphere, suggesting that structural changes may, in part, underlie the reorganization of large-scale functional networks observed in our study. We were able to expand on this finding both by quantifying the effects of lesions on network structure across the whole brain and by linking the extent of these remote effects to the network role of the damaged region.
A variety of studies have attempted to link diseases with changes in the nodal roles in specific regions (see reviews by Pievani, de Haan, Wu, Seeley, & Frisoni, 2011; Guye et al., 2010; Sporns, 2010b). For example, global changes in network structure are accompanied by local changes in nodal roles of specific regions in multiple sclerosis (where regional efficiency and correlation strengths of several regions including the insula were correlated with white matter deposition; He, Dagher, et al., 2009), in traumatic brain injury (where the degree of nodes was decreased in frontal and increased in parietal and occipital regions; Cao & Slobounov, 2010), in schizophrenia (where hubs defined by a variety of properties shifted away from frontal and cingulate regions; Bassett et al., 2008), and in Alzheimer's disease (where decreases in clustering of the hippocampus was seen in patients; Supekar, Menon, Rubin, Musen, & Greicius, 2008).
In a similar approach to ours, studies investigating network structure in healthy controls and those with Alzheimer's disease have found that global changes in the large-scale network structure of the brain (measured by clustering, path length, and phase-lag index) were predicted by the selective damage to nodes with many connections (high degree nodes) in healthy controls on the basis of modeling results (Stam et al., 2009). In confirmation of the modeling results, another study found that high-degree regions in control participants correspond to the locations of amyloid plaque deposition (Buckner et al., 2009). Thus, although there has been quite a bit of variability in the specific nodal roles and network metrics examined, studies of the network structure in disease have suggested that changes in the properties of specific nodes are linked to widespread network disruption. Our study builds upon these findings by linking structural damage to specific node types with the magnitude of widespread network disruption.
More broadly, this study adds to a growing literature proposing that function, or dysfunction, of individual brain regions cannot be considered in isolation but rather must be placed within the context of the brain's large-scale network organization (Sporns, 2010b; McIntosh, 2000; Mesulam, 1990). Here we provide evidence for a general principle of brain function where it is the network role, rather than the anatomical location, of a region that determines its importance for organizing modular brain structure and, consequently, the impact that damage to the region will have.
In addition, our findings offer a reinterpretation of perplexing neuropsychological observations present throughout the literature, which show that focal lesions can often be accompanied by unexpected or widespread functional deficits that are not predicted from the local functional properties of the area (Devinsky & D'Esposito, 2001). Furthermore, our findings suggest that an understanding of the network role of the damaged region could be critical for determining a patient's prognosis after brain injury. We predict that damage to hub regions that are central to subnetworks subserving specific cognitive functions will produce specific cognitive deficits, whereas a wider range of functional deficits will result from damage to connector regions that are central to the coordination between multiple subnetworks. Future work will need to examine the extent to which recovery processes reshape the brain's functional networks, potentially through a reassignment of nodal roles to compensate for damage.
Acknowledgments
We are grateful to R. T. Knight, D. Scabini, and J. Black for their help with patient recruitment and our patients and their families for participating in our research. We also thank D. T. Erickson and J. Hoffman for performing the scans of our patients and L. Y. Deouell, R. B. Ivry, K. K. Sreenivasan, and J. R. Cohen for comments on earlier versions of this manuscript. This study was supported by the NIH (MH63901 and NS40813 to M. D.; F32 EY019618-01 to E. N.), VA Research Service, and the DOD (NDSEG to C. G.).
REFERENCES
- Achard S, Bullmore E. Efficiency and cost of economical brain functional networks. PLoS Computational Biology. 2007;3:e17. doi: 10.1371/journal.pcbi.0030017. [DOI] [PMC free article] [PubMed] [Google Scholar]
- Alstott J, Breakspear M, Hagmann P, Cammoun L, Sporns O. Modeling the impact of lesions in the human brain. PLoS Computational Biology. 2009;5:e1000408. doi: 10.1371/journal.pcbi.1000408. [DOI] [PMC free article] [PubMed] [Google Scholar]
- Bartolomei F, Bosma I, Klein M, Baayen JC, Reijneveld JC, Postma TJ, et al. How do brain tumors alter functional connectivity? A magnetoencephalography study. Annals of Neurology. 2006;59:128–138. doi: 10.1002/ana.20710. [DOI] [PubMed] [Google Scholar]
- Bassett DS, Bullmore E, Verchinski BA, Mattay VS, Weinberger DR, Meyer-Lindenberg A. Hierarchical organization of human cortical networks in health and schizophrenia. The Journal of Neuroscience: The Official Journal of the Society for Neuroscience. 2008;28:9239–9248. doi: 10.1523/JNEUROSCI.1929-08.2008. [DOI] [PMC free article] [PubMed] [Google Scholar]
- Bosma I, Reijneveld JC, Klein M, Douw L, van Dijk BW, Heimans JJ, et al. Disturbed functional brain networks and neurocognitive function in low-grade glioma patients: A graph theoretical analysis of resting-state MEG. Nonlinear Biomedical Physics. 2009;3:9. doi: 10.1186/1753-4631-3-9. [DOI] [PMC free article] [PubMed] [Google Scholar]
- Buckner RL, Sepulcre J, Talukdar T, Krienen FM, Liu H, Hedden T, et al. Cortical hubs revealed by intrinsic functional connectivity: Mapping, assessment of stability, and relation to Alzheimer's disease. The Journal of Neuroscience: The Official Journal of the Society for Neuroscience. 2009;29:1860–1873. doi: 10.1523/JNEUROSCI.5062-08.2009. [DOI] [PMC free article] [PubMed] [Google Scholar]
- Bullmore E, Sporns O. Complex brain networks: Graph theoretical analysis of structural and functional systems. Nature Reviews Neuroscience. 2009;10:186–198. doi: 10.1038/nrn2575. [DOI] [PubMed] [Google Scholar]
- Bullmore ET, Bassett DS. Brain graphs: Graphical models of the human brain connectome. Annual Review of Clinical Psychology. 2011;7:113–140. doi: 10.1146/annurev-clinpsy-040510-143934. [DOI] [PubMed] [Google Scholar]
- Cao C, Slobounov S. Alteration of cortical functional connectivity as a result of traumatic brain injury revealed by graph theory, ICA, and sLORETA analyses of EEG signals. IEEE Transactions on Neural Systems and Rehabilitation Engineering: A Publication of the IEEE Engineering in Medicine and Biology Society. 2010;18:11–19. doi: 10.1109/TNSRE.2009.2027704. [DOI] [PMC free article] [PubMed] [Google Scholar]
- Carter AR, Astafiev SV, Lang CE, Connor LT, Rengachary J, Strube MJ, et al. Resting interhemispheric functional magnetic resonance imaging connectivity predicts performance after stroke. [Research Support, NIH, Extramural Research Support, Non-U.S. Gov't] Annals of Neurology. 2010;67:365–375. doi: 10.1002/ana.21905. [DOI] [PMC free article] [PubMed] [Google Scholar]
- Castellanos NP, Paul N, Ordonez VE, Demuynck O, Bajo R, Campo P, et al. Reorganization of functional connectivity as a correlate of cognitive recovery in acquired brain injury. Brain: A Journal of Neurology. 2010;133:2365–2381. doi: 10.1093/brain/awq174. [DOI] [PubMed] [Google Scholar]
- Cox RW. AFNI: Software for analysis and visualization of functional magnetic resonance neuroimages. Computers and Biomedical Research, an International Journal. 1996;29:162–173. doi: 10.1006/cbmr.1996.0014. [DOI] [PubMed] [Google Scholar]
- Crofts JJ, Higham DJ, Bosnell R, Jbabdi S, Matthews PM, Behrens TE, et al. Network analysis detects changes in the contralesional hemisphere following stroke. Neuroimage. 2011;54:161–169. doi: 10.1016/j.neuroimage.2010.08.032. [DOI] [PMC free article] [PubMed] [Google Scholar]
- Danon L, Díaz-Guilera A, Duch J, Arenas A. Comparing community structure identification. Journal of Statistical Mechanics: Theory and Experiment. 2005;2005:P09008. [Google Scholar]
- Devinsky O, D'Esposito M. Neurology of cognitive and behavioral disorders. Oxford University Press; New York: 2001. [Google Scholar]
- Farah MJ. Neuropsychological inference with an interactive brain—A critique of the locality assumption. Behavioral and Brain Sciences. 1994;17:43–61. [Google Scholar]
- Feeney DM, Baron JC. Diaschisis. Stroke; A Journal of Cerebral Circulation. 1986;17:817–830. doi: 10.1161/01.str.17.5.817. [DOI] [PubMed] [Google Scholar]
- Fox MD, Snyder AZ, Vincent JL, Corbetta M, Van Essen DC, Raichle ME. The human brain is intrinsically organized into dynamic, anticorrelated functional networks. Proceedings of the National Academy of Sciences, U.S.A. 2005;102:9673–9678. doi: 10.1073/pnas.0504136102. [DOI] [PMC free article] [PubMed] [Google Scholar]
- Friston KJ, Ashburner J, Kiebel SJ, Nichols TE, Penny WD. Statistical parametric mapping: The analysis of functional brain images. Academic Press; London: 2007. [Google Scholar]
- Gerloff C, Bushara K, Sailer A, Wassermann EM, Chen R, Matsuoka T, et al. Multimodal imaging of brain reorganization in motor areas of the contralesional hemisphere of well recovered patients after capsular stroke. [Research Support, NIH, Intramural Research Support, Non-U.S. Gov't] Brain: A Journal of Neurology. 2006;129:791–808. doi: 10.1093/brain/awh713. [DOI] [PubMed] [Google Scholar]
- Geschwind N. Disconnexion syndromes in animals and man. I. Brain: A Journal of Neurology. 1965a;88:237–294. doi: 10.1093/brain/88.2.237. [DOI] [PubMed] [Google Scholar]
- Geschwind N. Disconnexion syndromes in animals and man. II. Brain: A Journal of Neurology. 1965b;88:585–644. doi: 10.1093/brain/88.3.585. [DOI] [PubMed] [Google Scholar]
- Grefkes C, Nowak DA, Eickhoff SB, Dafotakis M, Kust J, Karbe H, et al. Cortical connectivity after subcortical stroke assessed with functional magnetic resonance imaging. [Research Support, Non-U.S. Gov't] Annals of Neurology. 2008;63:236–246. doi: 10.1002/ana.21228. [DOI] [PubMed] [Google Scholar]
- Guggisberg AG, Honma SM, Findlay AM, Dalal SS, Kirsch HE, Berger MS, et al. Mapping functional connectivity in patients with brain lesions. Annals of Neurology. 2008;63:193–203. doi: 10.1002/ana.21224. [DOI] [PMC free article] [PubMed] [Google Scholar]
- Guimera R, Nunes Amaral LA. Functional cartography of complex metabolic networks. Nature. 2005;433:895–900. doi: 10.1038/nature03288. [DOI] [PMC free article] [PubMed] [Google Scholar]
- Guye M, Bettus G, Bartolomei F, Cozzone PJ. Graph theoretical analysis of structural and functional connectivity MRI in normal and pathological brain networks. Magma. 2010;23:409–421. doi: 10.1007/s10334-010-0205-z. [DOI] [PubMed] [Google Scholar]
- Hagberg AA, Schult DA, Swart PJ. Exploring network structure, dynamics, and function using NetworkX. In: Varoquaux G, Vaught T, Millman J, editors. Proceedings of the 7th Python in Science Conference (SciPy2008) Pasadena, CA: 2008. pp. 11–15. [Google Scholar]
- He BJ, Snyder AZ, Vincent JL, Epstein A, Shulman GL, Corbetta M. Breakdown of functional connectivity in frontoparietal networks underlies behavioral deficits in spatial neglect. Neuron. 2007;53:905–918. doi: 10.1016/j.neuron.2007.02.013. [DOI] [PubMed] [Google Scholar]
- He Y, Dagher A, Chen Z, Charil A, Zijdenbos A, Worsley K, et al. Impaired small-world efficiency in structural cortical networks in multiple sclerosis associated with white matter lesion load. Brain: A Journal of Neurology. 2009;132:3366–3379. doi: 10.1093/brain/awp089. [DOI] [PMC free article] [PubMed] [Google Scholar]
- He Y, Wang J, Wang L, Chen ZJ, Yan C, Yang H, et al. Uncovering intrinsic modular organization of spontaneous brain activity in humans. PloS One. 2009;4:e5226. doi: 10.1371/journal.pone.0005226. [DOI] [PMC free article] [PubMed] [Google Scholar]
- Honey CJ, Sporns O. Dynamical consequences of lesions in cortical networks. Human Brain Mapping. 2008;29:802–809. doi: 10.1002/hbm.20579. [DOI] [PMC free article] [PubMed] [Google Scholar]
- McIntosh AR. Towards a network theory of cognition. Neural Networks: The Official Journal of the International Neural Network Society. 2000;13:861–870. doi: 10.1016/s0893-6080(00)00059-9. [DOI] [PubMed] [Google Scholar]
- Mesulam MM. Large-scale neurocognitive networks and distributed processing for attention, language, and memory. Annals of Neurology. 1990;28:597–613. doi: 10.1002/ana.410280502. [DOI] [PubMed] [Google Scholar]
- Meunier D, Lambiotte R, Bullmore ET. Modular and hierarchically modular organization of brain networks. Frontiers in Neuroscience. 2010;4:200. doi: 10.3389/fnins.2010.00200. [DOI] [PMC free article] [PubMed] [Google Scholar]
- Meunier D, Lambiotte R, Fornito A, Ersche KD, Bullmore ET. Hierarchical modularity in human brain functional networks. Frontiers in Neuroinformatics. 2009;3:37. doi: 10.3389/neuro.11.037.2009. [DOI] [PMC free article] [PubMed] [Google Scholar]
- Mintzopoulos D, Astrakas LG, Khanicheh A, Konstas AA, Singhal A, Moskowitz MA, et al. Connectivity alterations assessed by combining fMRI and MR-compatible hand robots in chronic stroke. [Research Support, NIH, Extramural] Neuroimage. 2009;47(Suppl. 2):T90–T97. doi: 10.1016/j.neuroimage.2009.03.007. [DOI] [PMC free article] [PubMed] [Google Scholar]
- Nakamura T, Hillary FG, Biswal BB. Resting network plasticity following brain injury. PloS One. 2009;4:e8220. doi: 10.1371/journal.pone.0008220. [DOI] [PMC free article] [PubMed] [Google Scholar]
- Newman M, Girvan M. Finding and evaluating community structure in networks. Physical Review E. 2004;69 doi: 10.1103/PhysRevE.69.026113. doi: 10.1103/PhysRevE.69.026113. [DOI] [PubMed] [Google Scholar]
- Nomura EM, Gratton C, Visser RM, Kayser A, Perez F, D’Esposito M. Double dissociation of two cognitive control networks in patients with focal brain lesions. Proceedings of the National Academy of Sciences, U.S.A. 2010;107:12017–12022. doi: 10.1073/pnas.1002431107. [DOI] [PMC free article] [PubMed] [Google Scholar]
- Pievani M, de Haan W, Wu T, Seeley WW, Frisoni GB. Functional network disruption in the degenerative dementias. Lancet Neurology. 2011;10:829–843. doi: 10.1016/S1474-4422(11)70158-2. [DOI] [PMC free article] [PubMed] [Google Scholar]
- Price CJ, Warburton EA, Moore CJ, Frackowiak RS, Friston KJ. Dynamic diaschisis: Anatomically remote and context-sensitive human brain lesions. Journal of Cognitive Neuroscience. 2001;13:419–429. doi: 10.1162/08989290152001853. [DOI] [PubMed] [Google Scholar]
- Sharma N, Baron JC, Rowe JB. Motor imagery after stroke: Relating outcome to motor network connectivity. [Comparative Study Research Support, Non-U.S. Gov’t] Annals of Neurology. 2009;66:604–616. doi: 10.1002/ana.21810. [DOI] [PMC free article] [PubMed] [Google Scholar]
- Shehzad Z, Kelly AM, Reiss PT, Gee DG, Gotimer K, Uddin LQ, et al. The resting brain: Unconstrained yet reliable. Cerebral Cortex. 2009;19:2209–2229. doi: 10.1093/cercor/bhn256. [DOI] [PMC free article] [PubMed] [Google Scholar]
- Smith SM, Fox PT, Miller KL, Glahn DC, Fox PM, Mackay CE, et al. Correspondence of the brain's functional architecture during activation and rest. Proceedings of the National Academy of Sciences, U.S.A. 2009;106:13040–13045. doi: 10.1073/pnas.0905267106. [DOI] [PMC free article] [PubMed] [Google Scholar]
- Sporns O. Brain network disease networks of the brain. MIT Press; Cambridge, MA: 2010a. pp. 207–231. [Google Scholar]
- Sporns O. Networks of the brain. MIT Press; Cambridge, MA: 2010b. [Google Scholar]
- Sporns O, Honey CJ, Kotter R. Identification and classification of hubs in brain networks. PloS One. 2007;2:e1049. doi: 10.1371/journal.pone.0001049. [DOI] [PMC free article] [PubMed] [Google Scholar]
- Stam CJ, de Haan W, Daffertshofer A, Jones BF, Manshanden I, van Cappellen van Walsum AM, et al. Graph theoretical analysis of magnetoencephalographic functional connectivity in Alzheimer'sdisease. Brain: A Journal of Neurology. 2009;132:213–224. doi: 10.1093/brain/awn262. [DOI] [PubMed] [Google Scholar]
- Steiger JH. Tests for comparing elements of a correlation matrix. Psychological Bulletin. 1980;87:245–251. [Google Scholar]
- Supekar K, Menon V, Rubin D, Musen M, Greicius MD. Network analysis of intrinsic functional brain connectivity in Alzheimer's disease. PLoS Computational Biology. 2008;4:e1000100. doi: 10.1371/journal.pcbi.1000100. [DOI] [PMC free article] [PubMed] [Google Scholar]
- Tzourio-Mazoyer N, Landeau B, Papathanassiou D, Crivello F, Etard O, Delcroix N, et al. Automated anatomical labeling of activations in SPM using a macroscopic anatomical parcellation of the MNI MRI single-participant brain. Neuroimage. 2002;15:273–289. doi: 10.1006/nimg.2001.0978. [DOI] [PubMed] [Google Scholar]
- Warren JE, Crinion JT, Lambon Ralph MA, Wise RJ. Anterior temporal lobe connectivity correlates with functional outcome after aphasic stroke. [Comparative Study Research Support, Non-U.S. Gov't] Brain: A Journal of Neurology. 2009;132:3428–3442. doi: 10.1093/brain/awp270. [DOI] [PMC free article] [PubMed] [Google Scholar]
- Young MP, Hilgetag CC, Scannell JW. On imputing function to structure from the behavioural effects of brain lesions. Philosophical Transactions of the Royal Society of London, Series B, Biological Sciences. 2000;355:147–161. doi: 10.1098/rstb.2000.0555. [DOI] [PMC free article] [PubMed] [Google Scholar]


