Abstract
Protein methyltransferases (PMTs) catalyze arginine and lysine methylation of diverse histone and nonhistone targets. These posttranslational modifications play essential roles in regulating multiple cellular events in an epigenetic manner. In the recent process of defining PMT targets, S-adenosyl-L-methionine (SAM) analogues have emerged as powerful small molecule probes to label and profile PMT targets. To examine efficiently the reactivity of PMTs and their variants on SAM analogues, we transformed a fluorogenic PMT assay into a ready high throughput screening (HTS) format. The reformulated fluorogenic assay is featured by its uncoupled but more robust character with the first step of accumulation of the commonly-shared reaction byproduct S-adenosyl-L-homocysteine (SAH), followed by SAH-hydrolyase-mediated fluorogenic quantification. The HTS readiness and robustness of the assay were demonstrated by its excellent Z′ values of 0.83–0.95 for the so-far-examined 8 human PMTs with SAM as a cofactor (PRMT1, PRMT3, CARM1, SUV39H2, SET7/9, SET8, G9a and GLP1). The fluorogenic assay was further implemented to screen the PMTs against five SAM analogues (allyl-SAM, propargyl-SAM, (E)-pent-2-en-4-ynyl-SAM (EnYn-SAM), (E)-hex-2-en-5-ynyl-SAM (Hey-SAM) and 4-propargyloxy-but-2-enyl-SAM (Pob-SAM)). Among the examined 8×5 pairs of PMTs and SAM analogues, native SUV39H2, G9a and GLP1 showed promiscuous activity on allyl-SAM. In contrast, the bulky SAM analogues, such as EnYn-SAM, Hey-SAM and Pob-SAM are inert toward the panel of human PMTs. These findings therefore provide the useful structure-activity guidance to further evolve PMTs and SAM analogues for substrate labeling. The current assay format is ready to screen methyltransferase variants on structurally-diverse SAM analogues.
Introduction
The human genome encodes more than 60 protein methyltransferases (PMTs).1 A common feature of PMTs is to use S-adenosyl-L-methionine (SAM) as a cofactor and deliver its sulfonium methyl group to specific arginine or lysine residues of PMT substrates (Figure 1).2, 3 More than 30 human PMTs (> 50% of human-genome-encoded PMTs) have demonstrated such activity to methylate histone substrates.4 These events regulate numerous biological processes, such as transcription activation, heterochromatin silencing and X chromosome inactivation.5, 6 For instance, histone H3 lysine 4 (H3K4) can be methylated by a dozen of human PMTs, such as SET7/9, MLL1-5, SET1A/B and SMYD3, and this methylation often leads to gene activation.6, 7 In contrast, histone H3 lysine 9 (H3K9) can be recognized by 8 human PMTs, including G9a/GLP1 and SUV39H1/2, and the corresponding H3K9 methylation is frequently linked to euchromatin and heterochromatin silencing.6, 7 At least four human protein arginine methyltransferases (PRMT1, CARM1/PRMT4, PRMT5 and PRMT6) account for so-far-known in vivo histone arginine methylations (Arg2, 8, 17, 26 on histone H3 and Arg3 on histone H4).7–9 The combined histone arginine and lysine methylations, together with other posttranslational modifications (acetylation, phosphorylation and ubiquitination), have been implicated as codes to regulate epigenetic functions.4, 6
Figure 1.
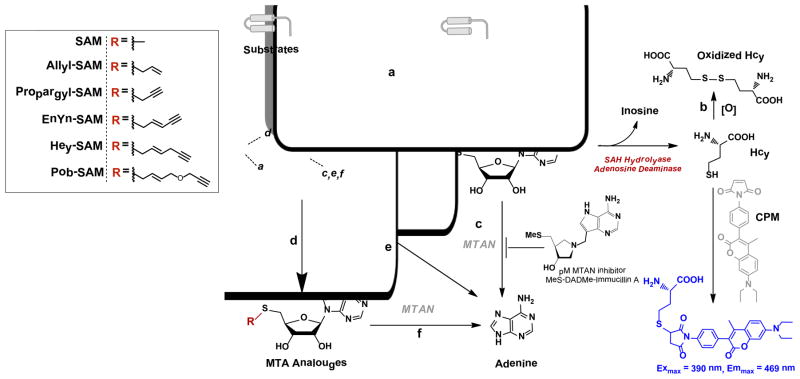
Mechanistic scheme and side reactions in the enzyme-coupled fluorogenic PMT-activity assay. Regardless substrates, SAM or SAM analogue cofactors, PMT variants and alkylated products, the commonly-shared byproduct SAH of PMT-catalyzed reactions (Pathway a) can be processed into Hcy by SAHH (SAH hydrolase) and ADA (adenosine deaminase), followed by fluorogenic quantification with the thiol-reactive probe CPM. Air-mediated oxidation of Hcy (Pathway b) can be minimized by decoupling the prior step of SAH production with the subsequent enzyme-coupled SAH-to-Hcy conversion. Potential MTAN contamination in PMTs causes the degradation of SAH to adenine, which can be suppressed by MTAN inhibitor methylthio-DADMe-Immucillin A (Pathway c). SAM and SAM analogues go through spontaneous decomposition into MTA and adenine (Pathways d, e). MTA can also be processed into adenine by MTAN (Pathway f).
Accumulated evidence also indicates that PMTs play their physiological and pathogenic roles through methylating nonhistone substrates.10, 11 Some recent advancements in this aspect include the identification of SET7/9 substrates: the tumor suppressors p53 and pRb, E2F1, HIV transactivator Tat, estrogen receptor α (ERα), PCAF, DNMT1, AKA6, CENPC1, MeCP2, MINT, PPARBP, ZDH8, Cullin1, IRF1, TAF7/10 subunits of TATA box-binding protein complex and RelA subunit of NF-κB;12–23 G9a substrates reptin, mAM, WIZ, CDYL1, CSB, C/EBP and the tumor suppressor p53;(Pless, 2008 #63; Rathert, 2008 #9; Huang, 2010 #308; Lee, 2010 #309) SUV39H1 substrate HP1α; 24 SETDB1 substrate ING2; 24 and SMYD3 substrate VEGF receptor 1.25 These PMT-involved nonhistone methylation events modulate the functions of diverse cellular targets, such as histone-remodeling apparatus, tumor suppressors, transcription regulators, and hormone receptors.6, 11 Some nonhistone targets, similar to histones, can be modified by multiple PMTs (e.g. site-specific methylations of the tumor suppressor p53 by SET7/9, SET8, G9a, GLP1, SMYD2 and PRMT5),12, 26, 27, 28, 29 which may resemble the histone-code scenario for epigenetic regulation.
Despite the importance of the methylation of histone and nonhistone substrates, limited tools are available to identify unambiguously novel PMT substrates.30 In conventional approaches, novel PMT substrates were identified upon screening substrate candidates, such as purified proteins, hypomethylated proteome, or lead-sequence-derived peptides in the presence of exogenous PMTs and radiolabeled SAM.30, 31 Recently, SAM analogues, particularly those containing transferable sulfonium-β chemical reporters (e.g. terminal alkynyl moiety), have emerged as powerful small-molecule tools for PMT substrate labeling (Figure 1).32–35 In this approach, the enzymatic installation of the clickable chemical reporters from the SAM analogues enables the labeled PMT substrates to be characterized with azido-based probes through Cu-catalyzed azide-alkyne cycloaddition (CuAAC or click chemistry).32–35 For instance, propargyl, (E)-pent-2-en-4-ynyl (EnYn-SAM), (E)-hex-2-en-5-ynyl (Hey-SAM) and 4-propargyloxy-but-2-enyl (Pob-SAM) SAM analogues have demonstrated such feasibility to label the substrates of SETDB1, MLL4, G9a and PRMT1, respectively.32–35 Although these SAM analogues showed promising application for specific PMTs, their general applicability to PMTs has not been well explored.
To identify PMTs and their variants that can act on SAM analogue cofactors (active enzyme-cofactor pairs), prior approaches mainly relied on mass spectrometry (MS) analysis by detecting desirable alkylation on substrates.32–35 However, the ionization efficiency of the alkylated substrates may alter significantly according to their physical and chemical properties as well as the ways to process MS samples. More importantly, MS-based methods are less suitable for a high throughput screening (HTS) format. In contrast, quantification of SAH (S-adenosyl-homocysteine), the commonly-shared methylation byproduct (Figure 1, Pathway a), has been adapted in multiple PMT-activity assays.36–42 For example, SAH can be processed to hypoxanthine, which can be quantified by its characteristic UV at 265nm.38 Our laboratory and others also developed an ultrasensitive luminescence assay (SAH detection threshold of 0.3 pmol) through stepwise conversion of SAH to adenine, adenosine monophosphate, and then adenosine triphosphate, followed by quantification with a luciferin-luciferase kit.41, 43 SAH can also be processed to homocysteine (Hcy) by 5′-methylthio-adenosine/SAH nucleosidase (MTAN) and S-ribosylhomocysteinase, or SAH hydrolyase.37, 40, 42 The resultant production of Hcy can then be detected upon exposing its reactive free-thiol residue to several colorimetric/fluorogenic probes.37, 40, 42
Given that SAH is a commonly-shared byproduct regardless of PMTs, substrates and most of SAM analogue cofactors, we envision reformulating a SAH-based PMT-activity assay and implementing it to define the structure-activity-relationship (SAR) of a collection of PMTs on SAM analogues. In this work, we described a successful adaptation of a SAH-based fluorogenic PMT-activity assay into a HTS mix-and-measure format. The robustness and HTS readiness of the assay were confirmed by its 96-well-plate capability and excellent Z′ scores of 0.83–0.95 for so-far-examined SAM-enzyme pairs (human PRMT1, PRMT3, CARM1, SUV39H2, SET7/9, SET8, G9a and GLP1). The reformulated fluorogenic assay was also validated by its ability to identify the same set of hits as the prior labor-intensive MS method. With this assay, five SAM cofactors (allyl-SAM, propargyl-SAM, (E)-pent-2-en-4-ynyl-SAM (EnYn-SAM), (E)-hex-2-en-5-ynyl-SAM (Hey-SAM) and 4-propargyloxy-but-2-enyl-SAM (Pob-SAM)) were screened against the 8 human PMTs in a combinatorial manner. Here we concluded that allyl-SAM is a promiscuous SAM analogue cofactor and can be utilized efficiently by a subset of native PMTs (SUV39H2, G9a and GLP1). In contrast, none of the 8 PMTs is active toward the bulky, terminal-alkyne-containing clickable SAM analogues. The structure-activity-relationship therefore argues the need to engineer the PMTs to efficiently recognize the bulky SAM analogues for substrate labeling. The current format of the fluorogenic assay is readily adaptable for engineered PMTs and SAM variants.
Materials and Methods
General reagents
All general reagents were obtained from Fisher Scientific unless mentioned otherwise. S-adenosyl-L-methionine (SAM) and S-adenosyl-L-homocysteine (SAH) were purchased from Sigma Aldrich. ThioGlo 1 [10-(2,5-dihydro-2,5-dioxo-1H-pyrrol-1-yl)-9-methoxy-3-oxo-methyl ester 3H-naphthol(2,1-β)pyran-S-carboxylic acid] and CPM (7-Diethylamino-3-(4-maleimidophenyl)-4-methylcoumarin) were purchased from Calbiochem and Invitrogen, respectively. MTAN inhibitor methylthio-DADMe-ImmA is a generous gift from the Schramm lab at Albert Einstein College of Medicine. RGG peptide (GGRGGFGGRGGFGGRGGFG), histone H3 (1-40) peptide (1-40 aa, ARTKQTARKSTGGKAPRKQLATKAARKSAPATGGVKKPHR), histone H3 (1-21) peptide (1-21 aa, ARTKQTARKSTGGKAPRKQLA), C-terminal biotin-conjugated histone H3 (1-21) peptide (1-21 aa, ARTKQTARKSTGGKAPRKQLAGGK-Biotin) and histone H4 (10-30) peptide (10-30 aa, LGKGGAKRHRKVLRDNIQGIT) were synthesized and purified to >90% by the Proteomics Resource Center at the Rockefeller University. Their integrity was confirmed by mass spectrometry. SAM analogues (allyl-SAM, propargyl-SAM, (E)-pent-2-en-4-ynyl-SAM (EnYn-SAM), (E)-hex-2-en-5-ynyl-SAM (Hey-SAM) and 4-propargyloxy-but-2-enyl-SAM (Pob-SAM)) were synthesized as reported previously.32–35, 44
Protein expression and purification
The PMT plasmids were generous gifts from several labs: the plasmid containing N-terminal His6-tagged human PRMT1 (residues 10–352) was obtained from the Thompson lab at Scripps Florida; N-terminal His6-tagged human PRMT3 (residues 211–531), SUV39H2 (residues 112–410), G9a (also known as EHMT2, residues 913–1193), and GLP1 (also known as EHMT1, residues 951–1235) from the Min lab at the University of Toronto; N-terminal His6-tagged human CARM1 (residues 19–608) from the Frankel laboratory at the University of British Columbia; N-terminal His6-tagged full-length human SET7/9 (hSET7/9), human SET8 (residues 191–352) and Sulfolobus solfataricus SAH hydrolase (SsSAHH) from the Trievel lab at University of Michigan; Plasmodium falciparum adenosine deaminases (PfADA) from the Schramm lab at Albert Einstein College of Medicine.
PRMT1, CARM1, SET7/9, G9a, G9a mutants, SsSAHH, pyruvate orthophosphate dikinase (PPDK), and adenine phosphoribosyl transferase (APRT) were purified as reported previously.33, 35, 37, 41, 45, 46 To express PRMT3, the PRMT3 plasmid was transformed into E. coli strain Rosetta (DE3) and then induced by 0.4 mM IPTG at OD600=0.6 and 16 °C overnight. The PRMT3 protein was then purified by Ni-NTA agarose resin (Qiagen), followed by a HiTrap Q ion-exchange column (GE HealthCare). The SET8 plasmid was transformed into E. coli Rosseta-2 (DE3) strain (Novagen) and induced with 0.4 mM IPTG at OD600=0.6 and 17 °C overnight. The SET8 protein was purified by Ni-NTA agarose resin (Qiagen), followed by Sephacryl S-200 size exclusion column (GE HealthCare). To express SUV39H2, the SUV39H2 plasmid was transformed into E. coli BL21-Gold (DE3) strain (Agilent Technologies) and induced with 0.5 mM IPTG at OD600=0.6 and 17 °C overnight. The SUV39H2 protein was then purified by Ni-NTA agarose resin (Qiagen), followed by HiTrap S Fast Flow ion-exchange column (GE HealthCare). To express human GLP1, the GLP1 plasmid was transformed into E. coli Rosseta-2 (DE3) strain (Novagen). Upon reaching OD600=0.6, the GLP1-inoculated culture was induced with 0.5 mM IPTG at 17 °C in the presence of 25 μM ZnSO4 overnight. GLP1 was then purified with a Ni Sepharose™ 6 Fast Flow column (GE HealthCare) with 25–400 mM gradient imidazole and then a Sephacryl S-200 size exclusion column (GE HealthCare). PfADA was expressed as described previously except that 25 μM ZnSO4 was present in the inoculated medium for protein expression.47
Luminogenic Assay
The luminogenic PMT-activity assay was performed as described previously with some modifications.41 Briefly, into a 20 μl assay buffer (55 mM Hepes, pH=8.0, 0.005% Tween 20 and 0.0005% BSA) containing 55 μM SAM, 22 μM peptide substrate (H4 10-30aa peptide for SET8 and H3 1-21aa peptide for GLP1), PMT (1 μM SET8 or 0.2 μM GLP1) was added and then incubated for 12 h at ambient temperature (22°C). From the reaction mixture, 5 μl aliquot was transferred by a multiple-channel pipette into a 96-well plate containing 5 μl coupling buffer (100 mM Tris-acetate, pH=7.7, 2 mM phosphoenolpyruvic acid tri(cyclohexylammonium)salt, 2 mM sodium pyrophosphate decahydrate, 2 mM 5-phospho-D-ribose-1-diphosphate sodium salt, 15 mM NH4SO4, 15 mM (NH4)2MoO4, 10 mM MgSO4, 0.8 U/ml PPDK, and 0.4 U/ml APRT). After adding 50 μl of D-luciferin/luciferase assay buffer and shaking the mixture for 30 s in dark, the luminescent signal was read on a luminescent microplate reader (Thermo Scientific Fluoroskan Ascent FL).
Fluorogenic Assay
In the fluorogenic assay format, PMT-associated reactions were carried out in a white 96-well plate (Corning, Cat.#3915) at ambient temperature (22 °C). The wells were pre-coated with 2.5 μl of 1 mM SAM or SAM analogues (see below for details of SAM analogues) and stored at −80 °C before use. As a general procedure, the wells were warmed at ambient temperature for 5 min. Into the wells, 18.4 μl of deionized H2O, 10 μl of 5× assay buffer (the final concentration of 55 mM Hepes, pH=8.0, 0.005% Tween 20 and 0.0005% BSA), and 5 μl of PMTs and PMT mutants of various concentrations (see below for details) were added by a multi-channel pipette to give the final volume of 35.9 μl. 10 μl of 100 μM peptide substrate stocks (see below for the substrates used for individual PMTs) were then added to initialize the reactions. For low controls of each PMT, 10 μl deionized H2O rather than peptide substrate solution was added. After incubating the reaction mixture for 12 h, 4.1 μl of the coupling enzyme stocks (SsSAHH and PfADA, 10 μM and 0.35 μM final concentrations, respectively) were added and the mixture was subject to additional incubation for 1 h. The reactions were then quenched by 50 μl ice-cold isopropanol, followed by 30 min gentle shaking and then the addition of 100 μL ThiolGol 1 (50 μM in DMSO) or CPM (50 μM stock in 1% triton X). The mixture was shaken gentlely in dark for another 10 min. The fluorescence signals were then measured on SpectraMax M2 plate reader (Molecular Devices) with 390 nm-excitation/469 nm-emission and 96-well-plate reading mode. Here the fluorescence readouts of the low controls were either used to calculate Z′ factors or subtracted from the fluorescence readouts of test samples for background correction.
In the present work, SAM and five SAM analogues, allyl-SAM, propargyl-SAM, (E)-pent-2-en-4-ynyl-SAM (EnYn-SAM), (E)-hex-2-en-5-ynyl-SAM (Hey-SAM) and 4-propargyloxy-but-2-enyl-SAM (Pob-SAM) were screened against designated PMTs and PMT mutants. The substrates used in the PMT assays are RGG peptide for PRMT1 and PRMT3; histone H3 (1-40) peptide for CARM1; histone H4 (10-30) peptide for SET8; histone H3 (1-21) peptide for SET7/9, SUV39H2, G9a, GLP1 and engineered G9a.
In the PMT-catalyzed reactions, the final concentrations of PMTs are 0.2 μM for PRMT1, PRMT3, SUV39H2, G9a and GLP1; 1 μM for CARM1, SET7/9 and SET8 unless mentioned otherwise. To examine whether the PMTs contain MTAN contamination, the enzymes were pre-incubated with 55 nM MTAN inhibitor methylthio-DADMe-ImmA for 15min. The reactions were then performed in the inhibitor-treated buffer. For the reactions involved with G9a and G9a mutants (Y1067A, Y1085A, R1109A, F1152A, Y1154A and F1158A mutants), the same treatment with the MTNA inhibitor was also followed to suppress the MTAN-mediated side reaction.
Statistical analysis of the fluorogenic assay
Z′ factor, a parameter to evaluate signal-to-background separations of HTS assays, is calculated with the following equation: Z′ = 1 − [(3δ+ + 3δ−)/(μ+ − μ−)], where δ+, δ−, μ+ and μ− are denoted for standard deviations (δ) and average values (μ) for the high (+) and low (−) controls, respectively.
Stability assessment and standard curve for SAH quantification
To assess the stability of SAH and Hcy in the air-exposed assay buffer, 20 μM SAH in 50 μl of 1× reaction buffer (50 mM Hepes, pH=8.0, 0.005% Tween 20 and 0.0005% BSA) was incubated for a designated period of time in either absence or presence of the SAH-to-Hcy coupling enzymes (10 μM SsSAHH and 0.35 μM PfADA), followed by CPM-mediated quantification. The two fluorescence readouts after the pre-incubation reported residual SAH and Hcy, respectively. The two sets of fluorescence intensity (triplicates) were plotted against time.
To generate the standard curve for SAH quantification, into 1× reaction buffer (50 mM Hepes, pH=8.0, 0.005% Tween 20 and 0.0005% BSA, final concentrations), SAH stock solution (0–50 μM, final concentration) and the coupling enzymes (10 μM SsSAHH and 0.35 μM PfADA, final concentrations) were added to give the final volume of 50 μl. After 1-h incubation, the reactions were quenched with 50 μl ice-cold isopropanol, followed by the addition of 100 μl of CPM stock (50 μM stock in 1% triton X). The fluorescence signals were measured with SpectraMax M2 plate reader as described above.
MALDI-TOF analysis to validate allylated H3K9 peptide products
To validate the hits identified through the primary fluorogenic screening assay, in vitro PMT-catalyzed reactions were carried out as described in the fluorogenic assay except that biotin-conjugated histone H3 (1-21) peptide rather than histone H3 (1-21) peptide was used as the substrate. Briefly, 0.2 μM PMTs (SUV39H2, G9a or GLP1) were added into the buffer (50 mM Hepes, pH=8.0) containing 20 μM biotin-conjugated histone H3 (1-21) peptide substrate and 50 μM allyl-SAM analogue. After 12-h incubation at ambient temperature, the biotin-conjugated peptide products were pulled out by Streptavidin Sepharose™ (GE HealthCare), washed 3 times with deionized H2O, and eluted with 10 μl 50% acetonitrile/H2O. To prepare MALDI-TOF MS samples, 1 μl of the elute was mixed with 1 μl of saturated α-cyano-hydroxy-cinnamic acid solution (30% acetonitrile/H2O) on a MALDI sample plate, followed by a rapid dry at ambient temperature. The dried samples were then subject to MALDI-TOF MS analyses (Voyager-DE STR, Applied Biosystems, Framingham, MA, USA). Desorption/Ionization was obtained using delayed-extraction, positive ion mode by a 337-nm nitrogen laser (3-ns pulse width). Laser power was adjusted slightly above threshold to obtain good resolution and signal/background ratios. Each measurement was the accumulation of three spectra collected at ten different positions with 500 shots per position. Mass calibration was achieved using external standard Calibration Mix 2 (Applied Biosystems).
Results
Assay format and its signal-to-background separation
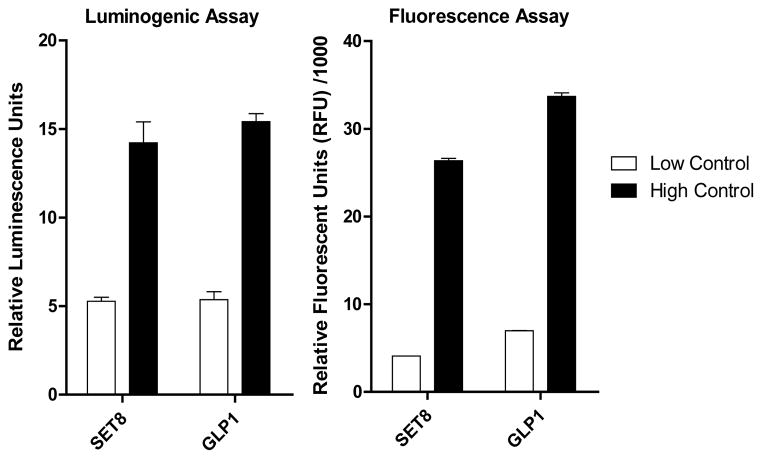
PMTs and several PMT mutants have shown activities to modify their substrates with SAM and SAM analogue cofactors, accompanied by the generation of SAH as the byproduct (Figure 1, Pathway a). To probe such activities for diverse PMT variants and SAM analogues, we envisioned formulating a high-throughput (HTS) assay via quantification of SAH, the commonly-shared byproduct of this type of reactions (Figure 1). Among so-far reported PMT-activity assays for SAH quantification, we focused on two enzyme-coupled assays (the luminogenic assay and the fluorogenic assay as referred later) because of their excellent sensitivity and ready HTS adaptability (see Discussion for their comparison with other PMT-activity assays).37, 41 The luminogenic assay and the fluorogenic assay rely on the readouts of the luciferase-mediated lumens of ATP and the ThioGlo1-mediated fluorescence of Hcy, respectively, both of which originate from SAH (see Discussion for details).37, 41, 43, 48 Here we compared the signal-to-background ratios of the two assays using SET8 and GLP1 as model PMTs. Under our assay conditions (see Methods), the luminogenic assay displayed signal-to-background separation of 3.6 and 2.9 for SET8 and GLP1 (Figure 2), respectively. In comparison, the fluorogenic assay showed 2-fold better signal-to-background separation. Given the importance of the signal-to-background separation for Z′ values and thus HTS adaptability, we therefore preferred the fluorogenic assay for more robust SAH quantification.
Figure 2.
Comparison of low-to-high separation of enzyme-coupled luminogenic assay (left panel) and fluorogenic assay (right panel). SET8 and GLP1 were used as model PMTs to evaluate the low-to-high separation of the luminogenic assay and the fluorogenic assay. Here the PMT-catalyzed methylation reactions (high controls) were carried out in 50 μl reaction buffers containing 1 μM SET8 or 0.2 μM GLP1, 22 μM peptide substrate and 55 μM SAM (see Methods for details). Low controls were performed similarly except in the absence of peptide substrates. For both enzymes, the fluorogenic assay displayed approximately 2-fold better high-to-low separation than the luminogenic assay (4.8 for SET8 and 6.5 for GLP1 versus 2.9 for SET8 and 3.6 for GLP1). The error bars denote standard deviation (some are invisible because of their small values).
Improving assay robustness using CPM as an alternative fluorogenic dye
The previously reported fluorogenic assay used the thiol-reactive fluorogenic dye ThioGlo1 for SAH quantification.37 To further improve signal-to-background separation, we compared ThioGlo1 with CPM, another thiol-reactive dye that shares a similar fluorogenic mechanism as ThioGlo1.49 Under current assay conditions, CPM displayed 4-fold better signal-to-background separation than ThioGlo1 (Figure 3a). Here 10 μM SsSAHH and 0.35 μM PfADA in a 50 μl reaction mixture are sufficient to convert 5000 pmol SAH within 1 h. Adding more SsSAHH and PfADA does not significantly accelerate the rate to process SAH into Hcy, indicating that excessive coupling enzymes have been used under the current conditions (data now shown). SAH-quantification standard curve was then generated and displayed a linear response in the range of so-far-examined SAH concentration (0.05–50 μM SAH or 2.5–2500 pmol in 50 μl assay buffer) (Figure 3b). Here the CPM-based fluorogenic assay can detect as low as 2.5 pmol SAH or 0.05 μM SAH in 50 μl assay buffer (3-fold standard deviation above background, inset of Figure 3b), which is 20-fold more sensitive than the ThioGlo1-based method. Collectively, the signal-to-background separation and sensitivity of the fluorogenic assay were improved through the CPM-facilitated signal enhancement, and thus present CPM as a desirable surrogate of ThioGlo1 for SAH quantification.
Figure 3.
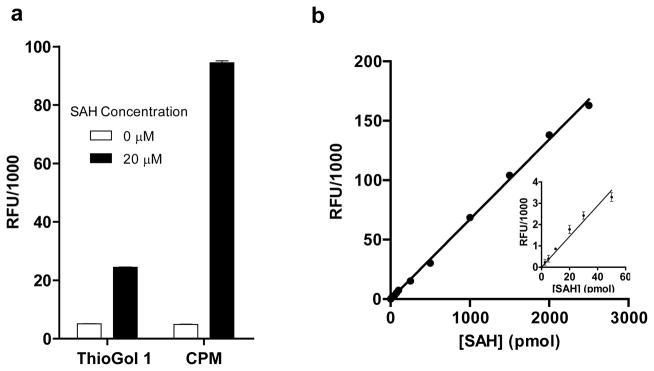
Fluorogenic format (left panel) and standard curve (right panel) for SAH quantification.(a) Comparison of CPM with ThioGol 1 as the fluorogenic dye. The fluorescence readouts of low controls (without substrate) and high controls (with substrates) of thiol-reactive fluorogenic dyes ThioGol 1 and CPM were compared after 1-h incubation of 20 μM SAH in a 50μl reaction buffer containing 10 μM SAHH and 0.35 μM ADA. Here the high-to-low separation with CPM as the fluorogenic dye is 4-fold higher than that with ThioGlo 1.(b) Standard curve for SAH quantification. A SAH-quantification curve was generated in a 96-well-microplate format for 0–2500 pmol SAH (0–50 μM of 50 μl reaction) with 10 μM SsSAHH and 0.35 μM PfADA as coupling enzymes and CPM as the fluorogenic dye. The inset corresponds to the signal of 0 to 50 pmol SAH (0–5 μM SAH in 50 μl reaction). The mean and standard deviation of triplicate measurements are shown. The error bars denote standard deviation (some are invisible because of their small values).
Reformulating fluorogenic assay by decoupling SAH production from SAH processing and quantification
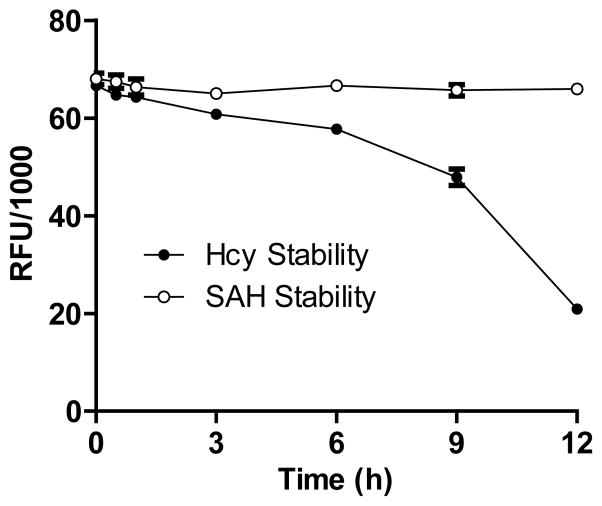
The fluorogenic assay relies on the two coupling enzymes SAHH and ADA for SAH-to-Hcy conversion.49 In the prior work, PMT-catalyzed methylation was carried out in the presence of SAHH and ADA.49 This coupled format allowed Hcy production in situ from SAH. However, the freshly-generated Hcy was also air-exposed in the reaction buffer for a period of time until the free-thiol-capturing dye ThioGlo1 was added. Given potential oxidation of Hcy (forming a disulfide bond) under aerobic conditions (Figure 1, Pathway b), we further evaluated the stability of Hcy under our assay condition. The signal of Hcy, which was generated from SAH by SAHH, decreased slightly within the first 3 h, but suffered a dramatic loss after 6-h in the air-exposed buffer (Figure 4). In contrast, SAH is stable in the assay buffer as demonstrated by its constant fluorescence readout after 12-h aerobic exposure (Figure 4). Given the excellent stability of SAH in contrast to the rapid oxidation of Hcy, we modified the fluorogenic assay by decoupling the step of PMT-catalyzed accumulation of SAH from the subsequent SAHH-mediated formation of Hcy. This uncoupled format minimized the air-exposure and thus undesirable oxidation of Hcy. This modification makes the current protocol suitable for less active PMTs by readily extending reaction time.
Figure 4.
Assessing stability of SAH and Hcy in air-exposed reaction buffer. The fluorescent readouts of 1 nmol SAH (20 μM in 50 μl reaction buffer) were measured after pre-incubating for 0–12 h in the absence or presence of 10 μM SsSAHH and 0.35 μM PfADA. Since the amount of the coupling enzymes is sufficient to process 1 nmol SAH to Hcy within 1 h (data not shown), the fluorescence readouts in the absence and presence of the couple enzymes are proportional to the amount of residual SAH and Hcy after the pre-incubation step, respectively. The constant fluorescence readout in the former indicates that SAH is stable under the assay condition. In contrast, the gradual loss of fluorescence readout in the latter scenario suggests that Hcy is subject to air-mediated oxidation under the assay condition
Quantification of SAH accumulated in PMT-catalyzed reactions
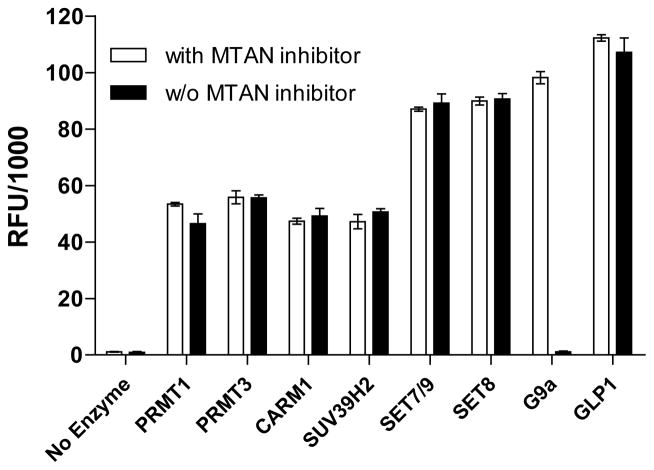
After confirming the stability of SAH in our assay buffer, we further examined the stability of SAH accumulated in PMT-catalyzed methylation reactions. Here we compared the SAH-associated fluorescence readouts in the methylation reactions of the 8 human PMTs (PRMT1, PRMT3, CARM1, SUV39H2, SET7/9, SET8, G9a and GLP1). All the examined PMTs except G9a showed robust fluorescence readouts (Figure 5), consistent with their demonstrated activities to methylate respective substrates together with SAM consumption and SAH accumulation. In contrast, G9a-catalyzed methylation reaction gave barely above-background fluorescence signal, although the G9a-mediated methylation can be detected readily with MS analysis for expected H3K9 methylation product (data not shown). We therefore reasoned that the loss of SAH signal in the G9a-catalyzed reaction was associated with unexpected degradation of SAH.
Figure 5.
Fluorescence readouts of PMT-catalyzed methylation reactions in the absence or presence of MTAN inhibitor. The methylation reactions were carried out in the buffer containing 55μM SAM, 22μM peptide substrates and respective PMTs (0.2 μM for PRMT1, PRMT3 SUV39H2, G9a and GLP1; 1 μM for CARM1, SET7/9 and SET8) in the presence or absence of 55 nM MTAN inhibitor methylthio-DADMe-ImmA. Robust fluorescence readouts were observed for the panel of PMTs except G9a. In contrast, the loss of fluorescence signal in G9a-catalyzed methylation reaction can be suppressed in the presence of the MTAN inhibitor, consistent with the presence of MTAN contamination. The mean and standard deviation of triplicate measurements are shown.
To explore further the undesirable SAH-degrading activity, we incubated SAH with G9a, and then analyzed the mixture with HPLC. The resultant profile showed that SAH was slowly decomposed into adenine in the presence of G9a (data not shown). Since this SAH-degrading activity mimics MTAN(Parveen, 2011 #61) we then reasoned that E. coli MTAN may exist as an impurity in E. coli-expressed G9a and thus link to the undesirable degradation of SAH to adenine (Figure 1, Pathway c). To confirm that MTAN did account for the SAH-degrading impurity in G9a, we compared the fluorescence readouts of the PMT-catalyzed methylation reactions in the absence or presence of 5′-methylthio-DADMe-ImmA, a pM E. Coli MTAN inhibitor.(Gutierrez, 2007 #62) Consistent with MTAN contamination in G9a, the SAH-associated fluorescence signal in the G9a-catalyzed methylation reaction can be fully restored by adding 55 nM MTAN inhibitor methylthio-DADMe-ImmA (Figure 5). In addition, the MTAN inhibitor itself does not inference with the SAH-associated fluorescence signals, because the untreated and inhibitor-retreated reactions of the other 7 PMTs showed comparable SAH-signal readouts. As a result, the control reaction containing SAH should be carried out in parallel for each PMT to avoid potential MTAN-involved false negatives (one out of eight PMTs in our case). The undesirable side-reaction of MTAN, if observed, can be suppressed in the presence of MTAN inhibitors, such as methylthio-DADMe-ImmA. The reliability of the fluorogenic assay for SAH quantification was further improved in the context of PMT-catalyzed reactions.
High-throughput (HTS) amenability of the fluorescent assay
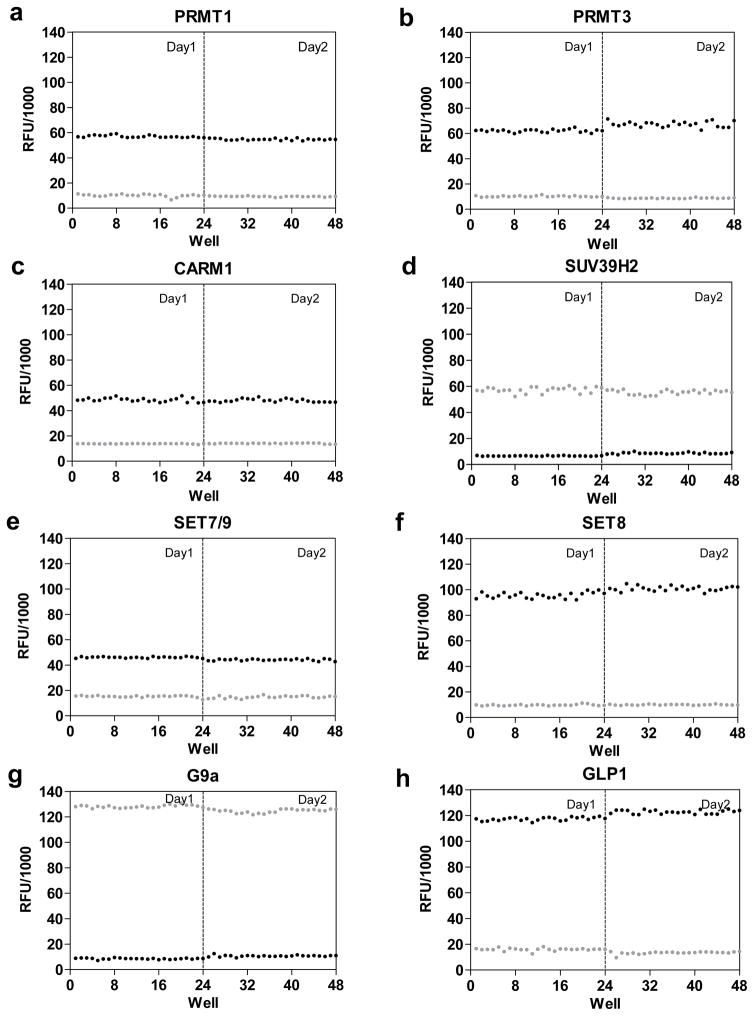
To evaluate HTS adaptability of the current fluorogenic assay, high-to-low controls (24 wells) in 96-well plates were performed for the panel of 8 human PMTs (PRMT1, PRMT3, CARM1, SUV39H2, SET7/9, SET8, G9a and GLP1) (Figure 6).20, 33, 35, 37, 41, 45, 46, 50 These experiments were repeated in a separate day to assess their day-to-day reproducibility (Figure 6). The high and low fluorescence readouts were then plotted against corresponding well numbers. The lack of well-to-well, day-today fluctuation of fluorescence signals indicated that the current assay is suitable for a 96-well-plate HTS format. Moreover, the well-defined high-to-low ratios (2~7) of the panel of PMTs, together with their desirable well-to-well consistency, gave excellent Z′ values of 0.83~0.95 (Figure 6). The current assay therefore demonstrates its readiness to probe PMT activity in a reliable HTS manner.
Figure 6.
Using high-to-low controls to evaluate well-to-well, day-to-day fluctuation and HTS adaptability of the fluorogenic assay. The 2×24-well repeats of the high-to-low fluorescence readouts (without substrates for low controls) were examined in a 96-well-miscroplate format for PRMT1, PRMT3, CARM1, SET7/9, SET8, SUV39H2, G9a and GLP1 (24 wells/enzyme/day for 2 d). The scatter plots of the fluorescence readouts by well numbers display high-to-low ratios of 5 for PRMT1, 2 for PRMT3, 3 for CARM1, 7 for SET7/9, 3 for SET8, 7 for SUV39H2, 5 for G9a and 4 for GLP1. The high-to-low ratios, together with well-to-well, day-to-day variation, give Z′ scores of 0.90 for PRMT1, 0.89 for PRMT3, 0.85 for CARM1, 0.86 for SET7/9, 0.91 for SET8, 0.85 for SUV39H2, 0.90 for G9a and 0.93 for GLP1.
Validating the fluorogenic assay with PMT variants and matched SAM analogue cofactors
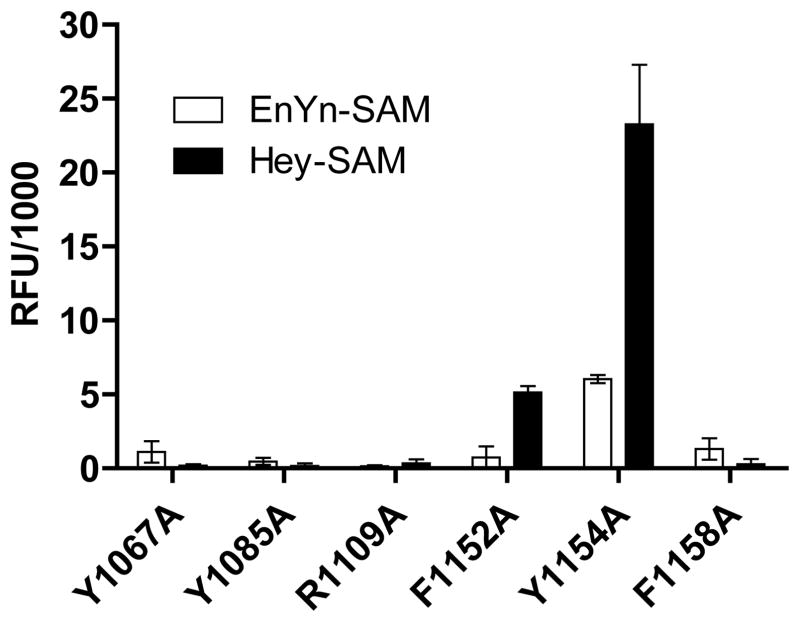
We have shown previously that engineered G9a can utilize (E)-pent-2-en-4-ynyl and (E)-hex-2-en-5-ynyl SAM analogues (EnYn-SAM and Hey-SAM) to label H3K9 substrate with the accumulation of SAH as the by product.33 Given the well-defined activities of the G9a variants on the SAM analogues, we validated the current fluorogenic assay by screening the same panel of G9a mutants against the two SAM analogue cofactors. The reactions of the G9a F1152A mutant with Hey-SAM, and Y1154A mutant with EnYn/Hey-SAM gave positive fluorescence readouts, indicating SAH accumulation in the reactions (Figure 7). Moreover, the Y1154A mutant with Hey-SAM showed 3~5-fold higher fluorescence readouts than the Y1154A mutant with EnYn-SAM and the F1152A mutant with Hey-SAM (Figure 7). The identified positive enzyme-cofactor pairs and their relative intensity of fluorescence readouts recapitulated the results obtained by analyzing the corresponding alkylated products with independent MS approach.33 Such consistency therefore indicated the ability of the current fluorogenic assay to screen PMTs or their variants against SAM analogues.
Figure 7.
Pilot screening of G9a mutants against EnYn-SAM and Hey-SAM. The reactions were carried out in the buffer containing 1 μM G9a mutants, 22 μM H3K9 peptide and 55 μM SAM analogues at ambient temperature for 12 h, and the resultant fluorescence readouts after background correction were shown here. The positive hits of the G9a F1152A mutant for Hey-SAM and Y1154A for EnYn-SAM/Hey-SAM were identified on the basis of at least 3-fold higher signals after background correction in comparison with those of inert enzyme-cofactor pairs. The positive hits and their relative signal signals recapitulated the results obtained with an independent MS approach.(Islam, 2011 #56)
Identifying SAM analogue cofactors for promiscuous PMTs
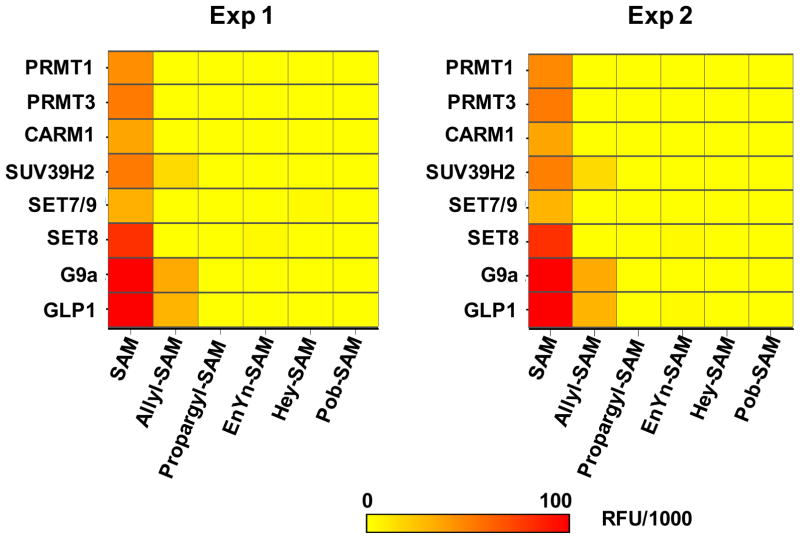
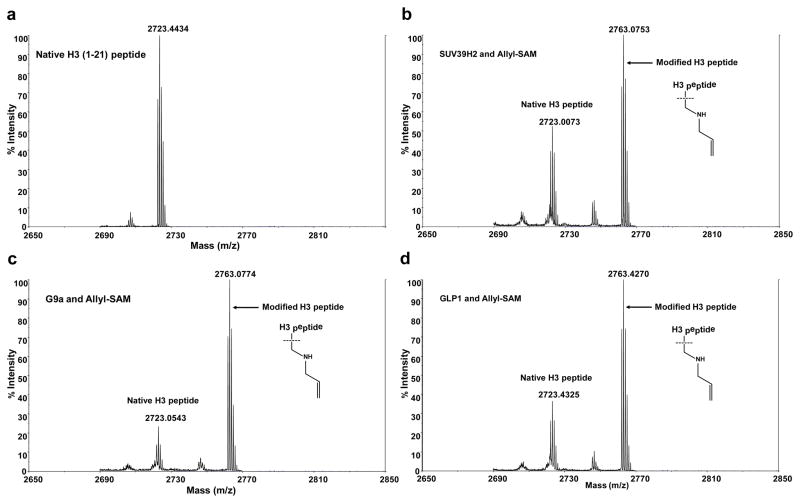
After demonstrating the robustness and HTS reliability of the fluorogenic assay, we further implemented the assay to screen the panel of 8 human PMTs (PRMT1, PRMT3, CARM1, SUV39H2, SET7/9, SET8, G9a and GLP1) against SAM and five SAM analogues (allyl-SAM, propargyl-SAM, EnYn-SAM, Hey-SAM, and Pob-SAM). These SAM analogues were selected because they were identified previously as active methyltransferase cofactors.32–35, 44 The experiment was carried out with all 8×6 combinations between the PMTs and SAM/SAM analogues. The whole set of experiments were duplicated in a separate day to assess day-to-day variation. The fluorescence readouts of the two sets of experiments were then presented in a heat map format (Figure 8). All the 8 PMTs showed strong fluorescence readouts for SAM cofactors, indicating that they are active under the current set of experiments (positive controls). More importantly, the combinatorial screening led to three novel outliers: SUV39H2 G9a and GLP1 for ally-SAM (a 3/40 hit rate), as shown by their positive fluorescence readouts in the two sets of experiments (Figure 8). The three positive hits were further confirmed with the independent MALDI-TOF MS by detecting desirable allylated H3K9 peptide product (Figure 9). The fluorogenic assay with the array-like format and in combination with MS-based validation therefore allowed us to identify three promiscuous PMTs that can efficiently act on the allyl-SAM cofactor.
Figure 8.
Reactivity heatmap of native PRMT1, PRMT3, CARM1, SET7/9, SET8, SUV39H2, G9a and GLP1 on SAM and SAM analogues. The 8 PMTs were screened against SAM and the five SAM analogues in a combinatorial manner. The accumulated reaction byproduct SAH was then quantified with the fluorogenic assay in a HTS-adaptable 96-well-microphate format. The same set of experiments was duplicated in a separate day to assess day-to-day variation. The fluorescence readouts after background correction were plotted against PMTs and cofactors for the heatmap analysis with the color of yellow-to-orange encoded for low-to-high fluorescence signals. Native SUV39H2, G9a and GLP1 were identified to be active on allyl-SAM cofactor.
Figure 9.
Hit validation with independent MS approach. The positive hits identified through the pilot screening (Figure 8) were subject to MALDI-TOF MS for further validation. Allylated H3K9 peptides were confirmed as the enzymatic products of SUV39H2, G9a and GLP1 with allyl-SAM as a cofactor. In contrast, only native H3K9 peptide was detectable for non-enzymatic control.(a) MS of unmodified H3K9 peptide as a negative control (biotin-conjugated H3 peptide, ARTKQTARKSTGGKAPRKQLAGGK-Biotin); (b–d) SUV39H2-, G9a- and GLP1-catalyzed H3K9 allylation with the allyl-SAM cofactor.
Discussion
Reformulation of SAH-based fluorogenic assay to probe novel PMT activities
In this paper, we reformulated a previously-reported fluorogenic PMT-activity assay37 into a plate-reading HTS format for PMTs. The reformulated fluorogenic assay was adapted into a 96-well-microplate-plate format for the 8 human PMTs (PRMT1, PRMT3, CARM1, SUV39H2, SET7/9, SET8, G9a and GLP1). The overall Z′ values of 0.83–0.95 of the 8 PMTs with native SAM as a cofactor further confirmed the HTS readiness of the reformulated assay (Figure 6). This assay can recapitulate the previous MS-based finding that the G9a F1152A and Y1154 mutants can act on EnYn/Hey-SAM (Figure 7)33 and also allowed us to identify novel promiscuous activities of SUV39H2, G9a and GLP1 on allyl-SAM cofactor upon screening the 8 PMTs against five SAM analogues (Figure 8). The two pilot screenings in combination with independent MS validation (Figure 9) further demonstrated the broad applicability of the assay to probing the activities of PMTs and their variants on structurally-diverse SAM analogues.
The current assay format was developed on the basis of a prior fluorogenic PMT-activity assay, which relied on the coupling enzymes SAHH and ADA to process the reaction byproduct SAH into Hcy in a coupled manner (conversion of SAH to Hcy in situ).37 The resultant Hcy was then quantified by the thiol-reactive fluorogenic dye ThioGlo 1.37 In contrast to the prior approach, the reformulated assay is featured by two key modifications: (1) decoupling SAH-to-Hcy conversion into an uncoupled format by first allowing SAH accumulation followed by Hcy production and quantification (Figure 1); (2) replacing ThioGlo1 with the more sensitive dye CPM (Figure 1). The first modification avoids the air-mediated oxidation of Hcy (Figure 1, Pathway b) whose effect becomes dramatic upon 6-h air exposure in reaction buffer (Figure 4). The decoupling step allows us to examine readily less active PMTs by extending reaction time. The second modification with CPM displayed a 20-fold improved detection threshold (2.5 pmol with CPM versus 50 pmol with ThioGlo1) and 4-fold better signal-to-background separation (Figure 3a). The two modifications are essential for our success in adapting the fluorogenic assay into the HTS format.
Comparison of PMT-activity assays
PMT-catalyzed methylation involved enzymatic conversion of substrates to methylated products, accompanied by the consumption of the methyl-donor cofactor SAM and the production of the byproduct SAH (Figure 1, Pathway a). Given low catalytic efficiency for most PMTs (kcat < 1 min−1),37, 41, 45, 46 established PMT-activity assays mainly rely on radioactive SAM, antibodies, mass spectrometry or coupling enzymes to quantify reaction products or byproduct (methylated products or SAH), rather than the consumption of substrates or the SAM cofactor.30, 43, 51 In the reactions with native or mutated PMTs and SAM analogues, SAH production is the solely-shared character regardless of PMTs, PMT substrates and the SAM analogues (Figure 1). This feature therefore presents SAH quantification an amenable and potentially generalizable approach to probe the reactivity of PMTs and their variants on structurally-diverse substrates and SAM analogues. So far, MS, anti-SAH antibody, and multiple enzyme-coupled spectroscopic assays have been applied to trace SAH signal.36–42, 51, 52 In contrast to undesirable capability of the MS-based SAH assay for a HTS analysis and the nonlinear readout of the antibody-based SAH assay,39, 52 multiple enzyme-coupled mix-and-measure spectroscopic assays, as described by our lab and others,37, 41 demonstrated the feasibility for both accurate SAH quantification and HTS readout.
Among enzyme-coupled PMT-activity assays, we focused on two for further comparison because of their high signal sensitivity, decent signal-to-background separation, and ready HTS adaptability. The luminogenic assay relies on three coupling enzymes to process SAH into adenine and then ATP, with the latter quantified by highly-sensitive luciferase assay kit.41 The fluorogenic assay relies on two coupling enzymes to process SAH into Hcy, with the latter quantified by thiol-reactive fluorogenic dyes.37 Both assays have excellent SAH sensitivity and 96-well-microplate HTS adaptability. Although the luminogenic assay displayed 20-fold higher SAH detection threshold in comparison with the previously-reported fluorogenic assay,37, 41 we concluded that the latter is more suitable for a HTS format because of its lower background and thus better signal-to-background separation (Figure 2, about 2 fold higher than the previously-reported luminogenic assay). We reasoned that the high background signal of the luminogenic assay is likely due to non-PMT-mediated decomposition of SAM to 5′-methylthio-adenosine (MTA) and adenine, as reported previously (Figure 1, Pathways d, e).53 In the enzyme-coupled luminogenic assay, since the coupling enzyme MTAN can promiscuously process MTA, SAH and other MTA/SAH analogues to adenine,54, 55 the non-PMT-mediated production of MTA and adenine eventually merge with the PMT-mediated production of SAH (Figure 1, Pathways a) at the step of adenine-to-ATP conversion (Figure 1, Pathways a, c versus Pathways d, e, f). The amount of ATP originated from MTA and adenine is therefore indistinguishable from the ATP for SAH quantification and leads to the high background readout of the luminogenic assay. In contrast to MTAN that is promiscuous for both MTA and SAH,41, 56 the coupling enzyme SAHH in the fluorogenic assay is active on SAH but not MTA. SAH, rather than MTA or adenine, therefore solely accounts for the final signal readout from thiol-reactive fluorogenic dyes (ThioGlo1 or CPM). This rationale, together with the further improved fluorescence output by replacing ThioGlo1 with more sensitive CPM (discussed above), therefore underscores that the fluorogenic assay is superior to the luminogenic assay for a robust, high-throughput SAH quantification. Given that SAM and SAM analogues may go through similar degrading processes (MTA and adenine production),53 the fluorogenic assay is also more suitable than the luminogenic assay to examine activities of PMTs on SAM analogues.
Limitation and general applicability of the current fluorogenic assay
Several cautions should be also made upon applying the fluorogenic assay to probing the activities of PMTs and their variants on SAM analogues. First, the current mix-and-measure assay format is intolerant to reducing reagents such as DTT and β-mercaptoethanol, given their capability to react with the thiol-reactive fluorogenic dye CPM. These reducing reagents may be required for optimal PMT activities, although such situation has not been observed for so-far-examined PMTs and PMT mutants. The free cysteine residues of PMTs could react with CPM, which may account for the altered background readouts (Figure 6). However, this effect would be insignificant as indicated by the desirable high-to-low separations of the examined PMTs. Secondly, several prior enzyme-coupled PMT-activity assays were carried out in the presence of coupling enzymes.37–40, 42 This coupled format was proposed to degrade the byproduct SAH in situ and thus release potential SAH-mediated product inhibition. In contrast, the current fluorogenic assay was reformulated into an uncoupled format by decoupling SAH production from enzyme-coupled Hcy production. Although the accumulated SAH may inhibit the reaction progression to some degree, such inhibitory effect is not dominant for the so-far-examined PMTs and PMT mutants. The lack of SAH-mediated inhibition can be due to the low affinity of SAH or the competition effect of high concentration of SAM (55 μM) to these enzymes. In addition, other SAH-degrading activities may interfere with the assay, as exemplified by the MTAN impurity in E. coli-expressed G9a (Figure 1, Pathway c). SAM analogues can also generate high background due to its spontaneous decomposition to SAH. Non-substrate negative controls and other orthogonal assays for hit validation should therefore be included to minimize the potential false positives and negatives.
SAM is one of the most frequently-used enzyme cofactors.57 As a biological methyl donor, SAM provides its sulfonium methyl group not only to protein targets (e.g. PMTs) but also to DNA, RNA and small-molecule substrates, accompanied by SAH production.41 The current fluorogenic assay via robust SAH quantification can therefore be applied to probing the reactivity of methyltransferase variants on SAM and SAM analogues, or to screen methyltransferase inhibitors. The limitations of the current fluorogenic assay, as described above, should not outweigh its broad application as a methyltransferase-activity assay.
Promiscuous activity of PMTs on SAM analogue cofactors
With the aid of the fluorogenic assay, native SUV39H2, G9a and GLP1 were identified to utilize allyl-SAM as a novel cofactor and efficiently allylate their histone H3K9 substrate. Here PRMT1, PRMT3, CARM1, SET7/9 and SET8 are inert to allyl-SAM. Although the weak activity of 2 μM PRMT1 on allyl-SAM was reported previously,35 such activity became undetectable when 10-fold less PRMT1 (0.2 μM versus 2 μM) was used under the current assay condition. Remarkably, propargyl-SAM, though similar to allyl-SAM on the basis of its size and structure, is inert to SUV39H2, G9a and GLP1. We reasoned that the lack activity of propargyl-SAM is likely due to its rapid degradation, as noticed by us and others.33, 35 Although EnYn-SAM was reported to be active toward another protein lysine methyltransferase (PKMT) SETDB1,34 none of the bulky SAM analogues (EnYn-SAM, Hey-SAM, and Pob-SAM) are active cofactors for the 8 examined PMTs (Figures 8 and 9). Collectively, our screening results showed that only stable, less-bulky SAM analogues can be recognized efficiently by the subfamily of native PMTs.
Polygenic tree analysis shows that PRMT1, PRMT3, CARM1, SET7/9, SET8, SUV39H2, G9a and GLP1 belong to three subfamilies of PMTs: (PRMT1, PRMT3 and CARM1); (SET8, SUV39H2, G9a and GLP1); (SET7/9).1, 46 In terms of structural motifs and enzymatic functions, human PRMT1, PRMT3 and CARM1 resemble classic methyltransferases with several bulky residues (e.g. Y35, F36, Y39, M48 and D51 of PRMT1) closely interacting with the sulfonium methyl group of the SAM cofactor.35 These interactions provide structural rationale that PRMT1, PRMT3 and CARM1 preferentially recognize SAM but not bulky SAM analogues. In comparison, SET7/9, SET8, SUV39H2, G9a and GLP1 belong to a family of distinct SET-domain-containing PKMTs.7, 58, 59 The structures of the family of PMTs reveal a conserved catalytic channel that renders the enzyme catalysis.20, 33, 50, 59–65 The narrow catalytic channel only allows the side chain of lysine to go through and then access the sulfonium methyl group, which is located on the opposite side of the channel. This structural motif may rationalize that only small allyl-SAM can be recognized by a subset of PKMTs and more-sterically-hindered SAM analogues are inert to most of PKMTs. However, replacing the bulky F1152 and Y1154 of G9a with the smaller alanine residue releases the steric interactions and thus renders G9a’s cofactor selectivity toward bulky EnYn-SAM and Hey-SAM.33 The collective structure-activity-relationship therefore indicates that SAM-binding pockets of native PMTs, though show preference to native SAM, can be tailored to accommodate bulky SAM derivatives.
Conclusion
PMT-associated protein methylation has been implicated in multiple biological processes. Developing robust and reliable assays will facilitate HTS characterization of PMTs. Here we formulated a fluorogenic high-through PMT-activity assay and demonstrated its ability to probe the activities of PMTs and their mutants on structurally-diverse SAM analogues. The HTS character of this assay is fully validated with pilot screenings and the independent MS approach. We further demonstrated the robust activities of the G9a Y1154A mutant on EnYn-/Hey-SAM and identified additional novel SAM analogue for SUV39H2, G9a and GLP1. The SAR information obtained here provides the additional guidance to engineer PMTs and matched SAM analogues for more efficient substrate labeling. The impact of the reformulated fluorogenic assay further lies in its broad application to probing activities and screening inhibitors of methyltransferase and SAM variants.
Acknowledgments
We thank Drs. Thompson, Min, Frankel, Trievel and Schramm for various plasmids and the financial supports from the V Foundation for Cancer Research through 2009 V Foundation Scholar Award, NIH through NINDS (1R21NS071520-01), NIGMS (1R01GM096056-01) and the NIH Director’s New Innovator Award Program (1-DP2-OD007335-01), The Starr Foundation, Mr. William H. Goodwin and Mrs. Alice Goodwin the Commonwealth Foundation for Cancer Research and The Experimental Therapeutics Center of Memorial Sloan-Kettering Cancer Center.
References
- 1.Edwards A. Annu Rev Biochem. 2009;78:541–568. doi: 10.1146/annurev.biochem.78.070907.103305. [DOI] [PubMed] [Google Scholar]
- 2.Cole PA. Nat Chem Biol. 2008;4:590–597. doi: 10.1038/nchembio.111. [DOI] [PMC free article] [PubMed] [Google Scholar]
- 3.Smith BC, Denu JM. Biochim Biophys Acta. 2009;1789:45–57. doi: 10.1016/j.bbagrm.2008.06.005. [DOI] [PMC free article] [PubMed] [Google Scholar]
- 4.Bhaumik SR, Smith E, Shilatifard A. Nat Struct Mol Biol. 2007;14:1008–1016. doi: 10.1038/nsmb1337. [DOI] [PubMed] [Google Scholar]
- 5.Nimura K, Ura K, Kaneda Y. J Mol Med. 2010;88:1213–1220. doi: 10.1007/s00109-010-0668-4. [DOI] [PubMed] [Google Scholar]
- 6.Kouzarides T. Cell. 2007;128:693–705. doi: 10.1016/j.cell.2007.02.005. [DOI] [PubMed] [Google Scholar]
- 7.Kouzarides T. Cell. 2007;128:802–803. doi: 10.1016/j.cell.2007.02.018. [DOI] [PubMed] [Google Scholar]
- 8.Bedford MT, Clarke SG. Mol Cell. 2009;33:1–13. doi: 10.1016/j.molcel.2008.12.013. [DOI] [PMC free article] [PubMed] [Google Scholar]
- 9.Bedford MT, Richard S. Mol Cell. 2005;18:263–272. doi: 10.1016/j.molcel.2005.04.003. [DOI] [PubMed] [Google Scholar]
- 10.Lee YH, Stallcup MR. Mol Endocrinol. 2009;23:425–433. doi: 10.1210/me.2008-0380. [DOI] [PMC free article] [PubMed] [Google Scholar]
- 11.Huang J, Berger SL. Curr Opin Genetics Dev. 2008;18:152–158. doi: 10.1016/j.gde.2008.01.012. [DOI] [PubMed] [Google Scholar]
- 12.Chuikov S, Kurash JK, Wilson JR, Xiao B, Justin N, Ivanov GS, McKinney K, Tempst P, Prives C, Gamblin SJ, Barlev NA, Reinberg D. Nature. 2004;432:353–360. doi: 10.1038/nature03117. [DOI] [PubMed] [Google Scholar]
- 13.Munro S, Khaire N, Inche A, Carr S, La Thangue NB. Oncogene. 2010;29:2357–2367. doi: 10.1038/onc.2009.511. [DOI] [PubMed] [Google Scholar]
- 14.Kontaki H, Talianidis I. Molecular Cell. 2010;39:152–160. doi: 10.1016/j.molcel.2010.06.006. [DOI] [PubMed] [Google Scholar]
- 15.Subramanian K, Jia D, Kapoor-Vazirani P, Powell DR, Collins RE, Sharma D, Peng JM, Cheng XD, Vertino PM. Mol Cell. 2008;30:336–347. doi: 10.1016/j.molcel.2008.03.022. [DOI] [PMC free article] [PubMed] [Google Scholar]
- 16.Masatsugu T, Yamamoto K. Biochem Biophys Res Commun. 2009;381:22–26. doi: 10.1016/j.bbrc.2009.01.185. [DOI] [PubMed] [Google Scholar]
- 17.Dhayalan A, Kudithipudi S, Rathert P, Jeltsch A. Chem Biol. 2011;18:111–120. doi: 10.1016/j.chembiol.2010.11.014. [DOI] [PubMed] [Google Scholar]
- 18.Esteve PO, Chin HG, Benner J, Feehery GR, Samaranayake M, Horwitz GA, Jacobsen SE, Pradhan S. Proc Natl Acad Sci USA. 2009;106:5076–5081. doi: 10.1073/pnas.0810362106. [DOI] [PMC free article] [PubMed] [Google Scholar]
- 19.Pagans S, Kauder SE, Kaehlcke K, Sakane N, Schroeder S, Dormeyer W, Trievel RC, Verdin E, Schnolzer M, Ott M. Cell Host Microbe. 2010;7:234–244. doi: 10.1016/j.chom.2010.02.005. [DOI] [PMC free article] [PubMed] [Google Scholar]
- 20.Couture JF, Collazo E, Hauk G, Trievel RC. Nat Struct Mol Biol. 2006;13:140–146. doi: 10.1038/nsmb1045. [DOI] [PubMed] [Google Scholar]
- 21.Kouskouti A, Scheer E, Staub A, Tora L, Talianidis I. Mol Cell. 2004;14:175–182. doi: 10.1016/s1097-2765(04)00182-0. [DOI] [PubMed] [Google Scholar]
- 22.Ea CK, Baltimore D. Proc Acad Natl Sci USA. 2009;106:18972–18977. doi: 10.1073/pnas.0910439106. [DOI] [PMC free article] [PubMed] [Google Scholar]
- 23.Yang XD, Huang B, Li MX, Lamb A, Kelleher NL, Chen LF. EMBO J. 2009;28:1055–1066. doi: 10.1038/emboj.2009.55. [DOI] [PMC free article] [PubMed] [Google Scholar]
- 24.Binda O, LeRoy G, Bua DJ, Garcia BA, Gozani O, Richard S. Epigenetics. 2010;5:767–775. doi: 10.4161/epi.5.8.13278. [DOI] [PMC free article] [PubMed] [Google Scholar]
- 25.Kunizaki M, Hamamoto R, Silva FP, Yamaguchi K, Nagayasu T, Shibuya M, Nakamura Y, Furukawa Y. Cancer Res. 2007;67:10759–10765. doi: 10.1158/0008-5472.CAN-07-1132. [DOI] [PubMed] [Google Scholar]
- 26.Shi XB, Kachirskaia L, Yamaguchi H, West LE, Wen H, Wang EW, Dutta S, Appella E, Gozani O. Mol Cell. 2007;27:636–646. doi: 10.1016/j.molcel.2007.07.012. [DOI] [PMC free article] [PubMed] [Google Scholar]
- 27.Huang J, Dorsey J, Chuikov S, Zhang XY, Jenuwein T, Reinberg D, Berger SL. J Biol Chem. 2010;285:9636–9641. doi: 10.1074/jbc.M109.062588. [DOI] [PMC free article] [PubMed] [Google Scholar]
- 28.Huang J, Perez-Burgos L, Placek BJ, Sengupta R, Richter M, Dorsey JA, Kubicek S, Opravil S, Jenuwein T, Berger SL. Nature. 2006;444:629–632. doi: 10.1038/nature05287. [DOI] [PubMed] [Google Scholar]
- 29.Jansson M, Durant ST, Cho EC, Sheahan S, Edelmann M, Kessler B, La Thangue NB. Nat Cell Biol. 2008;10:1431–1439. doi: 10.1038/ncb1802. [DOI] [PubMed] [Google Scholar]
- 30.Rathert P, Dhayalan A, Ma HM, Jeltsch A. Mol BioSyst. 2008;4:1186–1190. doi: 10.1039/b811673c. [DOI] [PubMed] [Google Scholar]
- 31.Rathert P, Dhayalan A, Murakami M, Zhang X, Tamas R, Jurkowska R, Komatsu Y, Shinkai Y, Cheng XD, Jeltsch A. Nat Chem Biol. 2008;4:344–346. doi: 10.1038/nchembio.88. [DOI] [PMC free article] [PubMed] [Google Scholar]
- 32.Binda O, Boyce M, Rush JS, Palaniappan KK, Bertozzi CR, Gozani O. Chembiochem. 2011;12:330–334. doi: 10.1002/cbic.201000433. [DOI] [PMC free article] [PubMed] [Google Scholar]
- 33.Islam K, Zheng W, Yu H, Deng H, Luo M. ACS Chem Biol. 2011 doi: 10.1021/cb2000567. Epub ahend of print. [DOI] [PMC free article] [PubMed] [Google Scholar]
- 34.Peters W, Willnow S, Duisken M, Kleine H, Macherey T, Duncan KE, Litchfield DW, Luscher B, Weinhold E. Angew Chem Int Ed. 2010;49:5170–5173. doi: 10.1002/anie.201001240. [DOI] [PubMed] [Google Scholar]
- 35.Wang R, Zheng W, Yu H, Deng H, Luo M. J Am Chem Soc. 2011;133:7648–7651. doi: 10.1021/ja2006719. [DOI] [PMC free article] [PubMed] [Google Scholar]
- 36.Capdevila A, Burk RF, Freedman J, Frantzen F, Alfbeim I, Wagner C. J Nutr Biochem. 2007;18:827–831. doi: 10.1016/j.jnutbio.2007.01.003. [DOI] [PMC free article] [PubMed] [Google Scholar]
- 37.Collazo E, Couture JF, Bulfer S, Trievel RC. Anal Biochem. 2005;342:86–92. doi: 10.1016/j.ab.2005.04.007. [DOI] [PubMed] [Google Scholar]
- 38.Dorgan KM, Wooderchak WL, Wynn DP, Karschner EL, Alfaro JF, Cui YQ, Zhou ZS, Hevel JM. Anal Biochem. 2006;350:249–255. doi: 10.1016/j.ab.2006.01.004. [DOI] [PubMed] [Google Scholar]
- 39.Graves TL, Zhang Y, Scott JE. Anal Biochem. 2008;373:296–306. doi: 10.1016/j.ab.2007.09.025. [DOI] [PMC free article] [PubMed] [Google Scholar]
- 40.Hendricks CL, Ross JR, Pichersky E, Noel JP, Zhou ZS. Anal Biochem. 2004;326:100–105. doi: 10.1016/j.ab.2003.11.014. [DOI] [PubMed] [Google Scholar]
- 41.Ibáñez G, McBean JL, Astudillo YM, Luo M. Anal Biochem. 2010;401:203–210. doi: 10.1016/j.ab.2010.03.010. [DOI] [PubMed] [Google Scholar]
- 42.Wang CH, Leffler S, Thompson DH, Hrycyna CA. Biochem Biophys Res Comm. 2005;331:351–356. doi: 10.1016/j.bbrc.2005.03.170. [DOI] [PubMed] [Google Scholar]
- 43.Hemeon I, Gutierrez JA, HMC, SVL Anal Chem. 2011 doi: 10.1021/ac200816m. [DOI] [PMC free article] [PubMed] [Google Scholar]
- 44.Dalhoff C, Lukinavicius G, Klimasauskas S, Weinhold E. Nat Chem Biol. 2006;2:31–32. doi: 10.1038/nchembio754. [DOI] [PubMed] [Google Scholar]
- 45.Lakowski TM, Hart Pt, Ahem CA, Martin NI, Frankel A. ACS Chem Biol. 2010;5:1053–1063. doi: 10.1021/cb100161u. [DOI] [PubMed] [Google Scholar]
- 46.Wu H, Min JR, Lunin VV, Antoshenko T, Dombrovski L, Zeng H, Allali-Hassani A, Campagna-Slater V, Vedadi M, Arrowsmith CH, Plotnikov AN, Schapira M. Plos One. 2010;5:e8570. doi: 10.1371/journal.pone.0008570. [DOI] [PMC free article] [PubMed] [Google Scholar]
- 47.Luo MK, Singh V, Taylor EA, Schramm VL. J Am Chem Soc. 2007;129:8008–8017. doi: 10.1021/ja072122y. [DOI] [PMC free article] [PubMed] [Google Scholar]
- 48.Sturm MB, Schramm VL. Anal Chem. 2009;81:2847–2853. doi: 10.1021/ac8026433. [DOI] [PMC free article] [PubMed] [Google Scholar]
- 49.Trievel RC, Li FY, Marmorstein R. Anal Biochem. 2000;287:319–328. doi: 10.1006/abio.2000.4855. [DOI] [PubMed] [Google Scholar]
- 50.Couture JF, Collazo E, Brunzelle JS, Trievel RC. Genes Dev. 2005;19:1455–1465. doi: 10.1101/gad.1318405. [DOI] [PMC free article] [PubMed] [Google Scholar]
- 51.Lakowski TM, Zurita-Lopez C, Clarke SG, Frankel A. Anal Biochem. 2010;397:1–11. doi: 10.1016/j.ab.2009.09.021. [DOI] [PMC free article] [PubMed] [Google Scholar]
- 52.Lakowski TM, Frankel A. Anal Biochem. 2010;396:158–160. doi: 10.1016/j.ab.2009.08.043. [DOI] [PubMed] [Google Scholar]
- 53.Iwig DF, Booker SJ. Biochemistry. 2004;43:13496–13509. doi: 10.1021/bi048693+. [DOI] [PubMed] [Google Scholar]
- 54.Gutierrez JA, Luo M, Singh V, Li L, Brown RL, Norris GE, Evans GB, Furneaux RH, Tyler PC, Painter GF, Lenz DH, Schramm VL. ACS Chem Biol. 2007;2:725–734. doi: 10.1021/cb700166z. [DOI] [PubMed] [Google Scholar]
- 55.Singh V, Luo M, Brown RL, Norris GE, Schramm VL. J Am Chem Soc. 2007;129:13831–13833. doi: 10.1021/ja0754204. [DOI] [PMC free article] [PubMed] [Google Scholar]
- 56.Luo M, Schramm VL. J Am Chem Soc. 2008;130:11617–11619. doi: 10.1021/ja804578m. [DOI] [PMC free article] [PubMed] [Google Scholar]
- 57.Markham GD, Pajares MA. Cell Mol Life Sci. 2009;66:636–648. doi: 10.1007/s00018-008-8516-1. [DOI] [PMC free article] [PubMed] [Google Scholar]
- 58.Qian C, Zhou MM. Cell Mol Life Sci. 2006;63:2755–2763. doi: 10.1007/s00018-006-6274-5. [DOI] [PMC free article] [PubMed] [Google Scholar]
- 59.Cheng XD, Collins RE, Zhang X. Annu Rev Biophys Biomol Struct. 2005;34:267–294. doi: 10.1146/annurev.biophys.34.040204.144452. [DOI] [PMC free article] [PubMed] [Google Scholar]
- 60.Couture JF, Dirk LMA, Brunzelle JS, Houtz RL, Trievel RC. Proc Natl Acad Sci USA. 2008;105:20659–20664. doi: 10.1073/pnas.0806712105. [DOI] [PMC free article] [PubMed] [Google Scholar]
- 61.Del Rizzo PA, Couture JF, Dirk LMA, Strunk BS, Roiko MS, Brunzelle JS, Houtz RL, Trievel RC. J Biol Chem. 2010;285:31849–31858. doi: 10.1074/jbc.M110.114587. [DOI] [PMC free article] [PubMed] [Google Scholar]
- 62.Horowitz S, Yesselman JD, Al-Hashimi HM, Trievel RC. J Biol Chem. 2011;286:18658–18663. doi: 10.1074/jbc.M111.232876. [DOI] [PMC free article] [PubMed] [Google Scholar]
- 63.Krishnan S, Horowitz S, Trievel RC. Chembiochem. 2011;12:254–263. doi: 10.1002/cbic.201000545. [DOI] [PubMed] [Google Scholar]
- 64.Marmorstein R, Trievel RC. Biochim Biophys Acta. 2009;1789:58–68. doi: 10.1016/j.bbagrm.2008.07.009. [DOI] [PMC free article] [PubMed] [Google Scholar]
- 65.Trievel RC, Beach BM, Dirk LMA, Houtz RL, Hurley JH. Cell. 2002;111:91–103. doi: 10.1016/s0092-8674(02)01000-0. [DOI] [PubMed] [Google Scholar]


