

Summary
An adaptive variant of the human Ectodysplasin receptor, EDARV370A, is one of the strongest candidates of recent positive selection from genome-wide scans. We have modeled EDAR370A in mice and characterized its phenotype and evolutionary origins in humans. Our computational analysis suggests the allele arose in Central China approximately 30,000 years ago. Although EDAR370A has been associated with increased scalp hair thickness and changed tooth morphology in humans, its direct biological significance and potential adaptive role remain unclear. We generated a knock-in mouse model and find that, as in humans, hair thickness is increased in EDAR370A mice. We identify novel biological targets affected by the mutation, including mammary and eccrine glands. Building on these results, we find that EDAR370A is associated with an increased number of active eccrine glands in the Han Chinese. This interdisciplinary approach yields unique insight into the generation of adaptive variation among modern humans.
Introduction
Humans are unique among primates in having colonized nearly every corner of the world; consequently, niche-specific selective pressures likely helped shape the phenotypic variation currently evident in Homo sapiens. Identifying the genetic variants that underlie regional adaptations is thus central to understanding present-day human diversity, yet only a few adaptive traits have been elucidated. These include mutations in the Hemoglobin-B and Duffy antigen genes, driving resistance to P. falciparum and P. vivax malaria, respectively (Kwiatkowski, 2005); mutations in lactase allowing some adult humans to digest milk following the domestication of milk-producing livestock (Enattah et al., 2002); and mutations in SLC24A5 and other genes driving variation in skin pigmentation (Lamason et al., 2005).
Although breakthroughs in genomic technology have facilitated the identification of hundreds of candidate genetic variants with evidence of recent positive natural selection, validation and characterization of putative genetic adaptations requires functional evidence linking genotypes to phenotypes that could affect an organism’s fitness (Akey, 2009). This is made difficult by experimental challenges in isolating the phenotypic effects of candidate loci and by methodological limitations on the phenotypes that can be readily assessed in humans. Accordingly, the best-characterized human adaptive alleles are typically those whose phenotypic outcomes are easily measured and strongly related to known genetic variation, such as lactase persistence or skin pigmentation. Many genes, however, have unknown or pleiotropic effects, making their adaptive advantage difficult to uncover (Sivakumaran et al., 2011). A promising alternative to tackle these difficulties is to study the effects of candidate adaptive alleles in animal models. Although such models, particularly using mice, have been used extensively to study human disease alleles, they have not been used to model the subtle phenotypic changes expected to result from human adaptive variation.
A compelling candidate human adaptive allele to emerge from genome-wide scans is a derived coding variant of the Ectodysplasin A (EDA) receptor (EDAR), EDARV370A (370A) (Sabeti et al., 2007; Grossman et al., 2010). Computational fine-mapping of the selection signal and the restricted occurrence of 370A in East Asian and Native American populations have led to suggestions that 370A was selected in Asia (Bryk et al., 2008). In support of this hypothesis, 370A was shown to associate with increased scalp hair thickness and incisor tooth shoveling in multiple East Asian populations (Fujimoto et al., 2008a, 2008b; Kimura et al., 2009; Park et al., 2012). However, because association studies quantify correlation rather than causation, it remains to be ascertained whether 370A is the genetic change driving the observed phenotypes.
The biochemical properties of 370A support the possibility that the variant directly causes the associated phenotypes. Structural models predict that V370A lies in the EDAR Death Domain (DD) required for interaction with the downstream signal transducer EDARADD(Sabeti et al., 2007). Moreover, overexpression of 370A has been reported to up-regulate downstream NFκB signaling in vitro relative to 370V (Bryk et al., 2008; Mou et al., 2008). This finding suggested that a pre-existing mouse model, in which the ancestral 370V allele is overexpressed, might provide insight into 370A’s phenotypic consequences (Headon and Overbeek, 1999; Mou et al., 2008). Indeed, transgenic mice expressing multiple copies of 370V have thicker hair shafts as seen in humans with the 370A allele (Fujimoto et al., 2008a, 2008b; Mou et al., 2008). In addition, these animals exhibit increased mammary gland branching, enlarged mammary glands and hyperplastic sebaceous and Meibomian glands that secrete hydrophobic films as a barrier to water loss in the skin and eyes, respectively (Chang et al., 2009). These latter phenotypes led to the proposal that the 370A variant may have been selected in response to cold and arid environmental conditions (Chang et al., 2009).
Evaluating which forces may have contributed to the spread of 370A requires knowledge of both the environmental context in which this variant was selected and its phenotypic effects. We therefore employed a multi-disciplinary approach to test the role of 370A in recent human evolution. This included modeling to reconstruct the evolutionary history of 370A, and a knock-in mouse model to examine its direct phenotypic consequences. Analysis of the mouse knock-in revealed phenotypes not previously reported in human genetic studies, which we further characterized in a Han Chinese cohort. This work highlights the utility of modeling non-pathological human genetic variation in mice, providing a framework for assessing other candidate adaptive human alleles.
Results
Single Origin of 370A in Central China
Using both newly generated and publicly available data, we examined 280 SNPs flanking the 370A SNP in 51 worldwide populations in order to assess the origin of 370A. Haplotype analysis supports a single origin of the derived allele (Figure 1A), with the mutation lying on a unique, nearly unbroken haplotype extending more than 100 kb among both East Asians and Native Americans (Figure S1).
Figure 1. Origins of 370A.
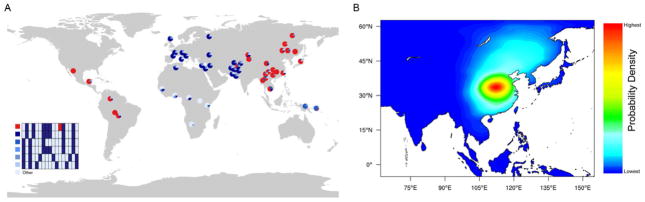
(A) Haplotype distribution of the genomic region surrounding V370A, based on 24 SNPs covering ~139 kb. The six most common haplotypes are shown, and the remaining low frequency haplotypes grouped as “Others”. The chimpanzee allele was assumed to be ancestral. Derived alleles are in black, except for the 370A variant which is red. (B) The approximate posterior probability density for the geographic origin of 370A obtained by ABC simulation. The heat map was generated using 2D kernel density estimation of the latitude and longitude coordinates from the top 5,000 (0.46%) of 1,083,966 simulations. Red color represents the highest probability, and blue the lowest. See also Figures S1–5, S7 and Tables S1–S4.
To estimate the allele’s geographic and temporal origin, we performed more than one million spatially explicit demic forward simulations modeling the appearance and spread of 370A in Asia (Itan et al., 2009) (Supplemental Information S1). We used approximate Bayesian computation (ABC) (Beaumont et al., 2002) to compare simulated to observed allele frequencies and to estimate key evolutionary and demographic parameters (Fagundes et al., 2007; Itan et al., 2009; Ray et al., 2010). This analysis estimated the 370A allele originated in central China (Figure 1B) between 13,175 and 39,575 years BP (95% confidence interval (CI)), with a mode of 35,300 years BP and a median of 30,925 years BP. The estimated selection coefficient has a 95% CI between 0.030 and 0.186, with a mode of 0.122, and a median of 0.114 (Figures S2–4, Table S1–S4, and Supplemental Information S1).
As a separate calculation of the age of 370A, we performed a maximum likelihood inference analysis using the allele frequency spectrum of 1,677 nearby SNPs in present day Han Chinese (Supplemental Information S2) (Chen, 2012). This method provided similar estimates of the allele age (95% CI: 34,775–38,208 years BP; maximum likelihood estimation (MLE): 36,490 years BP,) and selection intensity (95% CI: 0.0657–0.0831; MLE: 0.0744; Figure S5).
Generation of 370A mouse model
To test the biological consequence of 370A, we evaluated its sufficiency to drive a phenotypic change in vivo. In humans and mice, loss of function mutations in the genes coding for the ligand EDA-A1, EDAR and EDARADD lead to strikingly similar phenotypes characterized by defective hair development, absence of eccrine glands and missing or misshapen teeth (Mikkola, 2008, 2011; Cluzeau et al., 2011). The conserved role of the Ectodysplasin pathway in the development of ectodermally derived organs (Grüneberg, 1971; Kondo et al., 2001; Colosimo et al., 2005; Mikkola, 2008, 2011) suggested that a 370A mouse knock-in model would be an accurate system in which to isolate and examine the effects of the derived allele.
The DDs of mouse and human EDAR are identical in sequence, with mice natively expressing the 370V allele (Figure 2A). To construct 370A knock-in mice, we used homologous recombination in embryonic stem cells to introduce the T1326C point mutation into the endogenous murine Edar locus resulting in V370A substitution in the encoded protein (Figures 2B, S6). 370A mice were born at expected Mendelian ratios, appeared healthy, and did not exhibit altered fertility or longevity compared to wildtype littermates (Figure 2C and data not shown).
Figure 2. Generation of the 370A mouse.
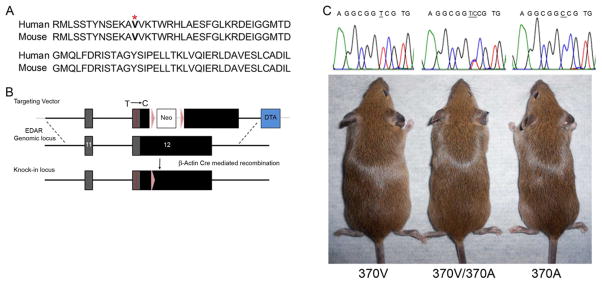
(A) Conservation of human and mouse EDAR DD. 370V is in bold with superscript asterisk. (B) Targeting strategy for the introduction of the 370A mutation into the mouse Edar locus. The construct spans part of the Edar genomic sequence including exons 11 and 12 and contains the T1326C mutation (red line). The targeting vector also contained a neomycin (Neo) resistance cassette flanked by LoxP sites (purple arrows) inserted into the EDAR 3′ untranslated region (UTR). Neo was excised by breeding to a ubiquitously expressing β-Actin Cre line. The final genomic structure of the Edar knock-in locus is shown with exons as boxes, coding sequence in dark grey, UTR in black and all other genomic sequence as a black line. Diphtheria toxin A selection cassette (DTA) is shown in blue and vector sequence in light grey. (C) Appearance of 370V, 370V/370A and 370A animals and confirmation of the T1326C (underlined) substitution. See also Figure S6.
370A increases hair thickness in mice
In humans, 370A is associated with increased scalp hair thickness (Fujimoto et al., 2008a, 2008b). Mice that over-express the 370V allele also have thicker hairs, but the larger magnitude of this change and concomitant rough coat phenotype suggest this model has limited utility (Mou et al., 2008). In contrast 370A knock-in mice exhibit a smooth hair coat with all four hair types that are normally found in the mouse pelage (Sundberg, 1994; Mikkola, 2011) (Figure 2C and data not shown). We evaluated the sizes of both the awl and auchene hair types in the mouse coat by scoring medulla cell number across the hair shafts (Sundberg, 1994; Enshell-Seijffers et al., 2010) (Figure 3A). Our analysis revealed that Edar genotype was significantly associated with hair size (MANOVA, P=0.034 and P=0.027 for awl and auchene hairs respectively, Table S5). 370A homozygous mutant mice had more of the thickest, four cell awl hairs and fewer three cell hairs than 370V homozygotes (P=0.007 and P=0.005 for four and three cell hairs respectively) (Figure 3B, Table S5). Similarly, 370A homozygotes had a higher proportion of thicker auchenes than 370V and 370V/370A animals (P=0.007 and P=0.007, respectively, Table S5 and Figure 3C). The 370A mouse thus recapitulates the associated human phenotype of increased hair thickness, confirming that the mutation is causal, and demonstrating the model’s utility for accurately characterizing the allele’s biological effects.
Figure 3. 370A allele increases hair size in the mouse coat.

(A) Representative images of mouse hairs show medulla cell number serves as a proxy for hair shaft thickness. (B,C) 370A mice have a larger proportion of thicker hairs than mice expressing the ancestral allele. The average frequency (± SEM) of awl (B) and auchene (C) hairs of each size is shown. Significance levels of differences between 370V and 370A animals by ANOVA posthoc tests: [P < 0.05(*), P < 0.01(**)]. See also Table S5.
370A does not increase Meibomian gland size
A previous study over-expressing 370V in mice found an increase in Meibomian gland size, leading to speculation on the adaptive benefit of 370A (Chang et al., 2009). To evaluate the effect of 370A on Meibomian gland size, we measured the total gland area of the upper and lower eyelids of 370V, 370V/370A and 370A mice. No significant difference in gland area was observed between the different genotypes (MANOVA P=0.244; Figure 4; Table S5). Similarly, we found no detectable change in the size of the related sebaceous glands of the skin (data not shown).
Figure 4. 370A does not increase Meibomian gland size.

Representative images from 370V (A), 370V/370A (B) and 370A (C) mouse eyelids. Superorbital (white arrow) and suborbital (red arrow) Meibomian glands are visible through the connective tissue. (D) Average glandular area is shown (±SEM). Differences between genotypes did not reach statistical significance. See also Table S5.
Mammary gland branching and fat-pad size are altered in 370A mice
The mammary gland and surrounding stromal tissue, the mammary fat pad, are of interest given their importance in reproduction (Neville et al., 1998; Lefèvre et al., 2010). A role for Ectodysplasin signaling in mammary gland development is suggested by loss of function mutants in which glands are present and functional, but gland branching and size of the mammary tree are reduced (Chang et al., 2009; Mikkola, 2011; Voutilainen et al., 2012). In contrast, overexpression of Edar and its ligand Eda-A1 lead to the converse phenotypes (Chang et al., 2009; Voutilainen et al., 2012).
We assessed five aspects of the 4th and 9th mammary glands in pre-estrus mice: branch number, branch density, gland length, gland area and mammary fat pad area. Only branch density and mammary fat pad size were affected by the 370A genotype (MANOVA, univariate main effects: P=0.044 and P=0.018, respectively, Figure 5 and Table S5). 370A homozygotes had higher branch density than either 370V or 370V/370A mice (P=0.018 and P=0.047, respectively, Figure 5E), and smaller fat pads (P=0.007 and P=0.030, respectively, Figure 5F). Although, body weight was not affected by Edar genotype (ANOVA, P=0.459), linear regression revealed a small effect of body weight on gland and fat pad size (Supplemental Information S3). To control for this effect we reanalyzed the effect of Edar genotype on these traits using body weight as a covariate. In this analysis, fat pad area was still significantly affected by genotype (ANCOVA, P=0.045) whereas gland area was significantly affected by body weight but not by genotype (Supplemental Information S3).
Figure 5. 370A reduces the size of the mammary fat pad and increases mammary gland branch density.

(A–D) Whole mount preparations of stained mammary glands. (A) Gland area (dotted line) and fat pad area (dashed line) are quantified from the main lactiferous duct (arrow head). Representative images are shown of 370V (B), 370V/370A (C) and 370A (D). Average branch density (± SEM) (E) and mean fat pad area (±SEM) (F) are shown. Significance levels by ANOVA posthoc tests: [P < 0.05(*), P < 0.01(**), P < 0.001(***)]. See also Table S5.
370A increases eccrine gland number in mice
Eccrine sweat glands in humans are widespread throughout the skin, reflecting their critical role in heat dissipation, but in mice and most other mammals, they are restricted to the plantar surfaces where they serve in traction. In spite of this difference, loss of function mutants have demonstrated the conserved role of Ectodysplasin signaling in eccrine gland formation across mammals (Grüneberg, 1971; Mikkola, 2011). Since eccrine glands are absent in Edar loss of function mutants, we evaluated the effect of 370A on eccrine gland number in our mouse model.
We scored eccrine gland number in four of the six hindlimb footpads (Figure 6A–F). Edar genotype was significantly associated with eccrine gland number in all footpads (MANOVA, P=4.3E-07, see Supplemental Information S3, Table S5). 370A homozygous animals had more sweat glands per footpad than wildtype 370V homozygotes (P< 0.01 for all footpads, Figure 6G), and in most footpads 370V/370A heterozygotes showed an intermediate increase (P< 0.01 for footpads FP-3, FP-4, FP-5, Figure 6G).
Figure 6. 370A increases the number of eccrine sweat glands in mice.

Representative whole-mount preparations of the volar hindfoot skin of 370V (A), 370V/370A (B) and 370A (C) mice. Gland ducts appear as thin blue tubes emerging from inside the footpads (FP). Detail view of FP-3 from 370V (D), 370V/370A (E) and 370A (F) mice. (G) Quantification of average gland number per FP (±SEM) across the three genotypes. (H) 370A rescues the decrease in eccrine gland number in 379K heterozygous mutant mice. Average gland number per FP is shown (±SEM). Significance of differences by ANOVA posthoc tests: [P < 0.05(*), P < 0.01(**), P < 0.001(***)]. All experiments were carried out on fifth generation FVB backcross animals, but those shown in Figure 6H were a FVB by C3HeB/FeJ outcross. The difference in genetic background accounts for the difference in eccrine gland number between wildtype animals in 6G and 6H. See also Table S5.
Since a single copy of 370A was sufficient to increase eccrine gland number in our model, we directly tested if 370A is a gain of function allele by analyzing its ability to rescue the eccrine gland phenotype of mice heterozygous for the downless (dlj, E379K) Edar loss of function mutation (Headon and Overbeek, 1999). 379K is classically considered a recessive mutation, and animals heterozygous for the 379K allele are described as wildtype (Headon and Overbeek, 1999). However, our quantitative method for scoring eccrine glands revealed a subtle decrease in eccrine gland number in 379E/379K heterozygotes (MANOVA posthoc tests, P=0.002, Figure 6H). In agreement with a gain of function model, 370A/379K heterozygous animals had more eccrine glands than 370V/379K animals (P< 0.05 for all footpads, Figure 6H and Table S5).
370A is associated with more eccrine glands and other pleiotropic effects in humans
The change in eccrine gland number we observed in the 370A mouse has important implications for the distribution of variation in this trait in human populations. However, association studies of sweat gland density with non-pathological variation at the EDAR locus have not been reported in humans.
To examine if 370A is associated with altered eccrine gland number in humans, we carried out an association study in individuals of Han descent from an established cohort in Taizhou, China (Wang et al., 2009). To sample a sufficient number of the rare 370V alleles, we first genotyped the 370A SNP and found 2,226 370A homozygotes, 340 370V/370A heterozygotes, and six 370V homozygotes. We then contacted all individuals with at least one copy of the 370V allele, and enrolled 187 of them (184 370V/370A and three 370V), along with 436 370A individuals and collected phenotypes related to ectodermal appendages (Table S6 and Supplemental Information S4). Since only three individuals were homozygous for the 370V allele, we focused on individuals homozygous and heterozygous for 370A in statistical analysis of the collected data.
Consistent with previous reports (Kimura et al., 2009; Park et al., 2012), 370A was associated with single and double shoveling of the upper incisors (Wald test, P=0.0077 and P=0.0004, respectively; Table S6). Additionally, 370A was significantly associated with the presence of a protostylid cusp and the absence of lower third molars (Wald test, P=0.0079 and P=0.0123, respectively; Supplemental Information S4 and Table S6).
We tested for an association between 370A and eccrine sweat gland number using the starch-iodine method to measure the number of activated glands in digit pads of the thumb and index finger (Juniper et al., 1964; Randall, 1964). In agreement with our mouse findings, 370A homozygous individuals had significantly more active eccrine glands than 370V/370A individuals (two-tailed t-test, P =0.011, Figure 7). Testing all three genotypes using linear-regression in an additive model revealed a strong association between 370A and eccrine gland density (Wald test, P=0.0047; Table S6). This association remained significant when we controlled for age, sex, and potential population substructure (Supplemental Information S4 and Table S6).
Figure 7. 370A is associated with increased eccrine sweat gland density in humans.

(A, B) Representative cropped active sweat gland images of the digit tips of a 370V/370A heterozygous (A) and a 370A homozygous (B) individual. Cropped size is ~1.30 cm2. (C) Active sweat gland density is significantly increased in 370A individuals. See also Table S6.
Discussion
This study integrated population genetic analyses, a humanized mouse model and human association study to characterize a natural human gene variant. Combining these approaches allowed us, for the first time, to determine the direct biological effects of 370A and cast new light on their evolutionary consequences. Extending this strategy to other candidate adaptive alleles stands to advance our understanding of the effects of recent selection on the diversification of modern humans.
Modeling human adaptive variation in mice
The laboratory mouse is an established tool for understanding pathological variants in the human genome (Cox and Brown, 2003). Recent work on an adaptive variant of the FoxP2 gene showed that a mouse model can also enable functional examination of non-pathological, hominin-specific alleles (Enard et al., 2009). To our knowledge, our study is the first to demonstrate that mice can be used to model the phenotypic effects of adaptive variation within Homo sapiens, rather than between humans and other species. There are several advantages to this approach. First, the existence of inbred mouse strains allows phenotypes to be evaluated on a genetically homogeneous background, making it possible to isolate the effects of a variant and draw conclusions about the causal effect of a genetic change. In the current case, the 370A knock-in mouse shows that the derived mutation is sufficient to alter multiple traits in vivo. Second, the tractability of an animal model allows us to easily explore novel traits, e.g. eccrine gland number, and ones that are not readily assayed in humans, e.g. mammary gland structure. The results from mouse models can thus serve to inform human association studies pursuing the identification of traits sensitive to candidate adaptive alleles.
Successfully modeling human adaptive alleles in mice relies on the conservation of target organ form and function between the two species. There are clear limitations to this approach. For example, in this study, the absence of murine dental features homologous to the phenotypes observed in humans, such as incisor shoveling or the presence of protostylid cusps, makes it difficult to equate any changes in 370A mouse dental morphology to a specific human dental trait- and in fact we observed no gross phenotypic changes in the dentition of 370A animals. Despite such caveats, when direct homology exists, modeling an allele’s effects in vivo has the advantage of enabling assessment of phenotypic impact on a whole organism level which requires no a priori knowledge of biological targets. This is especially useful for studying allelic variants of genes with unknown or pleiotropic functions.
An ancient Asian origin for 370A
Spatially explicit simulation, haplotype and maximum likelihood analyses suggest that 370A originated once in central Chinamore than 30,000 years BP with a selective coefficient that is one of the highest measured in human populations. Our results are consistent with previous inferences that 370A must have arisen prior to 15,000 BP (Bryk et al., 2008; Peter et al., 2012) and the first peopling of the Americas (Goebel et al., 2008; O’Rourke and Raff, 2010), but also suggest that the allele likely emerged in East Asia even earlier. It should be noted that haplotype-based methods, such as that used by Bryk and colleagues (2008) assume recombination occurs between distinct haplotypes. However, in a case of rapid local fixation, as is likely for a strongly selected and semi-dominant like 370A allele, recombination of the selected haplotype with itself would be masked, reducing the observed number of recombinations and leading to underestimation of the time of origin (Figure S7). Thus, our findings shift the context in which to consider the selective forces that could have acted on 370A.
Phenotypic consequences of 370A
A comparison of mice harboring the 370V and 370A alleles on the same genetic background revealed multiple differences, including increased hair thickness, increased eccrine gland number, reduced mammary fat pad size and increased mammary gland branch density in mice carrying 370A. With the exception of mammary fat pad size, which has not been analyzed in gain of function models, these phenotypes are expected if 370A confers modestly enhanced signaling activity on EDAR. This mode of action was previously proposed based on the observation that 370A can potentiate NFκB signaling in vitro (Bryk et al., 2008; Mou et al., 2008) and a clinical case report in which 370A was associated with reduced severity of Hypohidrotic Ectodermal Dysplasia caused by an EDA missense mutation (Cluzeau et al., 2012). The hair phenotype of 370A animals is consistent with this model, as is the increase in eccrine gland number and mammary gland branching. We demonstrated this in vivo for the eccrine gland trait by showing 370A rescued the reduction in eccrine gland number of dlj heterozygotes. The finding that 370A mice have reduced fat pads reveals a hereto unappreciated role for Ectodysplasin signaling in regulating the formation not only of the mammary gland, in which EDAR is expressed (Pispa et al., 2003), but also of the surrounding mesenchymal support tissue.
The differences between the 370A knock-in mouse phenotypes and those of loss and gain of function models emphasize the advantage of a more accurate mouse model. A dramatic change in hair size and shape and a disordered hair coat are observed when Ectodysplasin signaling is strongly augmented in Edar transgenic mice carrying multiple copies of the wildtype Edar gene (Mou et al., 2008) or in K14-Eda-A1 transgenic mice (Cui et al., 2003; Mustonen et al., 2003). In contrast, the changes directly attributable to the 370A allele are in the same direction, but a smooth hair coat with subtle changes in hair size is observed.
Several of the other phenotypes observed in stronger gain of function models are not detected in 370A mice. In particular, 370A is not sufficient to cause a significant change in either Meibomian or mammary gland size. Our results suggest the magnitude of the effects exerted by the 370A allele are more modest than those modeled to date, and that a different subset of ectodermal appendages may be preferentially sensitive to this level of change in Ectodysplasin signaling. This inference shifts the discussion of potential adaptive consequences of 370A towards other ectodermal appendages, which were affected in our model. This highlights the importance of employing as close a genetic mouse model as possible as a proxy for studying human genetic variation.
Pleiotropic effects and potential selective forces favoring the 370A allele
Our study provides evidence that 370A was selected in East Asia, but the question remains of which of its observed pleiotropic phenotypes were adaptations and which were exaptations. One possibility is that selection favored individuals with an increased number of eccrine glands. A high density of eccrine glands is a key hominin adaptation that enables efficient evapotraspiration during vigorous activities such as long distance walking and running (Carrier et al., 1984; Bramble and Lieberman, 2004). An increased density of eccrine glands in 370A carriers might have been advantageous for East Asian hunter-gatherers during warm and humid seasons, which hinder evapotranspiration.
Geological records indicate that China was relatively warm and humid between 40,000 and 32,000 years ago, but between 32,000 and 15,000 years ago the climate became cooler and drier before warming again at the onset of the Holocene (Wang et al., 2001; Yuan et al., 2004). Throughout this time period, however, China may have remained relatively humid due to varying contribution from summer and winter monsoons (Sun et al., 2012). High humidity, especially in the summers, may have provided a seasonally selective advantage for individuals better able to functionally activate more eccrine glands and thus sweat more effectively (Kuno, 1956). To explore this hypothesis, greater precision on when and where the allele was under selection – perhaps using ancient DNA sources – in conjunction with more detailed archaeological and climatic data.
Alternatively, another phenotype, such as mammary gland branching or fat pad size could have been adaptive. The increased branching of 370A mouse mammary glands and the importance of mammary tissue in evolutionary fitness (Anderson et al., 1983; Oftedal, 2002) make this organ an interesting candidate. Alterations in gland structure have been reported to disrupt lactation in mice (Ramanathan et al., 2007), suggesting a functional consequence for this change. Unfortunately, it is not possible to assess mammary gland branching in living humans, highlighting the importance of animal models. Reports of smaller breast size in East Asian women (Maskarinec et al., 2001; Chen et al., 2004) are notable in light of the effects of 370A on fat pad size and the importance of breast morphology in human mate preference (Furnham et al., 1998, 2006; Dixson et al., 2010). Further analysis of the functional implications of 370A in the mouse and development of methods to assay these phenotypes in humans are critical to evaluate such hypotheses and also to analyze additional potential 370A phenotypes yet to be investigated, such as those linked to differential susceptibility to respiratory disease (Clarke et al., 1987; Mauldin et al., 2009).
In light of 370A’s pleiotropy, it is possible that selection acted on multiple traits. The tendency to seek a single driving character is underlain by the perception that pleiotropic changes are inherently disadvantageous. Evolution is believed to proceed primarily through mutations in gene regulatory regions rather than exons because this reduces pleiotropic effects (King and Wilson, 1975; Stern, 2000; Carroll, 2008). From the perspective of this model, a specific effect of 370A’s pleiotropic consequences was favored under the conditions present in East Asia and conferred an advantage with other neutral or deleterious traits hitchhiking along with the selected trait. However, the large coefficient of selection on 370A contrasts with the relatively modest magnitude of structural changes on any one affected trait and suggests alternative interpretations. One possibility is that the effects of 370A were magnified by co-selection on another variant. For example, a coding variant of the related EDA2R gene affects human hair and has swept to fixation in East Asia (Sabeti et al., 2007; Prodi et al., 2008).
Alternatively, it could be precisely the pleiotropic nature of 370A that allowed multiple distinct selective forces to act on this variant over its long history, when many of the postulated selective pressures such as temperature and humidity changed dramatically. The fact that EDAR acts mostly on ectodermal appendages and that the phenotypic effects of the 370A allele are not extreme reduces the costs of pleiotropy and would facilitate this process. Thus, what were initially neutral changes in some appendages driven by 370A would gain adaptive significance in the face of new selective pressures. It is worth noting that largely invisible structural changes resulting from the 370A allele that might confer functional advantage, such as increased eccrine gland number, are directly linked to visually obvious traits such as hair phenotypes and breast size. This creates conditions in which biases in mate preference could rapidly evolve and reinforce more direct competitive advantages. Consequently, the cumulative selective force acting over time on diverse traits caused by a single pleiotropic mutation could have driven 370A to fixation.
Experimental Procedures
Haplotype analysis
DNA from 1064 individuals from 52 global populations was acquired from the Human Genome Diversity Panel (HGDP-CEPH) (Cann et al., 2002). We used Sequenom MassARRAY iPLEX Gold to genotype 48 SNPs in a 0.83 cM (~1,400 kb) region surrounding the 370A allele and combined our data with published HGDP-CEPH data (Jakobsson et al., 2008; Li et al., 2008). After excluding monomorphic SNPs and SNPs with inconsistent genotypes, we obtained a final dataset of 280 SNPs in 984 samples (1968 chromosomes) from 51 populations. We inferred haplotype data by phasing with fastPHASE (Scheet and Stephens, 2006). Examination of linkage disequilibrium patterns in the region revealed a ~139 kb block surrounding 370A (Figure S1). We counted the number of chromosomes of each haplotype in each population and plotted the frequencies on a world map.
Forward simulation
The spatially explicit model takes into account evolutionary processes such as population structure, drift and natural selection (Itan et al., 2009), implemented here for a semi-dominant allele. The model also considers various demographic processes including population growth, sporadic long-range migration, cultural diffusion of farming technology, gene flow between demes and between cultural groups, and the effects of the spread of farming on carrying capacities (see Supplementary Information S1 and Figure S2 for details).
Approximate Bayesian Computation
We applied an ABC inference framework to estimate parameters of interest (Bertorelle et al., 2010; Csilléry et al., 2010). We compared summary statistics (370A allele frequency in 29 populations) recorded after each simulation to observed frequencies (Table S1), and accepted only those simulations in which the differences were sufficiently small. We calculated the Euclidean distance (δ) between the simulated and observed statistics for each simulated data set and retained those with the smallest values. Parameter sets were obtained according to the associated δ. See Supplemental Information S1 for details on posterior density and choice of simulation cut-off.
Mouse strains
To construct mice carrying the 370A allele, a targeting vector containing the T1326C point mutation was injected into J1 ES cells (Brigham and Women’s Hospital Transgenic Mouse Facility, Boston USA). Chimeric mice that transmitted the knock-in allele to the germline were recovered from a correctly targeted clone after injection into C57BL/6 blastocysts. The chimera was bred to a ubiquitously expressing β-Actin Cre line (gift from Susan Dymecki, Medical School, Boston USA). Mice were subsequently bred onto an FVB (Charles River Laboratories) background for five generations, by which the Cre transgene was also removed (See Supplemental Information S3 for details of knock-in construction). We obtained dlj mice on a C3HeB/FeJ background from Jackson Laboratories and crossed them onto an FVB background for one generation. Mouse work was performed in accordance with protocols approved by the Harvard Medical Area Standing Committee on Animals.
Mouse hair size
Hair from the back of P19–P21 pups was mounted on slides in Gelvatol and analyzed on a Nikon eclipse E1000 microscope to score medulla cells. A minimum of 700 hairs were scored from each mouse. 370V (N=12), 370V/370A (N=11), and 370A (N=13) animals were analyzed.
Meibomian Glands
Meibomian gland preparations were made from the left eyelids of six week old mice. Eyelids were fixed flat on Whatman paper in 4% Paraformaldehyde (Thermo Fisher), and photographed on a Leica MZFLIII stereomicroscope equipped with a Nikon DXM1200F camera. Total glandular area was measured from images using ImageJ (v.1.46, (Schneider et al., 2012)). 370V (N=13), 370V/370A (N=25), and 370A (N=20) animals were analyzed.
Mammary Glands
The 4th and 9th inguinal mammary glands and associated fat pads were dissected from six week old, virgin female mice. Whole mount preparations of mammary glands and staining of the ductal tree were performed as described (http://mammary.nih.gov/tools/histological/Histology/index.html#a1). Mammary glands were fixed flat in Carnoy’s fix then stained with carmine alum (Sigma Aldrich). Stained glands were dehydrated into Xylenes (Thermo Fisher), mounted flat and photographed on a Leica MZFLIII stereomicroscope equipped with a Nikon DXM1200F camera. Several high resolution images of each gland were merged for analysis in Photoshop (Adobe Systems Inc.).
Image analysis was performed with ImageJ. Fat pad area and glandular area were measured from the main lactiferous duct to the dorsolateral edge of the gland. Gland length was measured between the distal-most ductal termini at either end of the gland. Total branch number was assessed by counting all ductal termini per gland using the ImageJ Cell Counter plug-in. Branch density was calculated by dividing total branch number by gland length. Left and right glands of each animal were averaged together. 370V (N=10), 370V/370A (N=19), and 370A (N=11) animals were assessed.
Mouse eccrine glands
Epidermal whole-mount preparations were prepared by dissecting the volar skin from both hindfeet and incubating in Dispase II (Roche) as described previously (Okada et al., 1983). Next, the epidermis was peeled away from the underlying dermis. Eccrine gland ducts remained associated with the epidermis and were stained with a 0.1% solution of Nile Blue A (Sigma Aldrich) and observed on Leica MZFLIII stereomicroscope. Epidermal preparations were also stained with 0.5% Oil Red O (Sigma), which stains sebaceous glands. Footpads 1 and 2 were not analyzed as their high eccrine gland density prevents accurate scoring. The number of eccrine glands per footpad was averaged across both hindfeet. 370V (N=17), 370V/370A (N=18), and 370A (N=16) animals were assessed to evaluate the effect of 370A on eccrine gland number and 370V/379E (N=12), 370V/379K (N=11), and 370A/379K (N=13) animals were analyzed to evaluate the effect of 370A on the 379K mutation in separate crosses. Glands were analyzed from mice aged three to six weeks.
Details of all statistical tests of mouse data are reported in Supplemental Information S3 and Table S5.
Association study
Population
We studied a Han Chinese population from an established Taizhou longitudinal cohort in Jiangsu Province, China (Wang et al., 2009) that recruited individuals from five closely located villages in Taizhou (ages 35–65) and local students of Taizhou Professional Technology College (ages 18–21). All participants spent the majority or entirety of their lives in Taizhou and are expected to be homogeneous.
DNA extraction, genotyping, and sample selection
DNA extraction and genotyping were performed at Fudan University. Upon enrollment in the cohort, each participant’s blood samples was collected and stored in the cohort database. DNA was isolated using standard phenol/chloroform extraction. The EDAR SNP, rs3827760, was genotyped using the SNaPshot Multiplex System which included 7 other SNPs which showed signatures of positive selection in East Asia. Genotype calling was performed by GeneMapper v2.0. We compiled a priority list of potential study participants based on genotype results. 370V allele carriers had top priority, followed by the rare allele carriers of the other 7 SNPs. From the 2,572 samples genotyped, we contacted the top 1,000 individuals, and enrolled 623 in this study (427 from the villages and 196 from the college). Among the other SNPs genotyped, none are on the same chromosome as 370A, and none were associated with 370A. Therefore, we concluded that the 437 370A individuals selected in this scheme can be seen as a random sampling for the 370A association study.
Detailed phenotype collection and calling procedure as well as statistical methods are provided in Supplementary Information S4. We performed all human subjects work in accordance with approved protocols by Fudan and Harvard Universities.
Supplementary Material
Highlights.
Selected East-Asian EDAR allele, 370A, emerged in central China ~ 30,000 years ago.
Hair, sweat and mammary glands are altered in a 370A knock-in mouse model.
The novel effect of 370A on mouse sweat gland density is recapitulated in humans.
Acknowledgments
This project was funded by a grant from the Harvard University Science and Engineering Committee Seed Fund for Interdisciplinary Science to CJT, PCS, BAM and DEL; a Packard Foundation Fellowship in Science and Engineering and an NIH Innovator Award 1DP2OD006514-01 to PCS; a BIRT Award AR055256-04S1 from NIAMS to BAM; an NIH grant R37 HD032443 to CJT; and funding from the American School of Prehistoric Research to DEL. Human association study work was additionally supported by NSFC 30890034; MOST 2011BAI09B00; MOH 201002007 to LJ. YI was funded by an AXA Research Fund postdoctoral fellowship and PG by the LeCHE Marie Curie FP7 framework. Work in APM’s laboratory was supported by an NIH R37 054364 grant. We acknowledge the UCL Legion High Performance Computing Facility and support services and thank O. Bar Yosef, C. Zhao, E. Rohling, S. Schaffner, L. Gaffney, C. Edwards, J. Vitti, S. Tabrizi and A. Tariela for feedback on the manuscript and A. Carpenter, C. Wählby, and M. Morgan for data analysis help.
Footnotes
The authors declare no conflict of interest.
Publisher's Disclaimer: This is a PDF file of an unedited manuscript that has been accepted for publication. As a service to our customers we are providing this early version of the manuscript. The manuscript will undergo copyediting, typesetting, and review of the resulting proof before it is published in its final citable form. Please note that during the production process errors may be discovered which could affect the content, and all legal disclaimers that apply to the journal pertain.
References
- Akey JM. Constructing Genomic Maps of Positive Selection in Humans: Where Do We Go from Here? Genome Res. 2009;19:711–722. doi: 10.1101/gr.086652.108. [DOI] [PMC free article] [PubMed] [Google Scholar]
- Anderson P, Frisch RE, Graham CE, Manderson L, Orubuloye IO, Philippe P, Raphael D, Stini WA, Esterik PV. The Reproductive Role of the Human Breast [and Comments and Reply] Current Anthropology. 1983;24:25–45. [Google Scholar]
- Beaumont MA, Zhang W, Balding DJ. Approximate Bayesian computation in population genetics. Genetics. 2002;162:2025–2035. doi: 10.1093/genetics/162.4.2025. [DOI] [PMC free article] [PubMed] [Google Scholar]
- Bertorelle G, Benazzo A, Mona S. ABC as a flexible framework to estimate demography over space and time: some cons, many pros. Mol Ecol. 2010;19:2609–2625. doi: 10.1111/j.1365-294X.2010.04690.x. [DOI] [PubMed] [Google Scholar]
- Bramble DM, Lieberman DE. Endurance running and the evolution of Homo. Nature. 2004;432:345–352. doi: 10.1038/nature03052. [DOI] [PubMed] [Google Scholar]
- Bryk J, Hardouin E, Pugach I, Hughes D, Strotmann R, Stoneking M, Myles S. Positive selection in East Asians for an EDAR allele that enhances NF-kappaB activation. PLoS ONE. 2008;3:e2209. doi: 10.1371/journal.pone.0002209. [DOI] [PMC free article] [PubMed] [Google Scholar]
- Cann HM, De Toma C, Cazes L, Legrand MF, Morel V, Piouffre L, Bodmer J, Bodmer WF, Bonne-Tamir B, Cambon-Thomsen A, et al. A human genome diversity cell line panel. Science. 2002;296:261–262. doi: 10.1126/science.296.5566.261b. [DOI] [PubMed] [Google Scholar]
- Carrier DR, Kapoor AK, Kimura T, Nickels MK, Satwanti, Scott EC, So JK, Trinkaus E. The Energetic Paradox of Human Running and Hominid Evolution [and Comments and Reply] Current Anthropology. 1984;25:483–495. [Google Scholar]
- Carroll SB. Evo-Devo and an Expanding Evolutionary Synthesis: A Genetic Theory of Morphological Evolution. Cell. 2008;134:25–36. doi: 10.1016/j.cell.2008.06.030. [DOI] [PubMed] [Google Scholar]
- Chang SH, Jobling S, Brennan K, Headon DJ. Enhanced Edar signalling has pleiotropic effects on craniofacial and cutaneous glands. PLoS ONE. 2009;4:e7591. doi: 10.1371/journal.pone.0007591. [DOI] [PMC free article] [PubMed] [Google Scholar]
- Chen H. The joint allele frequency spectrum of multiple populations: a coalescent theory approach. Theor Popul Biol. 2012;81:179–195. doi: 10.1016/j.tpb.2011.11.004. [DOI] [PubMed] [Google Scholar]
- Chen Z, Wu AH, Gauderman WJ, Bernstein L, Ma H, Pike MC, Ursin G. Does mammographic density reflect ethnic differences in breast cancer incidence rates? Am J Epidemiol. 2004;159:140–147. doi: 10.1093/aje/kwh028. [DOI] [PubMed] [Google Scholar]
- Clarke A, Phillips DI, Brown R, Harper PS. Clinical aspects of X-linked hypohidrotic ectodermal dysplasia. Arch Dis Child. 1987;62:989–996. doi: 10.1136/adc.62.10.989. [DOI] [PMC free article] [PubMed] [Google Scholar]
- Cluzeau C, Hadj-Rabia S, Bal E, Clauss F, Munnich A, Bodemer C, Headon D, Smahi A. The EDAR370A allele attenuates the severity of hypohidrotic ectodermal dysplasia caused by EDA gene mutation. The British Journal of Dermatology. 2012;166:678–681. doi: 10.1111/j.1365-2133.2011.10620.x. [DOI] [PubMed] [Google Scholar]
- Cluzeau C, Hadj-Rabia S, Jambou M, Mansour S, Guigue P, Masmoudi S, Bal E, Chassaing N, Vincent MC, Viot G, et al. Only four genes (EDA1, EDAR, EDARADD, and WNT10A) account for 90% of hypohidrotic/anhidrotic ectodermal dysplasia cases. Hum Mutat. 2011;32:70–72. doi: 10.1002/humu.21384. [DOI] [PubMed] [Google Scholar]
- Colosimo PF, Hosemann KE, Balabhadra S, Villarreal G, Jr, Dickson M, Grimwood J, Schmutz J, Myers RM, Schluter D, Kingsley DM. Widespread parallel evolution in sticklebacks by repeated fixation of Ectodysplasin alleles. Science. 2005;307:1928–1933. doi: 10.1126/science.1107239. [DOI] [PubMed] [Google Scholar]
- Cox RD, Brown SDM. Rodent models of genetic disease. Curr Opin Genet Dev. 2003;13:278–283. doi: 10.1016/s0959-437x(03)00051-0. [DOI] [PubMed] [Google Scholar]
- Csilléry K, Blum MGB, Gaggiotti OE, François O. Approximate Bayesian Computation (ABC) in practice. Trends Ecol Evol (Amst) 2010;25:410–418. doi: 10.1016/j.tree.2010.04.001. [DOI] [PubMed] [Google Scholar]
- Cui CY, Durmowicz M, Ottolenghi C, Hashimoto T, Griggs B, Srivastava AK, Schlessinger D. Inducible mEDA-A1 transgene mediates sebaceous gland hyperplasia and differential formation of two types of mouse hair follicles. Hum Mol Genet. 2003;12:2931–2940. doi: 10.1093/hmg/ddg325. [DOI] [PubMed] [Google Scholar]
- Dixson BJ, Vasey PL, Sagata K, Sibanda N, Linklater WL, Dixson AF. Men’s Preferences for Women’s Breast Morphology in New Zealand, Samoa, and Papua New Guinea. Archives of Sexual Behavior. 2010;40:1271–1279. doi: 10.1007/s10508-010-9680-6. [DOI] [PubMed] [Google Scholar]
- Enard W, Gehre S, Hammerschmidt K, Hölter SM, Blass T, Somel M, Brückner MK, Schreiweis C, Winter C, Sohr R, et al. A humanized version of Foxp2 affects cortico-basal ganglia circuits in mice. Cell. 2009;137:961–971. doi: 10.1016/j.cell.2009.03.041. [DOI] [PubMed] [Google Scholar]
- Enattah NS, Sahi T, Savilahti E, Terwilliger JD, Peltonen L, Järvelä I. Identification of a variant associated with adult-type hypolactasia. Nat Genet. 2002;30:233–237. doi: 10.1038/ng826. [DOI] [PubMed] [Google Scholar]
- Enshell-Seijffers D, Lindon C, Wu E, Taketo MM, Morgan BA. Beta-catenin activity in the dermal papilla of the hair follicle regulates pigment-type switching. Proc Natl Acad Sci USA. 2010;107:21564–21569. doi: 10.1073/pnas.1007326107. [DOI] [PMC free article] [PubMed] [Google Scholar]
- Fagundes NJR, Ray N, Beaumont M, Neuenschwander S, Salzano FM, Bonatto SL, Excoffier L. Statistical evaluation of alternative models of human evolution. Proc Natl Acad Sci USA. 2007;104:17614–17619. doi: 10.1073/pnas.0708280104. [DOI] [PMC free article] [PubMed] [Google Scholar]
- Fujimoto A, Kimura R, Ohashi J, Omi K, Yuliwulandari R, Batubara L, Mustofa MS, Samakkarn U, Settheetham-Ishida W, Ishida T, et al. A scan for genetic determinants of human hair morphology: EDAR is associated with Asian hair thickness. Hum Mol Genet. 2008a;17:835–843. doi: 10.1093/hmg/ddm355. [DOI] [PubMed] [Google Scholar]
- Fujimoto A, Ohashi J, Nishida N, Miyagawa T, Morishita Y, Tsunoda T, Kimura R, Tokunaga K. A replication study confirmed the EDAR gene to be a major contributor to population differentiation regarding head hair thickness in Asia. Hum Genet. 2008b;124:179–185. doi: 10.1007/s00439-008-0537-1. [DOI] [PubMed] [Google Scholar]
- Furnham A, Dias M, McClelland A. The Role of Body Weight, Waist-to-Hip Ratio, and Breast Size in Judgments of Female Attractiveness. Sex Roles. 1998;39:311–326. [Google Scholar]
- Furnham A, Swami V, Shah K. Body weight, waist-to-hip ratio and breast size correlates of ratings of attractiveness and health. Personality and Individual Differences. 2006;41:443–454. [Google Scholar]
- Goebel T, Waters MR, O’Rourke DH. The late Pleistocene dispersal of modern humans in the Americas. Science. 2008;319:1497–1502. doi: 10.1126/science.1153569. [DOI] [PubMed] [Google Scholar]
- Grossman SR, Shlyakhter I, Shylakhter I, Karlsson EK, Byrne EH, Morales S, Frieden G, Hostetter E, Angelino E, Garber M, et al. A composite of multiple signals distinguishes causal variants in regions of positive selection. Science. 2010;327:883–886. doi: 10.1126/science.1183863. [DOI] [PubMed] [Google Scholar]
- Grüneberg H. The Glandular Aspects of the Tabby Syndrome in the Mouse. J Embryol Exp Morphol. 1971;25:1–19. [PubMed] [Google Scholar]
- Headon DJ, Overbeek PA. Involvement of a novel Tnf receptor homologue in hair follicle induction. Nat Genet. 1999;22:370–374. doi: 10.1038/11943. [DOI] [PubMed] [Google Scholar]
- Itan Y, Powell A, Beaumont MA, Burger J, Thomas MG. The origins of lactase persistence in Europe. PLoS Comput Biol. 2009;5:e1000491. doi: 10.1371/journal.pcbi.1000491. [DOI] [PMC free article] [PubMed] [Google Scholar]
- Jakobsson M, Scholz SW, Scheet P, Gibbs JR, VanLiere JM, Fung HC, Szpiech ZA, Degnan JH, Wang K, Guerreiro R, et al. Genotype, haplotype and copy-number variation in worldwide human populations. Nature. 2008;451:998–1003. doi: 10.1038/nature06742. [DOI] [PubMed] [Google Scholar]
- Juniper K, Jr, Stewart JR, Devaney GT, Smith TJ. Finger-tip sweat gland activity and salivary secretion as indices of anticholinergic drug effect. Am J Dig Dis. 1964;9:31–42. doi: 10.1007/BF02232677. [DOI] [PubMed] [Google Scholar]
- Kimura R, Yamaguchi T, Takeda M, Kondo O, Toma T, Haneji K, Hanihara T, Matsukusa H, Kawamura S, Maki K, et al. A common variation in EDAR is a genetic determinant of shovel-shaped incisors. Am J Hum Genet. 2009;85:528–535. doi: 10.1016/j.ajhg.2009.09.006. [DOI] [PMC free article] [PubMed] [Google Scholar]
- King MC, Wilson AC. Evolution at two levels in humans and chimpanzees. Science. 1975;188:107–116. doi: 10.1126/science.1090005. [DOI] [PubMed] [Google Scholar]
- Kondo S, Kuwahara Y, Kondo M, Naruse K, Mitani H, Wakamatsu Y, Ozato K, Asakawa S, Shimizu N, Shima A. The medaka rs-3 locus required for scale development encodes ectodysplasin-A receptor. Curr Biol. 2001;11:1202–1206. doi: 10.1016/s0960-9822(01)00324-4. [DOI] [PubMed] [Google Scholar]
- Kuno Y. Human perspiration. Thomas; 1956. [Google Scholar]
- Kwiatkowski DP. How Malaria Has Affected the Human Genome and What Human Genetics Can Teach Us about Malaria. The American Journal of Human Genetics. 2005;77:171–192. doi: 10.1086/432519. [DOI] [PMC free article] [PubMed] [Google Scholar]
- Lamason RL, Mohideen MAPK, Mest JR, Wong AC, Norton HL, Aros MC, Jurynec MJ, Mao X, Humphreville VR, Humbert JE, et al. SLC24A5, a Putative Cation Exchanger, Affects Pigmentation in Zebrafish and Humans. Science. 2005;310:1782–1786. doi: 10.1126/science.1116238. [DOI] [PubMed] [Google Scholar]
- Lefèvre CM, Sharp JA, Nicholas KR. Evolution of lactation: ancient origin and extreme adaptations of the lactation system. Annu Rev Genomics Hum Genet. 2010;11:219–238. doi: 10.1146/annurev-genom-082509-141806. [DOI] [PubMed] [Google Scholar]
- Li JZ, Absher DM, Tang H, Southwick AM, Casto AM, Ramachandran S, Cann HM, Barsh GS, Feldman M, Cavalli-Sforza LL, et al. Worldwide human relationships inferred from genome-wide patterns of variation. Science. 2008;319:1100–1104. doi: 10.1126/science.1153717. [DOI] [PubMed] [Google Scholar]
- Maskarinec G, Meng L, Ursin G. Ethnic differences in mammographic densities. Int J Epidemiol. 2001;30:959–965. doi: 10.1093/ije/30.5.959. [DOI] [PubMed] [Google Scholar]
- Mauldin EA, Gaide O, Schneider P, Casal ML. Neonatal treatment with recombinant ectodysplasin prevents respiratory disease in dogs with X-linked ectodermal dysplasia. Am J Med Genet A. 2009;149A:2045–2049. doi: 10.1002/ajmg.a.32916. [DOI] [PMC free article] [PubMed] [Google Scholar]
- Mikkola ML. TNF superfamily in skin appendage development. Cytokine & Growth Factor Reviews. 2008;19:219–230. doi: 10.1016/j.cytogfr.2008.04.008. [DOI] [PubMed] [Google Scholar]
- Mikkola ML. The Edar subfamily in hair and exocrine gland development. Adv Exp Med Biol. 2011;691:23–33. doi: 10.1007/978-1-4419-6612-4_3. [DOI] [PubMed] [Google Scholar]
- Mou C, Thomason HA, Willan PM, Clowes C, Harris WE, Drew CF, Dixon J, Dixon MJ, Headon DJ. Enhanced ectodysplasin-A receptor (EDAR) signaling alters multiple fiber characteristics to produce the East Asian hair form. Hum Mutat. 2008;29:1405–1411. doi: 10.1002/humu.20795. [DOI] [PubMed] [Google Scholar]
- Mustonen T, Pispa J, Mikkola ML, Pummila M, Kangas AT, Pakkasjärvi L, Jaatinen R, Thesleff I. Stimulation of ectodermal organ development by Ectodysplasin-A1. Dev Biol. 2003;259:123–136. doi: 10.1016/s0012-1606(03)00157-x. [DOI] [PubMed] [Google Scholar]
- Neville MC, Medina D, Monks J, Hovey RC. The Mammary Fat Pad. Journal of Mammary Gland Biology and Neoplasia. 1998;3:109–116. doi: 10.1023/a:1018786604818. [DOI] [PubMed] [Google Scholar]
- O’Rourke DH, Raff JA. The human genetic history of the Americas: the final frontier. Curr Biol. 2010;20:R202–207. doi: 10.1016/j.cub.2009.11.051. [DOI] [PubMed] [Google Scholar]
- Oftedal OT. The mammary gland and its origin during synapsid evolution. J Mammary Gland Biol Neoplasia. 2002;7:225–252. doi: 10.1023/a:1022896515287. [DOI] [PubMed] [Google Scholar]
- Okada N, Kitano Y, Morimoto T. Isolation of a viable eccrine sweat gland by dispase. Arch Dermatol Res. 1983;275:130–133. doi: 10.1007/BF00412889. [DOI] [PubMed] [Google Scholar]
- Park J-H, Yamaguchi T, Watanabe C, Kawaguchi A, Haneji K, Takeda M, Kim Y-I, Tomoyasu Y, Watanabe M, Oota H, et al. Effects of an Asian-specific nonsynonymous EDAR variant on multiple dental traits. Journal of Human Genetics. 2012 doi: 10.1038/jhg.2012.60. [DOI] [PubMed] [Google Scholar]
- Peter BM, Huerta-Sanchez E, Nielsen R. Distinguishing between Selective Sweeps from Standing Variation and from a De Novo Mutation. PLoS Genet. 2012;8:e1003011. doi: 10.1371/journal.pgen.1003011. [DOI] [PMC free article] [PubMed] [Google Scholar]
- Pispa J, Mikkola ML, Mustonen T, Thesleff I. Ectodysplasin, Edar and TNFRSF19 are expressed in complementary and overlapping patterns during mouse embryogenesis. Gene Expr Patterns. 2003;3:675–679. doi: 10.1016/s1567-133x(03)00092-9. [DOI] [PubMed] [Google Scholar]
- Prodi DA, Pirastu N, Maninchedda G, Sassu A, Picciau A, Palmas MA, Mossa A, Persico I, Adamo M, Angius A, et al. EDA2R is associated with androgenetic alopecia. J Invest Dermatol. 2008;128:2268–2270. doi: 10.1038/jid.2008.60. [DOI] [PubMed] [Google Scholar]
- Ramanathan P, Martin I, Thomson P, Taylor R, Moran C, Williamson P. Genomewide analysis of secretory activation in mouse models. J Mammary Gland Biol Neoplasia. 2007;12:305–314. doi: 10.1007/s10911-007-9052-6. [DOI] [PubMed] [Google Scholar]
- Randall W. Quantitation and regional distribution of sweat glands in man. J Clin Invest. 1964;25:761–767. doi: 10.1172/JCI101760. [DOI] [PMC free article] [PubMed] [Google Scholar]
- Ray N, Wegmann D, Fagundes NJR, Wang S, Ruiz-Linares A, Excoffier L. A statistical evaluation of models for the initial settlement of the american continent emphasizes the importance of gene flow with Asia. Mol Biol Evol. 2010;27:337–345. doi: 10.1093/molbev/msp238. [DOI] [PubMed] [Google Scholar]
- Sabeti PC, Varilly P, Fry B, Lohmueller J, Hostetter E, Cotsapas C, Xie X, Byrne EH, McCarroll SA, Gaudet R, et al. Genome-wide detection and characterization of positive selection in human populations. Nature. 2007;449:913–918. doi: 10.1038/nature06250. [DOI] [PMC free article] [PubMed] [Google Scholar]
- Scheet P, Stephens M. A fast and flexible statistical model for large-scale population genotype data: applications to inferring missing genotypes and haplotypic phase. Am J Hum Genet. 2006;78:629–644. doi: 10.1086/502802. [DOI] [PMC free article] [PubMed] [Google Scholar]
- Schneider CA, Rasband WS, Eliceiri KW. NIH Image to ImageJ: 25 years of image analysis. Nat Methods. 2012;9:671–675. doi: 10.1038/nmeth.2089. [DOI] [PMC free article] [PubMed] [Google Scholar]
- Sivakumaran S, Agakov F, Theodoratou E, Prendergast JG, Zgaga L, Manolio T, Rudan I, McKeigue P, Wilson JF, Campbell H. Abundant pleiotropy in human complex diseases and traits. Am J Hum Genet. 2011;89:607–618. doi: 10.1016/j.ajhg.2011.10.004. [DOI] [PMC free article] [PubMed] [Google Scholar]
- Stern DL. Evolutionary developmental biology and the problem of variation. Evolution. 2000;54:1079–1091. doi: 10.1111/j.0014-3820.2000.tb00544.x. [DOI] [PubMed] [Google Scholar]
- Sun Y, Clemens SC, Morrill C, Lin X, Wang X, An Z. Influence of Atlantic meridional overturning circulation on the East Asian winter monsoon. Nature Geoscience. 2012;5:46–49. [Google Scholar]
- Sundberg JP. Handbook of mouse mutations with skin and hair abnormalities: animal models and biomedical tools. Boca Raton: CRC Press; 1994. [Google Scholar]
- Voutilainen M, Lindfors PH, Lefebvre S, Ahtiainen L, Fliniaux I, Rysti E, Murtoniemi M, Schneider P, Schmidt-Ullrich R, Mikkola ML. Ectodysplasin regulates hormone-independent mammary ductal morphogenesis via NF-κB. Proc Natl Acad Sci USA. 2012;109:5744–5749. doi: 10.1073/pnas.1110627109. [DOI] [PMC free article] [PubMed] [Google Scholar]
- Wang X, Lu M, Qian J, Yang Y, Li S, Lu D, Yu S, Meng W, Ye W, Jin L. Rationales, design and recruitment of the Taizhou Longitudinal Study. BMC Public Health. 2009;9:223. doi: 10.1186/1471-2458-9-223. [DOI] [PMC free article] [PubMed] [Google Scholar]
- Wang YJ, Cheng H, Edwards RL, An ZS, Wu JY, Shen CC, Dorale JA. A High-Resolution Absolute-Dated Late Pleistocene Monsoon Record from Hulu Cave, China. Science. 2001;294:2345–2348. doi: 10.1126/science.1064618. [DOI] [PubMed] [Google Scholar]
- Yuan D, Cheng H, Edwards RL, Dykoski CA, Kelly MJ, Zhang M, Qing J, Lin Y, Wang Y, Wu J, et al. Timing, Duration, and Transitions of the Last Interglacial Asian Monsoon. Science. 2004;304:575–578. doi: 10.1126/science.1091220. [DOI] [PubMed] [Google Scholar]
Associated Data
This section collects any data citations, data availability statements, or supplementary materials included in this article.