

Summary
Epidermal morphogenesis results from a delicate balance between keratinocyte proliferation and differentiation, and this balance is perturbed upon deletion of transcription factor Ctip2. Here we demonstrate that Ctip2, in a cell autonomous manner, controls keratinocyte proliferation and cytoskeletal organization, and regulates the onset and maintenance of differentiation in keratinocytes in culture. Ctip2 integrates keratinocyte proliferation and the switch to differentiation by directly and positively regulating EGFR transcription in proliferating cells and Notch1 transcription in differentiating cells. In proliferative cells, the EGFR promoter is occupied by Ctip2, whereas Ctip2 is only recruited to the Notch1 promoter under differentiating conditions. Activation of EGFR signaling downregulates Ctip2 at the transcript level, whereas high calcium signaling triggers SUMOylation, ubiquitination and proteasomal degradation of Ctip2 at the protein level. Together, our findings demonstrate a novel mechanism(s) of Ctip2-mediated, coordinated control of epidermal proliferation and terminal differentiation, and identify a pathway of negative feedback regulation of Ctip2 during epidermal development.
Key words: Ctip2/Bcl11b, Keratinocytes, Differentiation, EGFR, Notch1
Introduction
Mammalian skin is a self-renewing tissue that serves as a barrier to separate the body from environmental insults and prevents loss of body fluid (Fuchs and Raghavan, 2002). The epidermis develops from a single layer of keratinocytes into a multi-layered, stratified epithelium consisting of a basal layer, followed by spinous, granular and cornified cell layers (Byrne et al., 2003; Mack et al., 2005). Skin development is also accompanied with E-cadherin–actin reorganization within differentiated cell layers, resulting in maturation of cell–cell junctions and formation of an epidermal permeability barrier (EPB) (Müller et al., 2008; Verdoni et al., 2010). Therefore, mouse epidermis provides an ideal model to study the balance between epithelial cell proliferation and differentiation, and to identify the developmental cues that alter the growth and/or differentiation potential of keratinocytes.
A number of membrane receptors, as well as transcription factors, have been reported to regulate both proliferation and differentiation of epidermal keratinocytes. Activation of EGF receptor (EGFR) stimulates the proliferation of basal keratinocytes in developing epidermis (Carpenter and Cohen, 1979; Miettinen et al., 1995). In contrast, activation of Notch1 signaling promotes exit of keratinocytes from the cell cycle and entry into the differentiation program (Artavanis-Tsakonas et al., 1999; Rangarajan et al., 2001). Expression of Notch1 is upregulated in embryonic keratinocytes, which accounts in part for the high commitment of embryonic keratinocytes towards terminal differentiation (Okuyama et al., 2004).
Post-translational modification (PTMs) of transcription factors (TFs), including phosphorylation, ubiquitination and SUMOylation, plays a pivotal role in regulating transcriptional control in response to changes in cellular microenvironment. Upon activation of EGFR signaling pathway, downstream transcription factors, such as Elk-1, cJun and STAT1, are phosphorylated, leading to changes in their transcription regulatory activities (Fromm et al., 2008; Quelle et al., 1995; Zenz et al., 2003). In a human keratinocyte cell line (HaCaT cells), Ca2+-induced differentiation led to transient upregulation of genes encoding the SUMOylation system components (Deyrieux et al., 2007). The E2 polyubiquitinin-conjugating enzyme Ubc13 has been recently shown to control keratinocyte growth, differentiation and survival (Sayama et al., 2010). These findings support a role for post-translational modifications in proliferation and differentiation of epidermal keratinocytes.
COUP-TF-interacting protein 2 (Ctip2; also known as Bcl11b), a C2H2 zinc finger transcription factor, is expressed predominantly in central nervous system, thymocytes, skin, olfactory epithelium and in oral and gut epithelia (Golonzhka et al., 2007; Leid et al., 2004). Ctip2 has been identified as the most upregulated transcription factor in early stages of T cell development (Li et al., 2010a) and plays crucial roles in T cell commitment, thymocyte positive selection, and survival of double positive thymocytes (Albu et al., 2007; Kastner et al., 2010; Li et al., 2010b). In skin, Ctip2 is highly expressed in developing epidermis, dermis, and in the bulge region of hair follicles (Golonzhka et al., 2007). Germline deletion of Ctip2 leads to defective proliferation and late differentiation events, as well as impaired formation of epidermal permeability barrier (Golonzhka et al., 2009). However, the mechanisms underlying the role of Ctip2 in controlling the balance between proliferation and differentiation of epidermal keratinocytes is unknown.
Here, we sought to identify the direct transcriptional targets of Ctip2 and to determine whether Ctip2 is regulated by PTMs in epidermal keratinocytes. Studies conducted herein with cultured primary mouse keratinocytes and systematic analyses of developing mouse epidermis, revealed that Ctip2 controls keratinocyte proliferation and differentiation by directly regulating the expression of EGFR and Notch1, respectively. We also find that the expression of Ctip2 itself is tightly controlled by both the EGF and calcium signaling pathways, the two key signaling pathways controlling epidermal development. Our findings provide better understanding of how the proliferation and differentiation programs of epidermal keratinocytes is coordinately regulated by Ctip2 during development.
Results
Ctip2 is essential for proliferation and onset of differentiation during early skin development
We have previously shown in E17.5 and E18.5 embryos that germline deletion of Ctip2 gene results in hypoplastic epidermis, altered late terminal differentiation and impaired epidermal permeability barrier formation (Golonzhka et al., 2009). Here we have analyzed Ctip2 function in epidermal proliferation and differentiation during early stages of skin morphogenesis in which Ctip2 was expressed at high levels (Fig. 1A, left panels). Histological analyses on skin sections from Ctip2-null embryos (KO skin hereafter) at E13.5, E14.5 and E16.5 revealed reduced epidermal thickness in the KO skin, compared to wild-type (WT) skin (Fig. 1B; supplementary material Fig. S1A). In parallel, we observed reduced hair follicle (HF) density at E18.5 in the KO skin compared to WT skin (supplementary material Fig. S1B,C). Immunohistochemical analyses of the proliferation marker Ki67 on E14.5 and E16.5 skin sections revealed a reduced number of Ki67+ cells in KO epidermis compared to controls (Fig. 1C). We then compared expression patterns of early and late differentiation markers, keratin (K10) and filaggrin (FLG), respectively. Expression of K10 was delayed in the KO skin but intense K10 staining was detected in the condensed epidermal cell layers of the KO skin by E16.5 (Fig. 1D). FLG expression was detected at E16.5 in the WT epidermis but was undetectable in the KO epidermis at this stage (Fig. 1E). These results suggest that germline deletion of Ctip2 results in reduced epidermal proliferation and delayed onset of differentiation during early stages of skin development.
Fig. 1.
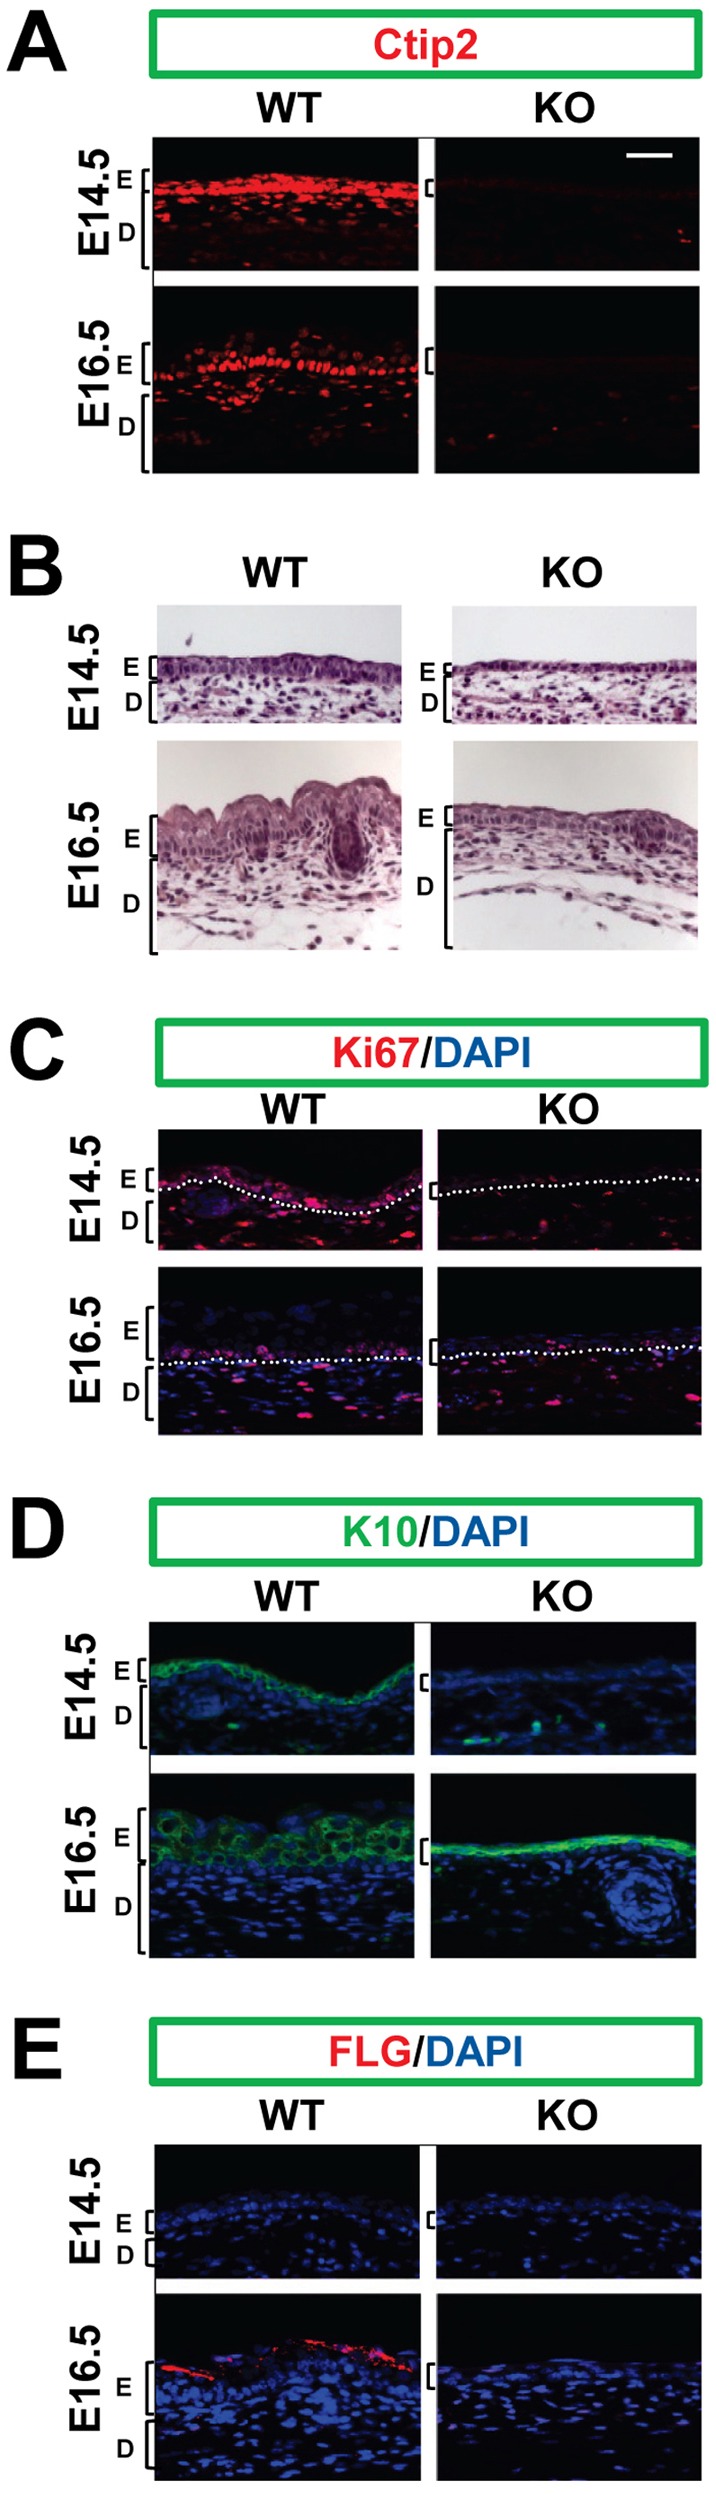
Lack of Ctip2 is associated with impaired proliferation and delayed onset of differentiation during early stages of epidermal development. (A) Immunofluorescence staining of embryonic skin sections from wild-type (WT) and Ctip2 null (KO) mice with an anti-Ctip2 antibody. (B) Hematoxylin/Eosin-stained sections of dorsal skin collected from WT and KO embryos on the indicated embryonic days. (C–E) Immunofluorescence staining of embryonic skin sections from WT and KO mice with anti-Ki67 (C), anti-K10 (D) and anti-FLG (E) antibodies. The results are representative of at least three independent studies. Abbreviations: D, dermis; E, epidermis. Scale bar: 20 µm.
Loss of Ctip2 results in reduced proliferation and survival of primary mouse keratinocytes
In order to dissect the autocrine functions of Ctip2 in keratincoytes, we prepared primary keratinocyte cultures after separation of epidermis from dermis (for details see Materials Methods). Primary keratinocytes cultured in low calcium medium consist of two populations: continuously proliferating, attached cells and detached cells that have terminally differentiated (Li et al., 1996). We found high levels of Ctip2 in the attached keratinocytes, which also expressed proliferation markers Ki67 and PCNA (Fig. 2A, right panel), whereas Ctip2 expression was only detectable at a low level in detached cells that highly expressed differentiation markers, including K10, involucrin (INV), and FLG (Fig. 2A, left panel).
Fig. 2.
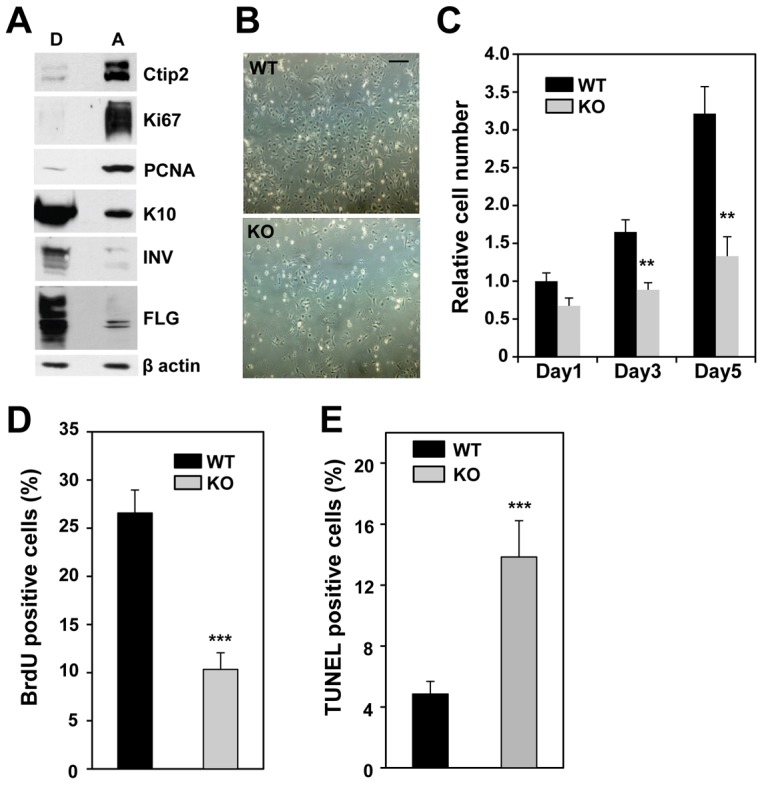
Deletion of Ctip2 results in reduced proliferation and survival of primary mouse keratinocytes in vitro. (A) Cell extracts (10 µg) from attached (A) and detached (D) keratinocytes were immunoblotted with antibodies against Ctip2, Ki67, PCNA, K10, INV, FLG or β-actin (a loading control). (B) Phase-contrast images of primary keratinocytes taken at day 3 after plating. Scale bar: 100 µm. (C) Relative cell numbers were determined using the MTT assay on the indicated days after plating. (D) Subconfluent WT and KO keratinocytes were pulse-labeled with BrdU prior to immunocytochemistry analyses using anti-BrdU antibody and the percentage of BrdU-positive cells was determined. (E) Results of the TUNEL assay for apoptotic cells on fixed, cultured keratinocytes. Statistical significance was determined using Student's t-test (***P<0.001). WT, black bars; KO, gray bars. The results are representative of at least three independent studies.
Primary keratinocytes from Ctip2-null mice also proliferated more slowly. While the WT keratinocytes reached >75% confluency after 3 days in culture, KO cells were only ∼30% confluent (Fig. 2B). This was confirmed by a MTT cell proliferation assay, which revealed a significant growth defect of Ctip2-null keratinocytes compared to WT cells (Fig. 2C). BrdU incorporation revealed a 2.5-fold reduction of S-phase cells in mutant keratinocytes (Fig. 2D). Ctip2-null keratinocytes also exhibited a level of apoptosis that was approximately threefold higher than WT cells (Fig. 2E), suggesting that growth defects in Ctip2-null keratinocytes result from reduced proliferation and increased apoptosis. These results indicate that Ctip2 plays important role in regulating proliferation and survival of primary keratinocytes.
Ctip2 is important for in vitro differentiation of keratinocytes
As Ctip2 depletion results in defective epidermal differentiation during development, we determined if keratinocytes lacking Ctip2 exhibited inherent differentiation defects. To that end, wild-type and mutant keratinocytes were induced to differentiate by withdrawing growth factors (starvation) followed by high calcium (0.2 mM) treatment (HiCa) (Hager et al., 1999). Immunoblotting analyses using antibodies against differentiation markers confirmed that the early differentiation marker K10 was induced in WT cells under these conditions, which also triggered induction of late differentiation markers FLG and LOR (Fig. 3A). In absence of Ctip2, the induction of K10 and loricrin (LOR) was greatly reduced (Fig. 3A, right panel), and more strikingly, the appearance of high molecular weight FLG precursor (profilaggrin) was almost absent compared to control cells (Fig. 3A, left panel).
Fig. 3.

Ctip2 is required for keratinocyte differentiation induced by growth factor depletion and by Ca2+-induced terminal differentiation. (A) Keratinocytes cultured in growth medium (GM) were depleted of growth factors overnight and treated with 0.2 mM CaCl2 for the indicated times before harvest for immunoblotting analyses using antibodies against Ctip2, Ki67, K10, LOR, FLG, E-cadherin, p21, Notch1, cleaved Notch1 (cNotch1), K14 and β-actin. (B) Time course (0–48 hrs) of the cell–cell junction formation and stratification following a Ca2+ switch in WT (left) and Ctip2-KO (right) cells was determined by immunofluorescence using anti-phalloidin (red) and anti-E-cadherin (green) antibodies. Scale bar: 25 µm. (C) Immunofluorescence staining of E14.5, E16.5, and E18.5 skin sections from WT (left) and Ctip2-KO (right) embryos with anti-E-cadherin (green) and anti-phalloidin (red) antibodies. The nuclei were counterstained with DAPI (in blue). Scale bar: 20 µm. The results are representative of at least three independent studies.
Expression of the cell cycle regulator p21, which is transiently induced during early keratinocyte differentiation (Missero et al., 1996; Topley et al., 1999), was upregulated in WT cells after starvation (0 hr), and was gradually downregulated after the high-calcium switch (Fig. 3A). In contrast, p21 was not induced in KO cells after starvation (Fig. 3A). Similarly, the expression of Notch1, a key regulator of keratinocyte differentiation, was induced after starvation and decreased during high calcium treatment at later time point (6–24 hrs) in WT keratinocytes. Furthermore, high calcium facilitated activation of induced Notch1 as evident by increasing amount of cleaved Notch1 (cNotch1) that peaked around 12 hrs (Fig. 3A, left panel). Notch1 was not induced after starvation in KO keratinocytes, and levels of activated Notch1 were nearly undetectable throughout the time course of HiCa treatment (Fig. 3A). These results indicate that Ctip2 is required for onset and maintenance of keratinocyte differentiation, possibly due to the ability to regulate Notch1 expression.
Ctip2 in keratinocytes controls cytoskeletal organization and maintains the epithelial identity of the keratinocytes
Cell–cell junctions between keratinocytes develop as a consequence of increased extracellular calcium (Chang and Goldman, 2004; Kobielak and Fuchs, 2004). This process is initiated by accumulation of E-cadherin (E-cad) at the cell periphery, followed by formation of actin fiber-rich filopodial projections between adjacent cells. We examined those processes in primary keratinocytes in the presence of HiCa. Immunofluorescence staining for phalloidin/F-actin and E-cad, conducted 3 hours after the HiCa switch, clearly revealed actin remodeling and intercellular contact formation, respectively, in wild-type cells. Actin fiber organization further progressed between 6 and 24 hrs, after which cell stratification became prominent at 48 hours (Fig. 3B, left panel). In contrast, formation of actin projections between adjacent cells was delayed in Ctip2-null cells (Fig. 3B, right panel). Furthermore, cellular stratification was reduced in the mutant cells at 48 hrs (Fig. 3B; note lack of E-cad and phalloidin colocalization in mutant panel).
Immunohistochemical studies on WT and mutant skin revealed that E-cad was expressed at the cell–cell adhesion junctions in all layers of developing epidermis of WT skin, whereas peripheral phalloidin staining became more prominent as keratinocytes differentiated (Fig. 3C, left panel). At E16.5, E-cad and F-actin were colocalized at the cell membrane in suprabasal layers, and at E18.5, cornified layers were stained strongly with phalloidin, indicating a high degree of stratification (Fig. 3C, left panel). In contrast, in Ctip2-deficient epidermis, E-cad was downregulated at E16.5 and E18.5, and development of tight cell–cell junctions, indicated by colocalization of E-cad and phalloidin staining, was delayed. Furthermore, phalloidin staining in stratified layers of E18.5 mutant skin was greatly reduced, indicating that the stratification processes were impaired in absence of Ctip2 (Fig. 3C, right panel).
Another striking phenotype of the cultured, KO keratinocytes was altered cell morphology. WT cells exhibited typical pavement-like appearances (Fig. 4A, left panel). In contrast, cell–cell contacts were disrupted in Ctip2 KO keratinocytes, concurrent with loss of cell membrane prominence (Fig. 4A, left panel below). Immunofluorescence staining for F-actin/phalloidin revealed a strong peripheral F-actin ring with slim, central stress fibers in of WT keratinocytes (Fig. 4A, right panel), whereas Ctip2-null keratinocytes exhibited a decrease in marginal F-actin staining, but contained much thicker central stress fibers. The latter is consistent with an epithelial–mesenchymal transition (EMT), during which epithelial cells lose polarity and cell–cell contacts and acquire fibroblast-like properties. To test this hypothesis, we examined the RNA levels of key factors involved in EMT. Significant upregulation of Snail1, TGFβ2, and TGFα transcripts, but not those of Snail2 and TGFβ1, was observed in KO keratinocytes (Fig. 4B). However, expression of SMAD2, SMAD3, and SMAD4 (supplementary material Fig. S2A), integrin family members (supplementary material Fig. S2B), and a group of small GTPase-related genes (supplementary material Fig. S2C), all of which are also involved in EMT, was unaltered in the mutant skin. Interestingly, expression of K8, a keratin that is not expressed in normal skin but is upregulated during malignant conversion of precancerous cells or during EMT, was highly upregulated at both mRNA and protein levels in mutant cells (Fig. 4C,D). K8 was also upregulated in the epidermis of Ctip2-null embryos at E18.5 (Fig. 4E). Chromatin immunoprecipitation (ChIP) analyses using multiple primer sets revealed that Ctip2 was recruited to the proximal K8 promoter in keratinocytes from E18.5 WT skin (supplementary material Fig. S2D). These results suggest that the absence of Ctip2 impairs cytoskeletal organization, reduces cell–cell contacts, and directly or indirectly enhances expression of a subset of genes that induce EMT during epidermal morphogenesis.
Fig. 4.
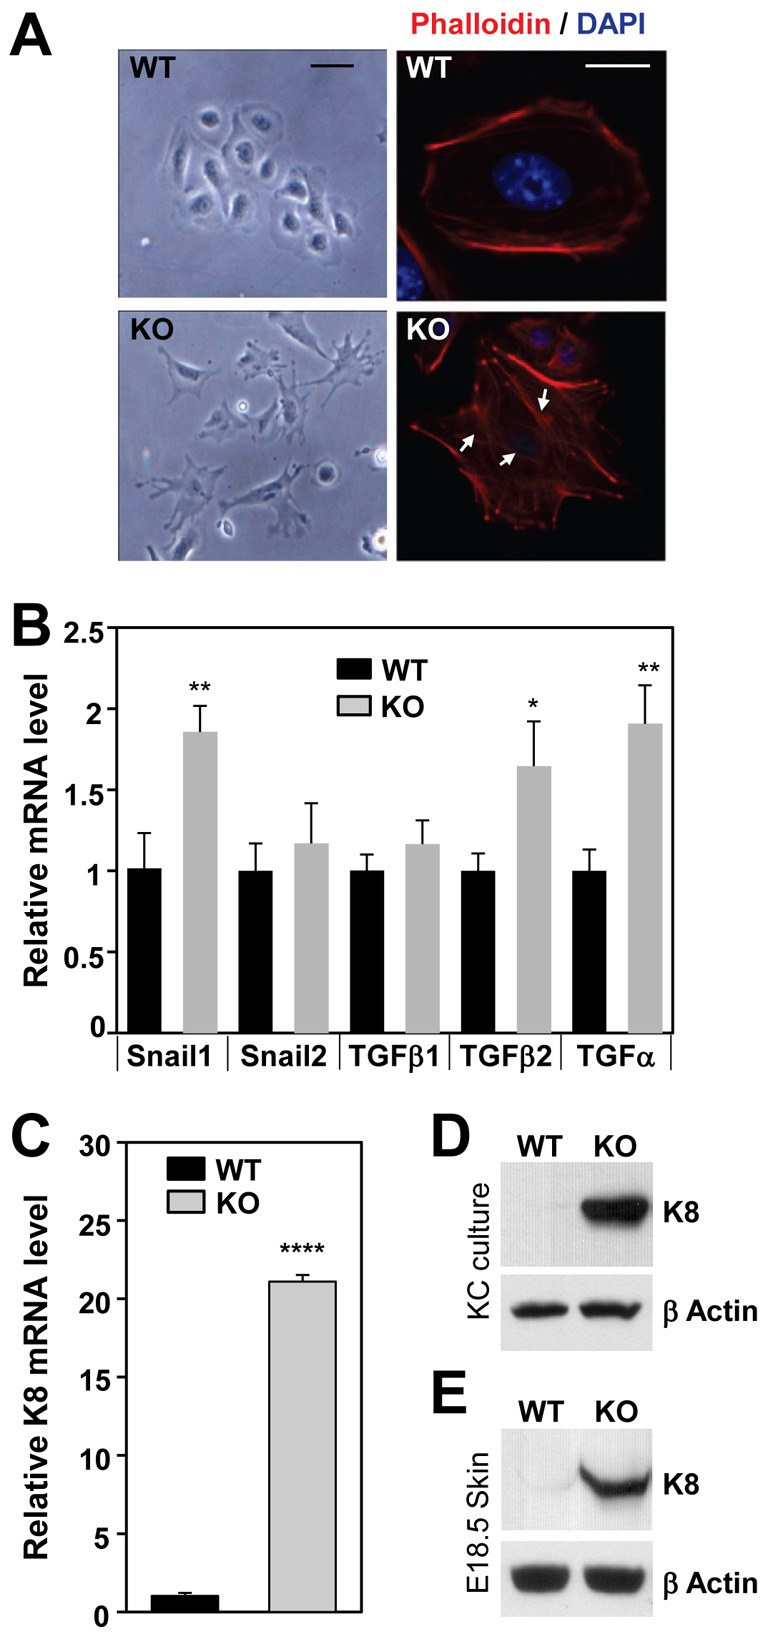
Lack of Ctip2 leads to altered cytoskeletal organization. (A) Phase-contrast images of cultured WT and KO keratinocytes (left panel). Cultured keratinocytes were immunostained with anti-phalloidin (actin staining) and DAPI (nucleus staining) as shown on the right. Scale bar: 20 µm for phase-contrast images; 10 µm for fluorescence image. (B) RT-qPCR analyses of WT or KO primary keratinocytes. Relative mRNA expression levels of the indicated genes were calculated relative to the expression of a housekeeping gene, GAPDH. (C) RT-qPCR analyses of K8 mRNA expression in WT and KO primary keratinocytes (normalized to GAPDH). (D,E) Immunoblotting analyses of cell extracts from WT and Ctip2 KO primary keratinocytes (D) and E18.5 skin (E) using anti-K8 and anti-β actin antibodies. Statistical significance was determined using Student's unpaired t-test (*P<0.05; **P<0.01; ****P<0.0001). The results depicted are representative of at least three independent studies.
Ctip2 regulates the EGF signaling pathway by directly and positively regulating EGFR expression in keratinocytes
Egfr−/− and Ctip2−/− mice exhibit overlapping spectra of skin phenotypes, including defects in eyelid closure, reduced proliferation, and delayed differentiation during epidermal development (Golonzhka et al., 2009; Miettinen et al., 1995; Murillas et al., 1995; Sibilia and Wagner, 1995; Threadgill et al., 1995). To determine if EGFR may be a target of Ctip2, we compared the expression level of EGFR in mouse embryonic skin at E14.5 and E16.5, and in keratinocytes cultured from neonatal WT and Ctip2-null skin. We found a significant decrease in EGFR transcript levels in Ctip2-null epidermis at E14.5 and E16.5 (Fig. 5A). Immunoblotting and immunohistochemical analyses revealed a significant decrease in EGFR protein levels in the mutant skin at E14.5 and E16.5 (Fig. 5B,C), as well as in cultured keratinocytes (Fig. 5D), compared to the control skin/cells.
Fig. 5.
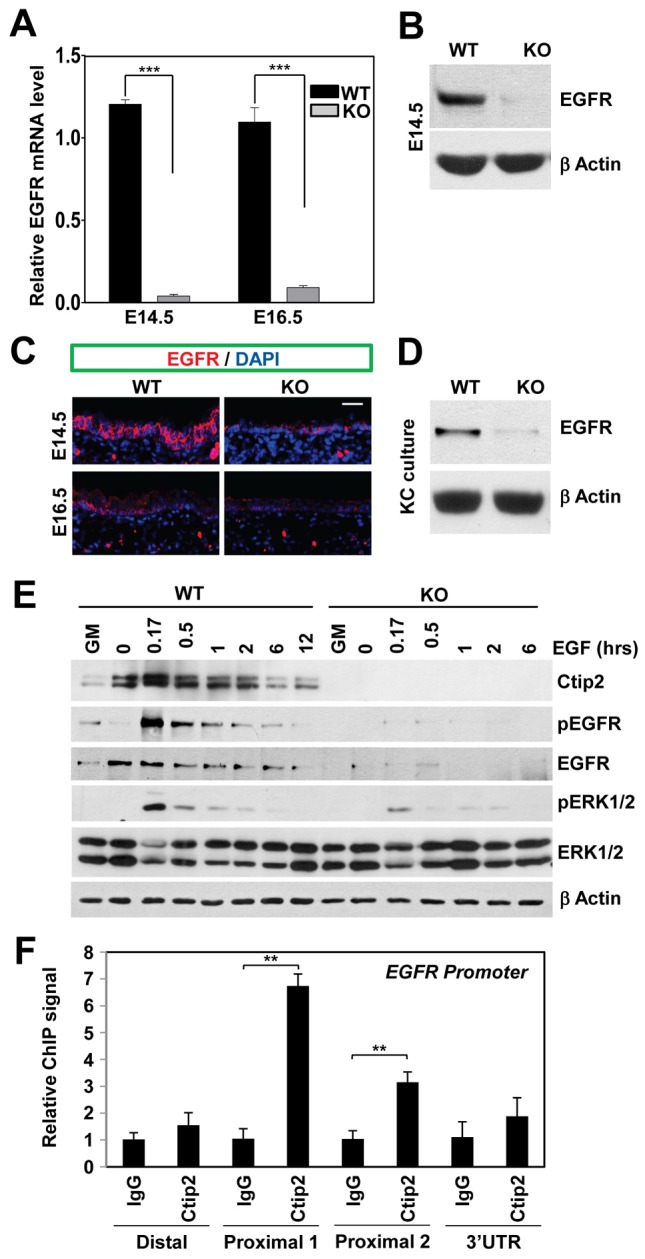
Ctip2 modulates EGF signaling by positively regulating EGFR expression. (A) E14.5 and E16.5 embryonic skin was harvested from WT and KO embryos for RT-qPCR analyses (normalized to GAPDH). Bars represent mean expression levels ± s.e.m. (n = 3). (B) Immunoblotting analyses of cell extracts from E14.5 skin using anti-EGFR and β-actin antibodies. (C) Immunofluorescence staining of E14.5 and E16.5 skin sections with anti-EGFR antibody (red); nuclei were counterstained with DAPI (blue). Scale bar: 10 µm. (D) Immunoblot of epidermis from E18.5 WT and KO skin using anti-EGFR antibody. β-actin blot is a loading control. (E) Keratinocytes cultured under growth (GM) conditions were starved overnight, treated with 10 ng/ml EGF for the indicated time before harvesting for immunoblotting analyses using the indicated antibodies. β-actin, loading control. (F) Epidermal keratinocytes from E16.5 WT embryos were subjected to ChIP analyses using an anti-Ctip2 antibody and IgG as a control. Purified chromatin was then analyzed by qPCR using primers covering either the distal or proximal promoters or 3×UTR (untranslated regions) of the EGFR gene. Each bar represents the ChIP signals using anti-Ctip2 relative to signals from non-specific IgG. Statistical analyses were performed using a Student's t-test (**P<0.01). The results are representative of at least three independent studies.
We next examined how EGFR signaling might be altered in the absence of Ctip2. Keratinocytes grown in growth medium (GM) were starved overnight, then treated with EGF. In WT cells, EGFR was completely dephosphorylated after starvation and was rapidly phosphorylated 10 min after EGF treatment, then became gradually dephosphorylated over time (Fig. 5E). However, in KO cells, total EGFR protein levels were very low, leading to almost undetectable phospho-EGFR in all treatments (Fig. 5E). We also verified activation of ERK, a kinase downstream of EGFR signaling (Avraham and Yarden, 2011). In WT cells, ERK1/2 was phosphorylated within 10 min after EGF treatment, whereas ERK1/2 activation was greatly impaired in the Ctip2 KO keratinocytes. Activated ERK phosphorylates Elk-1, which in turn induces transcription of its target gene c-fos (Janknecht et al., 1993; Treisman, 1990). We have observed a significant decrease in Elk-1 phosphorylation (supplementary material Fig. S3A) and c-fos induction (supplementary material Fig. S3B) in the KO keratinocyes compared to WT cells. Expression of a group of phosphatases including MKP3, PppR2b, PppR2c and PppR2c2 (Kim et al., 2003; Letourneux et al., 2006) that dephosphorylate ERK1/2 remained unaltered in Ctip2-KO cells (supplementary material Fig. S3C).
Our data indicated that Ctip2 positively regulated EGFR expression under proliferative conditions. ChIP analyses using multiple primer sets revealed that Ctip2 was recruited to the proximal EGFR promoter in keratinocytes from E16.5 WT skin (Fig. 5F), but not in keratinocytes from Ctip2 KO skin used as a control (supplementary material Fig. S4A). Furthermore, luciferase assays performed on EGFR promoter in WT and Ctip2 KO keratinocytes, revealed induction of the EGFR promoter by Ctip2 (supplementary material Fig. S4B). These results suggest that Ctip2 is a direct and positive regulator of EGFR expression, which impacts the activity of downstream effectors in the EGF signaling pathways.
Ctip2 directly regulates Notch1 expression and controls keratinocyte differentiation
Induction of Notch1 upon differentiation is required for keratinocytes to withdraw from cell cycle and enter early differentiation (Artavanis-Tsakonas et al., 1999; Rangarajan et al., 2001). Here we have demonstrated that removal of growth factors alone is sufficient to withdraw proliferative keratinocytes from cell cycle and trigger early differentiation, as was seen by strong induction of K10 expression in WT keratinocytes after starvation (Fig. 6A, Fig. 3A). In contrast, K10 induction was significantly reduced in Ctip2-KO keratinocytes after starvation (Fig. 6A, Fig. 3A), indicating that entry into early differentiation was impaired in absence of Ctip2. Notch1 mRNA and protein levels were induced after starvation in WT cells, whereas Notch1 induction was significantly blocked in Ctip2-KO keratinocytes (Fig. 6B,C). Differentiation induced by starvation was stalled by re-exposing WT keratinocytes to EGF, as was evidenced by downregulation of K10 expression after EGF treatment in starved cells (Fig. 6D). As expected, we found that Notch1 expression was downregulated in starved WT cells treated with EGF (Fig. 6E; supplementary material Fig. S5A). However, Ctip2-null cells, which expressed lower levels of Notch1 after starvation, failed to downregulate Notch1 expression further at either the mRNA or protein levels upon EGF treatment (Fig. 6E; supplementary material Fig. S5A, respectively). These results suggest that induction of Notch1 expression upon early differentiation, as well as response of Notch pathway to growth factor (EGF) signaling is dependent on Ctip2.
Fig. 6.

Ctip2 directly regulates Notch1 expression in differentiated cells. (A) Subconfluent keratinocytes were cultured in growth medium (GM) or in starvation medium (SM) without added growth factors for 24 hrs before RT-qPCR analyses for K10 mRNA expression. Results shown are means ± s.e.m. (n = 3; normalized to GAPDH; ***P<0.0001). (B) RT-qPCR analyses of Notch1 mRNA levels (normalized to GAPDH) in keratinocytes cultured in GM or SM conditions. Results are shown as means ± s.e.m. (n = 3; *P<0.01). (C) Keratinocytes cultured in GM or SM conditions were subjected to immunoblotting analyses using anti-Notch1 and β-actin antibodies. (D) Starved keratinocytes were treated with or without 10 ng/ml EGF for 24 hrs before being subjected to RT-qPCR analyses of K10 expression (normalized to GAPDH). Results are shown as means ± s.e.m. (n = 3). (E) Starved keratinocytes treated with or without EGF were subjected to RT-qPCR analyses of Notch1 mRNA expression (normalized to GAPDH). Results are shown as means ± s.e.m. (n = 3). (F) Immunostaining of the E14.5 and E16.5 skin sections with an anti-Notch1 antibody (red); nuclei were counterstained with DAPI (blue). Scale bar: 10 µm. (G) Notch1 protein expression was analyzed by immunoblotting of whole cell extracts from E14.5 and E16.5 skin using anti-Notch1 and anti-β actin antibodies. (H) Starved keratinocytes treated with 0.2 mM CaCl2 (HiCa) for the indicated times were subjected to ChIP analyses using anti-Ctip2 antibody or IgG (rat) as a control. The purified chromatin was analyzed by qPCR using primers covering the distal promoter, the proximal promoter or 3′ UTR region of the Notch1 gene. Each bar represents the ChIP signals using anti-Ctip2 relative to signals from non-specific IgG. (I) Starved keratinocytes were treated with 10 ng/ml EGF for the indicated times, and then subjected to ChIP analyses as described above. Statistical significance was determined using Student's unpaired t-test. The results are representative of at least three independent studies.
Immunohistochemical (Fig. 6F) and immunoblotting (Fig. 6G) studies revealed that Notch1 was strongly expressed in E14.5 epidermis of WT skin, whereas Notch1 expression was reduced in Ctip2-null epidermis at E14.5 (Fig. 6F). Similar to EGFR (Fig. 5E), Notch1 expression was downregulated at E16.5 compared to E14.5 in WT epidermis (Fig. 6F,G). These data suggest that Ctip2 positively regulates Notch1 expression in differentiating keratinocytes. ChIP analyses performed on starved keratinocytes demonstrated that Ctip2 interacted with the Notch1 promoters in the vicinity of the transcriptional start site (TSS) of Notch1 (Fig. 6H; supplementary material Fig. S5B), suggesting that the regulation of Notch1 by Ctip2 is direct. Ctip2 remained bound to Notch1 promoters also after subsequent high calcium treatments (Fig. 6H; supplementary material Fig. S5B). In contrast, ChIP analyses performed on Ctip2 KO keratinocytes revealed no significant enrichment of Ctip2 on Notch1 promoters (supplementary material Fig. S5C). Treatment of starved keratinocytes with EGF for 60 min resulted in the dismissal of Ctip2 from the Notch1 promoter (Fig. 6I). Luciferase assays performed in WT and Ctip2 KO keratinocytes, revealed a Ctip2-dependent positive regulation of Notch1 expression (supplementary material Fig. S5D). These results suggest that Ctip2 directly and positively regulates Notch1 expression during keratinocyte differentiation, and dysregulation of Notch1 expression may underlie the differentiation phenotype of skin lacking Ctip2.
Regulation of Ctip2 expression by EGF and calcium signaling in murine keratinocytes
Downregulation of Ctip2 expression in vivo during later stages of epidermal development, prompted us to hypothesize that expression of Ctip2 is regulated by EGF–EGFR and calcium signaling pathways in epidermal keratinocytes. To test that, reverse transcription-quantitative polymerase chain reaction (RT-qPCR) and western blot analyses of Ctip2 expression was performed in cultured keratinocytes under proliferating and differentiating conditions. Prolonged treatment of starved keratinocytes with either EGF (Fig. 7A, left panels) or high calcium (Fig. 7A, right panels) lead to downregulation of Ctip2 protein levels. RT-qPCR analyses revealed that the level of Ctip2 transcripts was also downregulated by EGF treatment (Fig. 7B), whereas high calcium had no or little effects on Ctip2 transcript levels during this time-frame (Fig. 7C), suggesting that Ctip2 might be degraded at protein level by calcium signaling.
Fig. 7.
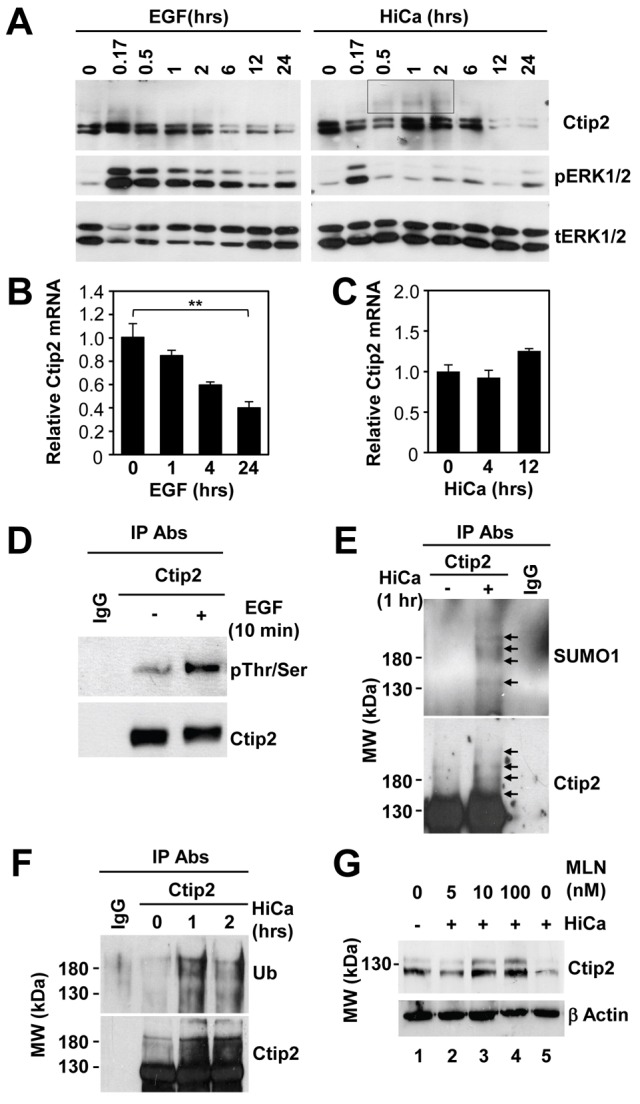
Differential regulation of Ctip2 levels in keratinocytes by EGF and calcium signaling pathways. (A) Starved WT mouse keratinocytes were treated with 10 ng/ml EGF (left panel) or 0.2 mM CaCl2 (right panel) for the indicated times before immunoblotting analyses using antibodies against Ctip2, phospho-ERK or total ERK. (B,C) Starved WT keratinocytes were treated with either 10 ng/ml EGF (B) or 0.2 mM CaCl2 (HiCa; C) for the indicated time before RT-qPCR analyses of Ctip2 mRNA levels (normalized to GAPDH). Results are shown as means ± s.e.m. (n = 3; **P<0.001). (D) Primary mouse keratinocytes transfected with FLAG-Ctip2 were treated with 10 ng/ml EGF or left untreated for 10 min before immunoprecipitation (IP) analyses using Ctip2 antibody or IgG as control. The immunoprecipitates were probed with an anti-phospho-serine/threonine antibody (the upper blot). The blot was stripped and reprobed with the anti-Ctip2 antibody (the lower blot). Note that phosphorylation caused a small reduction in the electrophoretic mobility of Ctip2 on SDS-PAGE; see also 10 min (0.17 hr) time-point in A. (E,F) Primary keratinocytes transfected with FLAG-Ctip2 were treated with high calcium (HiCa) or left untreated for the indicated times before IP analyses (as above). Immunoprecipitates were probed with an anti-SUMO1 antibody to detect SUMOylated Ctip2 (E, the upper blot) or anti-ubiquitin antibody to detect ubiquitinated Ctip2 (F, the upper blot). The blots were then stripped and reprobed with the anti-Ctip2 antibody (the lower blots). (G) Starved WT keratinocytes were left untreated (lane 1) or were treated with high calcium (lanes 2–5) in presence of the indicated amount of proteasome inhibitor MLN2238 (lane 2–4) for 12 hrs. Cells were then subjected to immunoblotting analyses using anti-Ctip2 antibody. β-Actin, loading control. All experiments were performed in triplicate.
MAPKs are involved in regulation of growth as well as differentiation of keratinocytes. Consistent with previous reports (Schmidt et al., 2000), ERK was activated within 10 min by both EGF and high calcium treatments (Fig. 7A). ERK activation by HiCa was weak and transient, whereas EGF induced notably stronger and more sustained activation of ERK1/2 (Fig. 7A). We found that EGF treatment induced robust phosphorylation of Ctip2 in cultured keratinocytes (Fig. 7A,D), whereas phosphorylation of Ctip2 induced by HiCa treatment appeared to be much weaker. Ctip2 was also phosphorylated in vivo in skin at E14.5 and E16.5, a stage at which EGFR was highly expressed and EGFR signaling was activated (supplementary material Fig. S6A,B).
We noticed the appearance of slowly migrating species of Ctip2 within 30 min to 2 hours after HiCa treatment (Fig. 7A, in box), which were not evident during EGF treatment. We hypothesized that Ctip2 might be targeted to degradation through SUMO–ubiquitin pathway in differentiating keratinocytes in response to high calcium. To test that hypothesis, we performed immunoprecipitation of transfected FLAG–Ctip2 followed by immunoblotting analyses using an anti-SUMO1 antibody on cells treated with HiCa (see Materials and Methods). Our results demonstrated that these slower migrating species corresponded to SUMOylated FLAG–Ctip2 (Fig. 7E). Probing of immunoprecipitated FLAG–Ctip2 with anti-ubiquitin antibody (Fig. 7F) also revealed the appearance of a smear of ubiquitinated Ctip2 after HiCa treatment. In addition, treatment with proteasome inhibitor MLN2238 blocked degradation of endogenous Ctip2 by high calcium in a dose-dependent manner (Fig. 7G). Furthermore, in vivo sumoylation and ubiquitination of endogenous Ctip2 were also detected in cell lysates from either E16.5 or E18.5 keratinocytes (supplementary material Fig. S6C,D). Together, these data indicate that calcium signaling induces the sumoylation and ubiquitination of Ctip2, followed by its proteosomal degradation. Downregulation of Ctip2 expression by EGF appears to occur at the mRNA level via a different mechanism(s).
Discussion
Skin epidermis provides a well-characterized model system in which the complex biological functions of the transcriptional regulator Ctip2 have been investigated. Here, we investigate the mechanisms underlying Ctip2 function in epidermal proliferation and differentiation using both in vivo and in vitro approaches. We demonstrate that Ctip2 contributes to the regulation of: (1) keratinocyte proliferation and survival via EGF–EGFR signaling, (2) the proliferation–differentiation switch, and (3) entry into and maintenance of the early and late keratinocytic differentiation programs by controlling the expression of Notch1. We also discovered a novel pathway of negative feedback regulation of expression of Ctip2 by EGF–EGFR signaling during keratinocyte proliferation and calcium signaling during terminal differentiation, which appear to control mRNA and protein levels, respectively.
Multiple roles of Ctip2 during epidermal development
The skin phenotype of Ctip2-null mice is characterized by hypoplastic epidermis throughout all epidermal development stages due to defective proliferation and a delayed differentiation program (Golonzhka et al., 2009). Our previous results have demonstrated a cell autonomous, as well as a non-cell autonomous role of Ctip2 in mediating epidermal homeostasis.
Here, we sought to establish the cell intrinsic role of Ctip2 in epidermal keratinocytes in cultured epidermal keratinocytes in vitro. Ctip2-null keratinocytes exhibited drastic growth defects which were due to impaired proliferation as well as increased cellular apoptosis. Early differentiation was induced after depletion of growth factors, and the subsequent high-calcium treatment facilitated the onset of late differentiation. In contrast to WT keratinocytes, Ctip2-null cells failed to response properly to starvation/HiCa-induced differentiation. These results suggest inherent properties of Ctip2 to control keratinocyte proliferation and differentiation. In addition, Ctip2-null keratinocytes exhibited defects in cytoskeletal structures and organization that might contribute to defective keratinocyte migration. Furthermore, results suggest that Ctip2, in a cell autonomous manner, plays a role in maintaining the epithelial identity of keratinocytes in culture by regulating expression of a subset of genes such as Snail1, TGFβ1, TGFβ2 and K8 (Batlle et al., 2000; Cano et al., 2000; Masszi et al., 2003), all of which are upregulated in absence of Ctip2.
We observed a delay of around two days (from E14.5 to E16.5) in the formation of the epidermal intermediate layers in Ctip2 mutants. This developmental delay, as opposed to an absolute block, suggests the existence of a compensatory pathway that can partially rescue the loss of Ctip2. Indeed, expression of highly related protein Ctip1/Bcl11a was upregulated in the Ctip2-null epidermis, indicating that upregulation of Ctip1 may have partially compensated for the loss of Ctip2 (Golonzhka et al., 2009; data not shown). Therefore, a double knockout of both Ctip2 and Ctip1 genes in the developing epidermis will be useful to assess the functional redundancy between the two highly related proteins and to determine the compensatory effects arising due to loss of either one of them.
Ctip2 controls keratinocytes proliferation and survival in the developing epidermis by direct regulation of EGFR signaling
Disruption of EGFR gene in mice lead to open-eye phenotype, epithelial immaturity and dysfunction during development (Miettinen et al., 1995; Sibilia and Wagner, 1995; Threadgill et al., 1995), which are very similar to the phenotypic spectrum observed in Ctip2-null mice (Golonzhka et al., 2009). In the present study, we demonstrated that EGFR (Erbb1) was downregulated in Ctip2-null epidermis as early as E14.5. In contrast, expression of other members of the receptor tyrosine kinase gene family, including Erbb2, Erbb3 and Erbb4 (Schlessinger, 2000), was unaltered in the mutant epidermis. In consistent with impaired EGFR activation, we have also observed impaired activation or induction of several signaling molecules downstream of EGFR signaling, including ERK1/2, Elk-1 and c-Fos (Miettinen et al., 1995; Murillas et al., 1995). Expression of a group of phosphatases that can dephosphorylate ERK1/2 (Kim et al., 2003; Letourneux et al., 2006) remained unaltered in Ctip2-null keratinocytes, suggesting that impaired ERK activation could be a more direct effect of impaired EGFR expression and/or subsequent activation in keratinocytes lacking Ctip2.
ChIP analyses and reporter gene studies revealed that Ctip2 is recruited to the EGFR promoter and contributes to the induction of EGFR expression in epidermal keratinocytes. Ctip2 was found to be phosphorylated upon activation of EGFR signaling in cultured keratinocytes, as well as in developing epidermis. Together, these results suggest that Ctip2 regulates EGF–EGFR signaling by positively regulating EGFR expression through a direct binding to EGFR promoter.
Ctip2 controls a keratinocyte proliferation–differentiation switch, and mediates differentiation by direct regulation of Notch1 expression in the developing epidermis
High levels of Notch1 were detected in the suprabasal spinous cells in E14.5 WT epidermis, in which Notch1 promotes terminal differentiation (Artavanis-Tsakonas et al., 1999; Nickoloff et al., 2002; Nicolas et al., 2003; Okuyama et al., 2004; Rangarajan et al., 2001). Regulation of keratinocyte differentiation by Notch is achieved by induction of a Notch-specific differentiation program and also by independent induction of genes promoting cell cycle arrest, such as p21, a cyclin/CDK inhibitor (Rangarajan et al., 2001). In agreement with previous reports, we found that Notch1 was reversibly induced after removal of GFs (differentiating condition), and this was compromised in absence of Ctip2. We also demonstrated that Ctip2 was required for downregulation of Notch1 expression induced by EGF treatment, which may result from EGF-induced repression of Ctip2 transcript levels.
Notch1 is under the control of multiple signaling pathways in keratinocytes. Previous reports have shown that p53 positively regulates Notch1 transcription in response to genotoxic stress and in tumors (Yugawa et al., 2007), whereas another p53 family transcription factor, p63, transcriptionally represses Notch1 expression in proliferating keratinocytes (Yugawa et al., 2010). EGFR signaling regulates Notch1 gene expression negatively and indirectly by transcriptional suppression of p53, and downregulation of EGFR expression in differentiating keratinocytes may contribute to derepression of Notch1 gene expression (Kolev et al., 2008). Here we present a novel mechanism(s) of regulation of Notch1 expression by Ctip2 during keratinocyte differentiation. ChIP analyses on Notch1 promoter in differentiating or EGF treated proliferating keratinocytes indicated that Ctip2 contributes to the regulation of Notch1 expression during differentiation and proliferative signal negatively regulates Ctip2 occupancy on Notch1 promoter. Together, results suggest that Ctip2 may be the key effector molecule involved in the negative regulation of Notch1 expression by EGFR signaling.
Ctip2 expression is regulated by EGF–EGFR signaling in proliferating cells and by calcium signaling in differentiated keratinocytes
Ctip2 and EGFR are highly expressed in keratinocytes at E14.5 and loss of Ctip2 resulted in a dramatic downregulation of EGFR expression. Conversely, persistent activation of EGFR led to downregulation of Ctip2 mRNA and protein expression, which may ultimately compromise EGFR expression and dampen EGF signaling. These data indicate that Ctip2 may serve as an important component in the EGF signaling pathways during epidermal development and in regeneration after injury. In this context, Ctip2 is necessary for induction of EGFR, thereby facilitating EGF signaling, and downregulation of Ctip2 expression, which occurs after persistent EGFR activation, would serve to limit EGF-induced proliferation.
Ctip2 levels in primary keratinocytes decreased during terminal differentiation induced by high calcium, and this effect appeared to be at the protein, rather than the mRNA level. High calcium treatment induced Ctip2 SUMOylation, which may result from transient upregulation of genes encoding components of the SUMOylation machinery (Deyrieux et al., 2007). High levels of Ca2+ also promoted Ctip2 ubiquitination, and it is conceivable that SUMOylation and ubiquitination of Ctip2 may be linked processes through the action of unknown member of the RING-finger ubiquitin ligase family (Geoffroy and Hay, 2009; Lallemand-Breitenbach et al., 2008; Tatham et al., 2008). SUMO-targeted ubiquitin ligases (STUbL proteins) recognize SUMOylated substrates, and catalyze the de-sumoylation and ubiquitination of these substrates, the latter of which may target the protein for degradation via the proteasomal pathway. A recent study has reported Ctip2 SUMOylation and ubiquitination in thymocytes (Zhang et al., 2012). In addition, ubiquitination and proteosomal degradation of anti-apoptotic Bcl2 protein has been observed in human dermal papilla cells and in keratinocytes (Luanpitpong et al., 2012; Luanpitpong et al., 2011). In this respect, Ctip2 may be similar to the transcription factor ΔNp63, which is also expressed predominantly in basal layer of epidermis, and is downregulated in differentiating keratinocytes by SUMO-conjugation and proteasomal degradation in response to high calcium (Vivo et al., 2009). Future studies are needed to dissect the exact mechanism of Ctip2 SUMOylation, ubiquitination and degradation in differentiating keratinocytes.
Our results indicate that calcium signaling is critical in downregulation of Ctip2 in differentiating keratinocytes. Indeed, the time-frame of Ctip2 downregulation correlated well with the formation of a calcium gradient during late stages of epidermal development. It has been demonstrated that an epidermal Ca2+ gradient develops late in gestation, coincident with the emergence of a competent permeability barrier (Elias et al., 1998). Considered together, these results infer that Ctip2 expression is downregulated by EGFR signaling in basal keratinocytes during epidermal development, whereas high calcium levels trigger Ctip2 protein degradation in differentiating layers of epidermis.
In summary, keratinocytic Ctip2 is an important regulator of epidermal keratinocyte proliferation, survival, and differentiation. The role of Ctip2 in the keratinocyte lineage is consistent with that of a molecular switch, which triggers onset of differentiation, maintains early differentiation events, and promotes late terminal differentiation. We propose that in proliferative cells, Ctip2 interacts with the EGFR promoter and positively regulates EGFR expression, therefore promoting keratinocyte proliferation and survival (Fig. 8). Activated EGFR signaling also promotes Ctip2 phosphorylation and reduces Ctip2 expression at the mRNA level. Upon depletion of growth factors, corresponding to the exit of cells from the basal compartment, Ctip2 is recruited to the Notch1 promoter, positively regulating the expression of Notch1 and triggers the onset of early differentiation. Subsequently, elevated extracellular calcium levels facilitate onset of late differentiation, which is coincident with SUMOylation, ubiquitination, and degradation of Ctip2. Continuous activation of EGFR signaling in basal layer and subsequent formation of a prominent calcium gradient in differentiated cells both trigger downregulation of Ctip2, leading to decreased expression of EGFR and Notch1 expression, respectively. Future studies are necessary to understand the mechanisms of regulation of Ctip2 by EGFR signaling during keratinocyte proliferation and by Ca2+ signaling during epidermal differentiation.
Fig. 8.
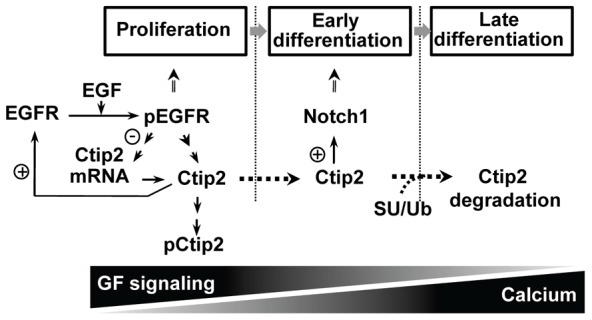
Model for Ctip2 functions in the proliferation and differentiation of epidermal keratinocytes. In proliferative keratinocytes, Ctip2 interacts with the EGFR promoter and positively regulates EGFR expression, thereby promoting keratinocyte proliferation and survival. Activated EGFR signaling also promotes Ctip2 phosphorylation and inhibits Ctip2 expression at the mRNA level (proliferating conditions). Keratinocytes entering spinous layers after exiting the basal layer express both Ctip2 and Notch1. Upon depletion of growth factors from cultured keratinocytes, equivalent to the exit of cells from the basal compartment, Ctip2 is recruited to the Notch1 promoter, positively regulating the expression of Notch1 and triggering onset of early differentiation. Subsequently elevated extracellular calcium levels facilitates onset of late differentiation and Ctip2 is degraded by high-calcium signaling through the SUMO–Ub–proteasomal pathway.
Materials and Methods
Mice and primary mouse keratinocyte culture
Ctip2−/− mice were described previously (Golonzhka et al., 2009). Primary mouse keratinocytes were isolated from newborn skin from wild-type (WT) or Ctip2-null (KO) pups. Newborn pups were killed by decapitation, and the trunk skin was removed and incubated with 1 mg/ml dispase in CnT07 medium (CELLNTEC) at 4°C overnight. The epidermis was then separated from the dermis and incubated with TrypLE Select (Invitrogen) for 20 min at room temperature. Separated keratinocytes were then collected by centrifugation and seeded at a density of 3×10⁴ cells/cm2 in culture vessel containing growth medium that consisted of EMEM (no calcium; Enzo Life Science), 5% chelexed FBS, 10 ng/ml EGF (BD Biosciences, no. 354001), 0.04 mM CaCl2, and antibiotics. Chelexed FBS was prepared by mixing 1 litr of FBS (Hyclone, no. SH30071.03) with 100 g chelex resin (Bio-Rad no. 142-2842) as described by Yuspa's group (Lichti et al., 2008). Cells were cultivated in humidified atmosphere of 95% air and 5%, at 35°C with 5% CO2, and fresh medium were replenished every other day.
To induce differentiation in vitro, cultured keratinocytes were starved overnight with low calcium EMEM without added growth factors. The extracellular calcium level was then elevated to 0.2 mM to promote terminal differentiation.
To evaluate proteasomal degradation of Ctip2, primary mouse keratinocytes cultured 3∼4 days (∼80% confluency) were starved overnight then treated with 0.2 mM calcium (HiCa) together with or without MLN2238, a proteasomal inhibitor (Selleck Chemicals), for 12 hrs prior to lysis for immunoblotting analyses.
Antibodies
Histology and immunohistochemistry
Dorsal skin samples from embryonic mice were fixed with 4% PFA and embedded in paraffin. For histology analyses, deparaffinized slides were subjected to Hematoxylin/Eosin staining, and epidermal thickness was determined at regular intervals of Hematoxylin/Eosin-stained sections using bright-field microscopy and the Leica OneSuite software. For immunohistochemical analyses, the deparaffinized slides were first subjected to antigen retrieval by microwaving for 20 min at high power in citrate buffer (pH 6.0). Slides were then blocked with 10% normal goat serum for 1 hr at room temperature before sequentially incubating with primary antibodies overnight at 4°C and Cy2- or Cy3-coupled secondary antibodies for 2 hrs at room temperature. Nuclei were counter-stained with DAPI using standard procedures.
Immunocytochemistry
Primary keratinocytes were seeded onto a coverglass that had been coated with gelatin in a 24-well plate. After the indicated treatments, cells were fixed in 4% PFA for 15 min at room temperature, then permeabilized with 0.2% Triton X-100 in PBS for 5 min at room temperature. cells were then blocked in 10% normal goat serum for 1 hour. Cells were then subjected to immunofluorescence analysis with indicated primary antibodies followed by appropriate, Cy2- or Cy3-coupled secondary antibodies. Nuclei were counter-stained with DAPI.
Immunoblotting analysis
Cultured keratinocytes or embryonic skins were lysed directly with a denaturing buffer consisting of 300 mM NaCl, 2 mM EDTA, 20 mM Hepes, 1% SDS, 0.1 mM hemin chloride, 5 mM NEM, 20 mM NaF supplemented with a complete protease inhibitor cocktail. Lysates were boiled for 3 min, sonicated, and centrifuged to remove DNA and cell debris. Protein concentrations were measured by BCA protein assay kit (Thermo Scientific Inc., Rockford, IL), and equal amounts of protein were run on 10% SDS-polyacrylamide gels, followed by transfer to nitrocellulose membranes and probing with different antibodies.
MTT cell proliferation assay
Primary mouse keratinocytes were seeded at a density of 2.5×10⁴ per well (100 µl) in 96-well plates that had been coated with type IV collagen. Cells were allowed to attach for 24 hrs before changing the medium, which was subsequently changed every other day. MTT assays were performed according to manufacturer's instructions (Promega).
BrdU labeling of S-phase cells
Primary keratinocytes were grown on coverslips and incubated for 30 min with 10 µM 5-bromo-2′-deoxyuridine (BrdU), followed by fixation in 4% PFA/PBS. Fixed cells were treated with 0.2 M HCl for 30 min at room temperature followed by neutralization with a borate buffer. Cells were then permeabilized with 0.1% Triton X-100, and subjected to standard immunocytochemistry procedures as described above using an anti-BrdU antibody. Immune complexes were revealed using a Cy3-conjugated anti-rat secondary antibody. Nuclei were counter-stained with DAPI.
TUNEL assay for apoptosis
Primary keratinocytes on coverslips were fixed in 4% PFA, and cells were subjected to TUNEL staining using the fluorometric TUNEL system (Promega, no. TB235).
Reverse transcription-quantitative PCR analyses
Total cellular RNA was extracted using the RNAeasy reagent (Qiagen) and 500 ng of RNA was reverse transcribed using Superscript III RNase H reverse transcriptase (Invitrogen) and oligo(dT) primers (Invitrogen). All of the primers used for real-time PCR were designed to span at least one exon to minimize the possibility of nonspecific amplification from the genomic DNA. Specific primer sequences and qPCR conditions are shown in supplementary material Table S2. Quantitative, real-time PCR was performed using SYBR Green Mix (Qiagen) on an ABI 7500 real-time PCR instrument. The thermal profile included 95°C for 15 min, 45 cycles of denaturation at 95°C for 10 s, annealing at 58°C for 30 s, and extension at 72°C for 35 s. Reactions were run in triplicate and HPRT was used as a reference gene to normalize data. The mean threshold cycle (Ct) for individual reactions was determined using the ABI sequence analysis software.
Chromatin immunoprecipitation
Each chromatin immunoprecipitation (ChIP) assay was carried out using primary mouse keratinocytes grown on one 10 cm plate. Cells were crosslinked with 1% formaldehyde in PBS for 10 min at room temperature, after which glycine was added to 0.125 mM to quench the crosslinking. Cells were subsequently lysed in 1 ml of lysis buffer (10 mM Tris-HCl pH 7.5, 10 mM NaCl, 3 mM MgCl2, 0.5% NP40) supplemented with complete protease inhibitor cocktail (Fermentas). The resulting cell nuclei were resuspended in ChIP sonication buffer (1% Triton X-100, 0.1% SDS, 0.1% deoxycholate, 50 mM Tris 8.1, 150 mM NaCl, 5 mM EDTA) and sonicated to an average fragment size of 500 bp using Branson Sigital Sonifier (17% amplitude; Brason Ultrasonic Corporation). 100 µg of soluble chromatin solution was subjected to chromatin immunoprecipitation as previously described (Zhang et al., 2009). Immunoprecipitated DNA was then purified by use of a Qiagen DNA purification kit and the recovered DNA was amplified by qPCR using primers specific for the distal or proximal regions (relative to transcription start site of each gene) of the promoters of EGFR, Notch1 and K8, as well as primer sets for 3′ UTR (untranslated regions) of each gene. Primer sequences and location on gene promoter are available in supplementary material Table S3.
Transfection and immunoprecipitation
Approximately 4×10⁶ freshly isolated mouse keratinocytes were transfected with 5 µg of an expression vector encoding FLAG–Ctip2 (in pcDNA3) using the Neon transfection system (Invitrogen). Transfected cells were seeded onto collagen-coated 10 cm plates. The medium was replenished 24 hrs after transfection. Forty-eight hours after transfection, cells were starved overnight, then treated with EGF or high calcium for various times before harvesting for immunoprecipitation experiments. FLAG–Ctip2 was immunoprecipitated from clarified cell extracts prepared in 20 mM HEPES, pH 7.4, 250 mM NaCl, 50 mM NaF, 2 mM EDTA, 5 mM N-ethylmaleimide, 100 µM hemin chloride, 0.05% Nonidet P-40 (NP40), 100 µM PMSF, supplemented with a complete protease inhibitor cocktail.
Dual-luciferase reporter assay
The EGFR promoter reporter construct (EGFR-Luc) was prepared by inserting a fragment corresponding to the mouse EGFR (Erbb1) gene from −3120 to +154 relative to the transcriptional start site into the KpnI and XhoI sites of the promoterless luciferase reporter plasmid, pGL3-Basic (Promega). The Notch1 promoter reporter construct (Notch1-Luc) was preprared by inserting a fragment from the mouse Notch1 locus, −4138 to +207, into the MluI and XhoI sites of pGL3-Basic. The insertion of each promoter sequence was verified by DNA sequencing. Approximately 5×10⁴ primary mouse keratinocytes were co-transfected with 200 ng EGFR or Notch1 promoter reporters, 20 ng FLAG-Ctip2 (in pcDNA3) or empty vector, and a Renilla luciferase construct (8 ng; for normalization) using the Neon transfection system (Invitrogen). Each transfection was performed in triplicate, and transfected cells were seed onto collagen-coated, 96-well plates. The medium was replenished every day and cells were subjected to dual-luciferase reporter assay (Promega) 48 hrs after transfection using a synergy HT Multi-Mode microplate Reader (BioTek Instruments).
Supplementary Material
Acknowledgments
We gratefully acknowledge Xiaobo Liang, Stephen Hyter and Gunjan Guha for help with breeding and genotyping. We sincerely thank Dr Walter Vogel for sharing the coordinates of Ctip2 interaction with the Notch1 locus in thymocytes prior to publication, and Drs Molly Kulesz-Martin and Yuangang Liu for critical reading of the manuscript. We thank Dr Daniel Metzger and Jean-Marc Bornert (IGBMC, Illkirch, France) for help in making the Ctip2 mutant mice and Drs Mark Zabriskie and Gary DeLander of the OSU College of Pharmacy for continuous support and encouragement.
Footnotes
Funding
These work was supported by the National Institute of Arthritis and Musculoskeletal and Skin Diseases [grant number AR056008 to A.I.]; National Institute of Environmental Health Sciences Center grant [grant number ES00210 to Oregon State University Environmental Health Sciences Center]; and an Oregon Health & Science University, Knight Cancer Center P30CA069533 grant funded by the National Cancer Institute. Deposited in PMC for release after 12 months.
Supplementary material available online at http://jcs.biologists.org/lookup/suppl/doi:10.1242/jcs.108969/-/DC1
References
- Albu D. I., Feng D., Bhattacharya D., Jenkins N. A., Copeland N. G., Liu P., Avram D. (2007). BCL11B is required for positive selection and survival of double-positive thymocytes. J. Exp. Med. 204, 3003–3015 10.1084/jem.20070863 [DOI] [PMC free article] [PubMed] [Google Scholar]
- Artavanis–Tsakonas S., Rand M. D., Lake R. J. (1999). Notch signaling: cell fate control and signal integration in development. Science 284, 770–776 10.1126/science.284.5415.770 [DOI] [PubMed] [Google Scholar]
- Avraham R., Yarden Y. (2011). Feedback regulation of EGFR signalling: decision making by early and delayed loops. Nat. Rev. Mol. Cell Biol. 12, 104–117 10.1038/nrm3048 [DOI] [PubMed] [Google Scholar]
- Batlle E., Sancho E., Francí C., Domínguez D., Monfar M., Baulida J., García De Herreros A. (2000). The transcription factor Snail is a repressor of E-cadherin gene expression in epithelial tumour cells. Nat. Cell Biol. 2, 84–89 10.1038/35000034 [DOI] [PubMed] [Google Scholar]
- Byrne C., Hardman M., Nield K. (2003). Covering the limb – formation of the integument. J. Anat. 202, 113–123 10.1046/j.1469-7580.2003.00142.x [DOI] [PMC free article] [PubMed] [Google Scholar]
- Cano A., Pérez–Moreno M. A., Rodrigo I., Locascio A., Blanco M. J., del Barrio M. G., Portillo F., Nieto M. A. (2000). The transcription factor snail controls epithelial-mesenchymal transitions by repressing E-cadherin expression. Nat. Cell Biol. 2, 76–83 10.1038/35000025 [DOI] [PubMed] [Google Scholar]
- Carpenter G., Cohen S. (1979). Epidermal growth factor. Annu. Rev. Biochem. 48, 193–216 10.1146/annurev.bi.48.070179.001205 [DOI] [PubMed] [Google Scholar]
- Chang L., Goldman R. D. (2004). Intermediate filaments mediate cytoskeletal crosstalk. Nat. Rev. Mol. Cell Biol. 5, 601–613 10.1038/nrm1438 [DOI] [PubMed] [Google Scholar]
- Deyrieux A. F., Rosas–Acosta G., Ozbun M. A., Wilson V. G. (2007). Sumoylation dynamics during keratinocyte differentiation. J. Cell Sci. 120, 125–136 10.1242/jcs.03317 [DOI] [PMC free article] [PubMed] [Google Scholar]
- Elias P. M., Nau P., Hanley K., Cullander C., Crumrine D., Bench G., Sideras–Haddad E., Mauro T., Williams M. L., Feingold K. R. (1998). Formation of the epidermal calcium gradient coincides with key milestones of barrier ontogenesis in the rodent. J. Invest. Dermatol. 110, 399–404 10.1046/j.1523-1747.1998.00151.x [DOI] [PubMed] [Google Scholar]
- Fromm J. A., Johnson S. A., Johnson D. L. (2008). Epidermal growth factor receptor 1 (EGFR1) and its variant EGFRvIII regulate TATA-binding protein expression through distinct pathways. Mol. Cell. Biol. 28, 6483–6495 10.1128/MCB.00288-08 [DOI] [PMC free article] [PubMed] [Google Scholar]
- Fuchs E., Raghavan S. (2002). Getting under the skin of epidermal morphogenesis. Nat. Rev. Genet. 3, 199–209 10.1038/nrg758 [DOI] [PubMed] [Google Scholar]
- Geoffroy M. C., Hay R. T. (2009). An additional role for SUMO in ubiquitin-mediated proteolysis. Nat. Rev. Mol. Cell Biol. 10, 564–568 10.1038/nrm2707 [DOI] [PubMed] [Google Scholar]
- Golonzhka O., Leid M., Indra G., Indra A. K. (2007). Expression of COUP-TF-interacting protein 2 (CTIP2) in mouse skin during development and in adulthood. Gene Expr. Patterns 7, 754–760 10.1016/j.modgep.2007.06.002 [DOI] [PMC free article] [PubMed] [Google Scholar]
- Golonzhka O., Liang X., Messaddeq N., Bornert J. M., Campbell A. L., Metzger D., Chambon P., Ganguli–Indra G., Leid M., Indra A. K. (2009). Dual role of COUP-TF-interacting protein 2 in epidermal homeostasis and permeability barrier formation. J. Invest. Dermatol. 129, 1459–1470 10.1038/jid.2008.392 [DOI] [PMC free article] [PubMed] [Google Scholar]
- Hager B., Bickenbach J. R., Fleckman P. (1999). Long-term culture of murine epidermal keratinocytes. J. Invest. Dermatol. 112, 971–976 10.1046/j.1523-1747.1999.00605.x [DOI] [PubMed] [Google Scholar]
- Janknecht R., Ernst W. H., Pingoud V., Nordheim A. (1993). Activation of ternary complex factor Elk-1 by MAP kinases. EMBO J. 12, 5097–5104 [DOI] [PMC free article] [PubMed] [Google Scholar]
- Kastner P., Chan S., Vogel W. K., Zhang L. J., Topark–Ngarm A., Golonzhka O., Jost B., Le Gras S., Gross M. K., Leid M. (2010). Bcl11b represses a mature T-cell gene expression program in immature CD4+CD8+ thymocytes. Eur. J. Immunol. 40, 2143–2154 10.1002/eji.200940258 [DOI] [PMC free article] [PubMed] [Google Scholar]
- Kim Y., Rice A. E., Denu J. M. (2003). Intramolecular dephosphorylation of ERK by MKP3. Biochemistry 42, 15197–15207 10.1021/bi035346b [DOI] [PubMed] [Google Scholar]
- Kobielak A., Fuchs E. (2004). α-catenin: at the junction of intercellular adhesion and actin dynamics. Nat. Rev. Mol. Cell Biol. 5, 614–625 10.1038/nrm1433 [DOI] [PMC free article] [PubMed] [Google Scholar]
- Kolev V., Mandinova A., Guinea–Viniegra J., Hu B., Lefort K., Lambertini C., Neel V., Dummer R., Wagner E. F., Dotto G. P. (2008). EGFR signalling as a negative regulator of Notch1 gene transcription and function in proliferating keratinocytes and cancer. Nat. Cell Biol. 10, 902–911 10.1038/ncb1750 [DOI] [PMC free article] [PubMed] [Google Scholar]
- Lallemand–Breitenbach V., Jeanne M., Benhenda S., Nasr R., Lei M., Peres L., Zhou J., Zhu J., Raught B., de Thé H. (2008). Arsenic degrades PML or PML-RARα through a SUMO-triggered RNF4/ubiquitin-mediated pathway. Nat. Cell Biol. 10, 547–555 10.1038/ncb1717 [DOI] [PubMed] [Google Scholar]
- Leid M., Ishmael J. E., Avram D., Shepherd D., Fraulob V., Dollé P. (2004). CTIP1 and CTIP2 are differentially expressed during mouse embryogenesis. Gene Expr. Patterns 4, 733–739 10.1016/j.modgep.2004.03.009 [DOI] [PMC free article] [PubMed] [Google Scholar]
- Letourneux C., Rocher G., Porteu F. (2006). B56-containing PP2A dephosphorylate ERK and their activity is controlled by the early gene IEX-1 and ERK. EMBO J. 25, 727–738 10.1038/sj.emboj.7600980 [DOI] [PMC free article] [PubMed] [Google Scholar]
- Li L., Tennenbaum T., Yuspa S. H. (1996). Suspension-induced murine keratinocyte differentiation is mediated by calcium. J. Invest. Dermatol. 106, 254–260 10.1111/1523-1747.ep12340654 [DOI] [PubMed] [Google Scholar]
- Li L., Leid M., Rothenberg E. V. (2010a). An early T cell lineage commitment checkpoint dependent on the transcription factor Bcl11b. Science 329, 89–93 10.1126/science.1188989 [DOI] [PMC free article] [PubMed] [Google Scholar]
- Li P., Burke S., Wang J., Chen X., Ortiz M., Lee S. C., Lu D., Campos L., Goulding D., Ng B. L.et al. (2010b). Reprogramming of T cells to natural killer-like cells upon Bcl11b deletion. Science 329, 85–89 10.1126/science.1188063 [DOI] [PMC free article] [PubMed] [Google Scholar]
- Lichti U., Anders J., Yuspa S. H. (2008). Isolation and short-term culture of primary keratinocytes, hair follicle populations and dermal cells from newborn mice and keratinocytes from adult mice for in vitro analysis and for grafting to immunodeficient mice. Nat. Protoc. 3, 799–810 10.1038/nprot.2008.50 [DOI] [PMC free article] [PubMed] [Google Scholar]
- Luanpitpong S., Nimmannit U., Chanvorachote P., Leonard S. S., Pongrakhananon V., Wang L., Rojanasakul Y. (2011). Hydroxyl radical mediates cisplatin-induced apoptosis in human hair follicle dermal papilla cells and keratinocytes through Bcl-2-dependent mechanism. Apoptosis 16, 769–782 10.1007/s10495-011-0609-x [DOI] [PMC free article] [PubMed] [Google Scholar]
- Luanpitpong S., Chanvorachote P., Nimmannit U., Leonard S. S., Stehlik C., Wang L., Rojanasakul Y. (2012). Mitochondrial superoxide mediates doxorubicin-induced keratinocyte apoptosis through oxidative modification of ERK and Bcl-2 ubiquitination. Biochem. Pharmacol. 83, 1643–1654 10.1016/j.bcp.2012.03.010 [DOI] [PMC free article] [PubMed] [Google Scholar]
- Mack J. A., Anand S., Maytin E. V. (2005). Proliferation and cornification during development of the mammalian epidermis. Birth Defects Res. C Embryo Today 75, 314–329 10.1002/bdrc.20055 [DOI] [PubMed] [Google Scholar]
- Masszi A., Di Ciano C., Sirokmány G., Arthur W. T., Rotstein O. D., Wang J., McCulloch C. A., Rosivall L., Mucsi I., Kapus A. (2003). Central role for Rho in TGF-β1-induced α-smooth muscle actin expression during epithelial-mesenchymal transition. Am. J. Physiol. Renal Physiol. 284, F911–F924 10.1152/ajprenal.00183.2002 [DOI] [PubMed] [Google Scholar]
- Miettinen P. J., Berger J. E., Meneses J., Phung Y., Pedersen R. A., Werb Z., Derynck R. (1995). Epithelial immaturity and multiorgan failure in mice lacking epidermal growth factor receptor. Nature 376, 337–341 10.1038/376337a0 [DOI] [PubMed] [Google Scholar]
- Missero C., Di Cunto F., Kiyokawa H., Koff A., Dotto G. P. (1996). The absence of p21Cip1/WAF1 alters keratinocyte growth and differentiation and promotes ras-tumor progression. Genes Dev. 10, 3065–3075 10.1101/gad.10.23.3065 [DOI] [PubMed] [Google Scholar]
- Müller E. J., Williamson L., Kolly C., Suter M. M. (2008). Outside-in signaling through integrins and cadherins: a central mechanism to control epidermal growth and differentiation? J. Invest. Dermatol. 128, 501–516 10.1038/sj.jid.5701248 [DOI] [PubMed] [Google Scholar]
- Murillas R., Larcher F., Conti C. J., Santos M., Ullrich A., Jorcano J. L. (1995). Expression of a dominant negative mutant of epidermal growth factor receptor in the epidermis of transgenic mice elicits striking alterations in hair follicle development and skin structure. EMBO J. 14, 5216–5223 [DOI] [PMC free article] [PubMed] [Google Scholar]
- Nickoloff B. J., Qin J. Z., Chaturvedi V., Denning M. F., Bonish B., Miele L. (2002). Jagged-1 mediated activation of notch signaling induces complete maturation of human keratinocytes through NF-κB and PPARγ. Cell Death Differ. 9, 842–855 10.1038/sj.cdd.4401036 [DOI] [PubMed] [Google Scholar]
- Nicolas M., Wolfer A., Raj K., Kummer J. A., Mill P., van Noort M., Hui C. C., Clevers H., Dotto G. P., Radtke F. (2003). Notch1 functions as a tumor suppressor in mouse skin. Nat. Genet. 33, 416–421 10.1038/ng1099 [DOI] [PubMed] [Google Scholar]
- Okuyama R., Nguyen B. C., Talora C., Ogawa E., Tommasi di Vignano A., Lioumi M., Chiorino G., Tagami H., Woo M., Dotto G. P. (2004). High commitment of embryonic keratinocytes to terminal differentiation through a Notch1-caspase 3 regulatory mechanism. Dev. Cell 6, 551–562 10.1016/S1534-5807(04)00098-X [DOI] [PubMed] [Google Scholar]
- Quelle F. W., Thierfelder W., Witthuhn B. A., Tang B., Cohen S., Ihle J. N. (1995). Phosphorylation and activation of the DNA binding activity of purified Stat1 by the Janus protein-tyrosine kinases and the epidermal growth factor receptor. J. Biol. Chem. 270, 20775–20780 10.1074/jbc.270.35.20775 [DOI] [PubMed] [Google Scholar]
- Rangarajan A., Talora C., Okuyama R., Nicolas M., Mammucari C., Oh H., Aster J. C., Krishna S., Metzger D., Chambon P.et al. (2001). Notch signaling is a direct determinant of keratinocyte growth arrest and entry into differentiation. EMBO J. 20, 3427–3436 10.1093/emboj/20.13.3427 [DOI] [PMC free article] [PubMed] [Google Scholar]
- Sayama K., Yamamoto M., Shirakata Y., Hanakawa Y., Hirakawa S., Dai X., Tohyama M., Tokumaru S., Shin M. S., Sakurai H.et al. (2010). E2 Polyubiquitin-conjugating enzyme Ubc13 in keratinocytes is essential for epidermal integrity. J. Biol. Chem. 285, 30042–30049 10.1074/jbc.M110.106484 [DOI] [PMC free article] [PubMed] [Google Scholar]
- Schlessinger J. (2000). Cell signaling by receptor tyrosine kinases. Cell 103, 211–225 10.1016/S0092-8674(00)00114-8 [DOI] [PubMed] [Google Scholar]
- Schmidt M., Goebeler M., Posern G., Feller S. M., Seitz C. S., Brocker E. B., Rapp U. R., Ludwig S. (2000). Ras-independent activation of the Raf/MEK/ERK pathway upon calcium-induced differentiation of keratinocytes. J. Biol. Chem. 275, 41011–41017 10.1074/jbc.M003716200 [DOI] [PubMed] [Google Scholar]
- Sibilia M., Wagner E. F. (1995). Strain-dependent epithelial defects in mice lacking the EGF receptor. Science 269, 234–238 10.1126/science.7618085 [DOI] [PubMed] [Google Scholar]
- Tatham M. H., Geoffroy M. C., Shen L., Plechanovova A., Hattersley N., Jaffray E. G., Palvimo J. J., Hay R. T. (2008). RNF4 is a poly-SUMO-specific E3 ubiquitin ligase required for arsenic-induced PML degradation. Nat. Cell Biol. 10, 538–546 10.1038/ncb1716 [DOI] [PubMed] [Google Scholar]
- Threadgill D. W., Dlugosz A. A., Hansen L. A., Tennenbaum T., Lichti U., Yee D., LaMantia C., Mourton T., Herrup K., Harris R. C.et al. (1995). Targeted disruption of mouse EGF receptor: effect of genetic background on mutant phenotype. Science 269, 230–234 10.1126/science.7618084 [DOI] [PubMed] [Google Scholar]
- Topley G. I., Okuyama R., Gonzales J. G., Conti C., Dotto G. P. (1999). p21WAF1/Cip1 functions as a suppressor of malignant skin tumor formation and a determinant of keratinocyte stem-cell potential. Proc. Natl. Acad. Sci. USA 96, 9089–9094 10.1073/pnas.96.16.9089 [DOI] [PMC free article] [PubMed] [Google Scholar]
- Treisman R. (1990). The SRE: a growth factor responsive transcriptional regulator. Semin. Cancer Biol. 1, 47–58 [PubMed] [Google Scholar]
- Verdoni A. M., Ikeda S., Ikeda A. (2010). Serum response factor is essential for the proper development of skin epithelium. Mamm. Genome 21, 64–76 10.1007/s00335-009-9245-y [DOI] [PMC free article] [PubMed] [Google Scholar]
- Vivo M., Di Costanzo A., Fortugno P., Pollice A., Calabrò V., La Mantia G. (2009). Downregulation of ΔNp63α in keratinocytes by p14ARF-mediated SUMO-conjugation and degradation. Cell Cycle 8, 3545–3551 10.4161/cc.8.21.9954 [DOI] [PubMed] [Google Scholar]
- Yugawa T., Handa K., Narisawa–Saito M., Ohno S., Fujita M., Kiyono T. (2007). Regulation of Notch1 gene expression by p53 in epithelial cells. Mol. Cell. Biol. 27, 3732–3742 10.1128/MCB.02119-06 [DOI] [PMC free article] [PubMed] [Google Scholar]
- Yugawa T., Narisawa–Saito M., Yoshimatsu Y., Haga K., Ohno S., Egawa N., Fujita M., Kiyono T. (2010). ΔNp63α repression of the Notch1 gene supports the proliferative capacity of normal human keratinocytes and cervical cancer cells. Cancer Res. 70, 4034–4044 10.1158/0008-5472.CAN-09-4063 [DOI] [PubMed] [Google Scholar]
- Zenz R., Scheuch H., Martin P., Frank C., Eferl R., Kenner L., Sibilia M., Wagner E. F. (2003). c-Jun regulates eyelid closure and skin tumor development through EGFR signaling. Dev. Cell 4, 879–889 10.1016/S1534-5807(03)00161-8 [DOI] [PubMed] [Google Scholar]
- Zhang L. J., Liu X., Gafken P. R., Kioussi C., Leid M. (2009). A chicken ovalbumin upstream promoter transcription factor I (COUP-TFI) complex represses expression of the gene encoding tumor necrosis factor α-induced protein 8 (TNFAIP8). J. Biol. Chem. 284, 6156–6168 10.1074/jbc.M807713200 [DOI] [PMC free article] [PubMed] [Google Scholar]
- Zhang L. J., Vogel W. K., Liu X., Topark–Ngarm A., Arbogast B. L., Maier C. S., Filtz T. M., Leid M. (2012). Coordinated regulation of transcription factor Bcl11b activity in thymocytes by the mitogen-activated protein kinase (MAPK) pathways and protein sumoylation. J. Biol. Chem. 287, 26971–26988 10.1074/jbc.M112.344176 [DOI] [PMC free article] [PubMed] [Google Scholar]
Associated Data
This section collects any data citations, data availability statements, or supplementary materials included in this article.