Abstract
CD26 is an activation marker of human CD4+ T cells, and is associated with T-cell signal transduction processes as a co-stimulatory molecule. We have previously demonstrated that high CD26 cell surface expression on CD4+ T cells is correlated with the production of T helper type 1 cytokines, whereas CD26+ T helper cells stimulate antibody synthesis in B cells. Although the cellular and molecular mechanisms involved in CD26-mediated CD4+ T-cell activation have been extensively evaluated by our group and others, the role of CD26 in CD8+ T cells has not been clearly elucidated. In the present study, we examine the effector function of CD8+ T cells via CD26-mediated co-stimulation in comparison with CD28-mediated co-stimulation. We found that CD26high CD8+ T cells belong to the early effector memory T-cell subset, and that CD26-mediated co-stimulation of CD8+ T cells exerts a cytotoxic effect preferentially via granzyme B, tumour necrosis factor-α, interferon-γ and Fas ligand. The effector function associated with CD26-mediated co-stimulation is enhanced compared with that obtained through CD28-mediated co-stimulation, suggesting that the CD26 co-stimulation pathway in CD8+ T cells is distinct from the CD28 co-stimulation pathway. Targeting CD26 in CD8+ T cells therefore has the potential to be useful in studies of immune responses to new vaccine candidates as well as innovative therapy for immune-mediated diseases.
Keywords: CD26/dipeptidyl peptidase 4, CD8, cytotoxic T-lymphocyte effect, effector memory, granzyme B
Introduction
In addition to being a marker of T-cell activation, CD26 is associated with T-cell signal transduction processes as a co-stimulatory molecule, and the enzymatic activity of CD26 appears to play an important role in enhancing cellular responses to external stimuli.1 Whereas CD26 expression is increased following activation of resting T cells, CD4+ CD26high T cells respond maximally to recall antigens such as tetanus toxoid.2 Moreover, cross-linking of CD26 and CD3 with solid-phase immobilized monoclonal antibodies (mAbs) can induce T-cell co-stimulation and interleukin-2 (IL-2) production by CD26+ T cells.1 High CD26 cell surface expression in CD4+ T cells is correlated with the production of T helper type 1 (Th1) cytokines and high migratory activity, whereas CD26+ T helper cells stimulate antibody synthesis in B cells.1 Recently, we have demonstrated that caveolin-1 is a co-stimulatory ligand for CD26 in CD4+ T cells, and that CD26 on activated memory CD4+ T cells interacts with caveolin-1 on tetanus toxoid-loaded monocytes.3,4 Moreover, following CD26–caveolin-1 interaction on tetanus toxoid-loaded monocytes, caveolin-1 is phosphorylated, with linkage to nuclear factor-κB activation, followed by up-regulation of CD86, a ligand for CD28.5,6 Taking into account the data that effector T cells in inflamed lesions express high levels of CD26, it is conceivable that CD4+ CD26+ T cells play an important role in the inflammatory process.
It has been recently reported that influenza-specific CD8 ‘memory’ T cells express high levels of CD26, whereas CD8+ T cells specific for chronically infecting viruses such as cytomegalovirus, Epstein–Barr virus and HIV do not express CD26.7 This suggests that high expression of CD26 on CD8+ T cells may offer a specific marker of successful memory development. More recently, it has been shown that terminally differentiated effector memory cells (CD45RA+ CCR7−) among CD8+ CD26+ T cells are markedly increased in patients with type 1 diabetes, suggesting that the pathogenesis of type 1 diabetes might be associated with life-long stimulation by protracted antigen exposure or a homeostatic defect in the regulation/contraction of immune responses.8
Although the above studies analysed the phenotype of CD26-expressing CD8+ T cells, more extensive research is required to fully characterize the phenotype of CD8+ CD26+ T cells and cellular function of CD8+ T cells via CD26-mediated co-stimulation. In the present study, to explore the immunological role of CD26-expressing CD8+ T cells, we examined the effector function of CD8+ T cells via CD26-mediated co-stimulation in comparison with CD28-mediated co-stimulation. We found that CD26high CD8+ T cells are among the subset of early effector memory T cells, and that CD26-mediated co-stimulation in CD8+ T cells exerts cytotoxic effects preferentially via granzyme B, tumour necrosis factor-α (TNF-α), interferon-γ (IFN-γ) and Fas ligand (FasL). The effector function associated with CD26-mediated co-stimulation is enhanced in comparison with that obtained with CD28-mediated co-stimulation.
Materials and methods
Cells and antibodies
Human CD3+ T cells or CD8+ T cells were purified from peripheral blood mononuclear cells (PBMC) of healthy adult volunteers after their documented informed consent was obtained. This study has been performed according to the Declaration of Helsinki, and the process involved has also been approved by the institutional review board. For purification, a MACS human Pan T-cell Isolation kit or MACS human CD8+ T-cell Isolation kit (Miltenyi Biotec, Bergisch Gladbach, Germany) was used. Non-CD8+ T cells, namely CD4+ T cells, monocytes, neutrophils, eosinophils, B cells, stem cells, dendritic cells, natural killer cells, granulocytes, γδ T cells or erythroid cells were specifically depleted by using antibodies against CD4, CD15, CD16, CD19, CD34, CD36, CD56, CD123, T-cell recptor-γδ and CD235a. Purity of CD3+ T cells or CD8+ T cells was ≥ 99% or ≥ 95%, respectively, as confirmed by FACSCalibur (BD Biosciences, San Jose, CA). No cytotoxic lymphocytes other than CD8+ T cells, such as natural killer cells, were detected in the purified CD8+ T-cell fraction. For cell stimulation, anti-CD3 mAb (OKT3), anti-CD28 mAb (4B10) and anti-CD26 mAb (1F7) were developed in our laboratory. Other antibodies used for flow cytometry were purchased from BD Biosciences. In experiments involving CD26-positive or negative selection, purified CD8+ T cells were further separated into positively or negatively selected fractions using anti-CD26 mAb (5F8) and anti-mouse IgG1-conjugated magnetic beads (Miltenyi Biotec). 5F8 was developed in our laboratory, and exerts no effect on CD26+ T-cell function, as well as having no cross-reaction with 1F7.9
Detection of intracellular cytotoxic granules
Purified CD8+ T cells (1 × 10⁵) were cultured in serum-free AIM-V medium (Invitrogen, Carlsbad, CA) in 96-well flat-bottom plates (Costar, Corning Incorporated, Corning, NY), with stimulatory mAbs being bound in the wells beforehand at the following concentrations; 0·5 μg/ml of OKT3, and/or 2, 5, 10, 20 or 50 μg/ml of 4B10 or 1F7. Cells were cultured in a 5% CO2 and 100% humidified incubator at 37° for the indicated time intervals, and cells were then prepared for analysis of intracellular perforin (PRF), granzyme A (GzmA) or granzyme B (GzmB) using a BD Cytofix/Cytoperm Plus Fixation/Permeabilization kit (BD Biosciences). The data obtained were analysed with flowjo software (Tree Star, Inc., Ashland, OR ).
Measurement of cytokines
Purified CD8+ T cells (1 × 10⁵) were incubated with plate-bound OKT3 (0·5 μg/ml) and/or 4B10 (5 μg/ml) or 1F7 (5 μg/ml) in 96-well flat-bottom plates for 48, 72, 96 or 120 hr. After incubation, supernatants were collected and cytokine concentrations were examined using ELISA. BD OptEIA kits for human IL-2, TNF-α or IFN-γ were purchased from BD Biosciences, and a FasLigand/TNFSF6 DuoSet for soluble FasL (sFasL) was purchased from R&D Systems (Minneapolis, MN).
Quantitative real-time reverse transcription-PCR assay
Purified CD8+ T cells (6 × 10⁵) were incubated with plate-bound OKT3 (0·5 μg/ml) and/or 4B10 (5 μg/ml) or 1F7 (5 μg/ml) in 24-well flat-bottom plates (Costar) for 12, 24, 48 or 72 hr. After incubation, cells were collected and total RNA was extracted using an RNeasy Micro kit according to the manufacturer's instructions (QIAGEN, Valencia, CA). Complementary DNA was produced using a PrimeScript II 1st strand cDNA Synthesis kit (TaKaRa Bio, Shiga, Japan) with oligo-dT primer. Quantification of mRNA was performed using the 7500 Real-Time PCR System and SYBR Select Master Mix (Applied Biosystems, Foster City, CA). The data obtained were analysed with 7500 System SDS Software (Applied Biosystems), being normalized to hypoxanthine phosphoribosyltransferase (HPRT) expression. The PCR was performed using the following primers: TNF-α forward primer, 5′-TCAGCCTCTTCTCCTTCCTG-3′; reverse primer, 5′-TTTGCTACAACATGGGCTACA-3′; IFN-γ forward primer, 5′-GTGTGGAGACCATCAAGGAAG-3′; reverse primer, 5′-ATGTATTGCTTTGCGTTGGA-3′; FasL forward primer, 5′-TGGGGATGTTTCAGCTCTTC-3′; reverse primer, 5′-TGGACCTTGAGTTGGACTTG-3′; IL-2 forward primer, 5′-AGAAGGCCACAGAACTGAAAC-3′; reverse primer, 5′-GCTGTCTCATCAGCATATTCAC-3′; HPRT1 forward primer, 5′-CAGTCAACAGGGGACATAAAAG-3′; reverse primer, 5′-CCTGACCAAGGAAAGCAAAG-3′.
Mixed lymphocyte reaction assay
Purified CD8+ T cells (1 × 10⁶) were incubated with plate-bound OKT3 (0·5 μg/ml) and/or 4B10 (5 μg/ml) or 1F7 (5 μg/ml) in 24-well flat-bottom plates for 72 hr. The incubated effector CD8+ T cells were co-cultured in 96-well V-bottom plates (NUNC, Roskilde, Denmark) with AIM-V medium admixed with carboxyfluorescein succinimidyl ester (CFSE) -labelled U937 cells (1 × 10⁵) as target cells. CFSE labelling of U937 cells was conducted using a Vybrant CFDASE Cell Tracer kit (Molecular Probes, Eugene, OR) according to the manufacturer's instructions. The number of target cells was fixed at 1 × 10⁵/well in the present experiments, and effector to target (E : T) cell ratios were 1 : 1, 2 : 1, or 4 : 1. For the inhibition assays, Granzyme B Inhibitor 1 (200 μm; Calbiochem, San Diego, CA) or neutralizing anti-FasL mAb (10 μg/ml; BD Biosciences) was added to the medium for incubation at an E : T ratio of 2 : 1. After 16 hr of co-culture, cells were harvested and stained with an Annexin V-PE Apoptosis Detection kit I (BD Biosciences). CFSE-positive cells (U937 target cells) were gated in and Annexin V-positive and 7-amino-actinomycin D (7-AAD) -positive cells were detected using FACSCalibur, with data being analysed with FlowJo software.
Statistics
The paired Student's t-test (two-tailed) was used for the comparison of group values. The assay was performed in triplicate wells, and data are presented as mean ± SE of triplicate samples of independent experiments. Significance was analysed using ms-excel (Microsoft, Redmond, WA), and values of P < 0·01 were considered significant and indicated in the corresponding figures and figure legends.
Results
Human CD26high CD8+ T cells belong to an early effector memory subset
To characterize the phenotype of CD26-expressing CD8+ T cells, we first used flow cytometry to conduct cell surface marker analysis of CD8+ T cells derived from human PBMC. As shown in Fig. 1(a), CD8+ T cells were divided into four subsets of CD26high CD28+, CD26int CD28+, CD26− CD28+ and CD26− CD28− populations. For further examination, we performed multi-colour analysis by flow cytometry of these four populations. As shown in Fig. 1(b), CD26high (exclusively CD28+) CD8+ T cells were enriched in the CD45RA− CCR7− population (82·3 ± 1·7%, n = 5) (Fig. 1b-i), whereas CD26int (exclusively CD28+) CD8+ T cells were enriched in the CD45RA+ CCR7+ population (78·2 ± 2·8%, n = 5) (Fig. 1b-ii). Moreover, CD26− CD28+ or CD26− CD28− CD8+ T cells were enriched in CD45RA− and CD45RA+ CCR7− (62·5 ± 5·9% and 24·7 ± 2·0%, respectively, n = 4) (Fig. 1b-iii), or CD45RA+ CCR7− population (71·7 ± 4·9%, n = 4) (Fig. 1b-iv), respectively. These data indicate that CD26high CD8+ T cells are effector memory (EM) cells and that CD26int CD8+ T cells are naive cells.10
Figure 1.
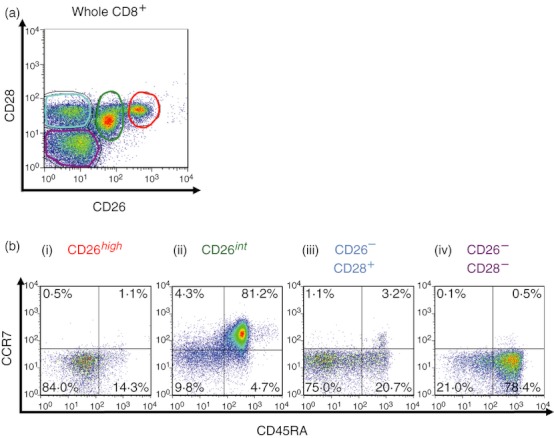
CD26high CD8+ T cells are an effector memory subset, as characterized by cell surface marker analysis. Purified CD8+ T cells from peripheral blood mononuclear cells were stained with CD26, CD28, CD45RA, and CCR7 monoclonal antibodies. Cells were then analysed by multi-colour flow cytometry. (a) Two-dimensional (2D) dot blot of CD26 or CD28 staining gated for CD8+ T cells, showing a representative plot of five independent donors. (b) 2D-dot blot of CD45RA or CCR7 staining gated for CD26high, CD26int, CD26− CD28+ or CD26− CD28− cells among CD8+ T cells, showing a representative plot of five independent donors.
For further confirmation, we analysed the expression pattern of cytotoxic granules in CD8+ T cells through flow cytometry. Whole CD8+ T cells of human PBMC showed a triphasic pattern of expression for PRF (Fig. 2a-i), and a biphasic pattern of expression for GzmA (Fig. 2a-ii) or GzmB (Fig. 2a-iii), suggesting the presence of heterogeneous populations. Compared with the analysis of cell surface markers of CD8+ T cells, as shown in Fig. 1, we analysed expression levels of PRF, GzmA or GzmB among CD26high CD8+ (exclusively CD28+), CD26int CD8+ (exclusively CD28+), CD26− CD28+ CD8+, or CD26− CD28− CD8+ subsets. CD26high CD8+ T cells were PRFint GzmA+ GzmBlow/− (Fig. 2b-i–iii), whereas CD26int CD8+ T cells were PRF− GzmA− GzmBlow/− (Fig. 2c-i–iii). These data indicate that CD26high CD8+ T cells are an early EM subset and that CD26int CD8+ T cells are a naive or central memory subset.11 On the other hand, CD26− CD28+ CD8+ T cells were composed of PRFint or PRF−, GzmA+ or GzmA−, and GzmBhigh or GzmBlow/− populations (Fig. 2d-i–iii). These data indicate that CD26− CD28+ CD8+ T cells are collective populations rather than a terminally differentiated effector memory (TEMRA) subset.11 In contrast, CD26− CD28− CD8+ T cells contained PRFhigh or PRFint, GzmA+ and GzmBhigh populations (Fig. 2e-i–iii), indicative of TEMRA and late EM subsets.11
Figure 2.
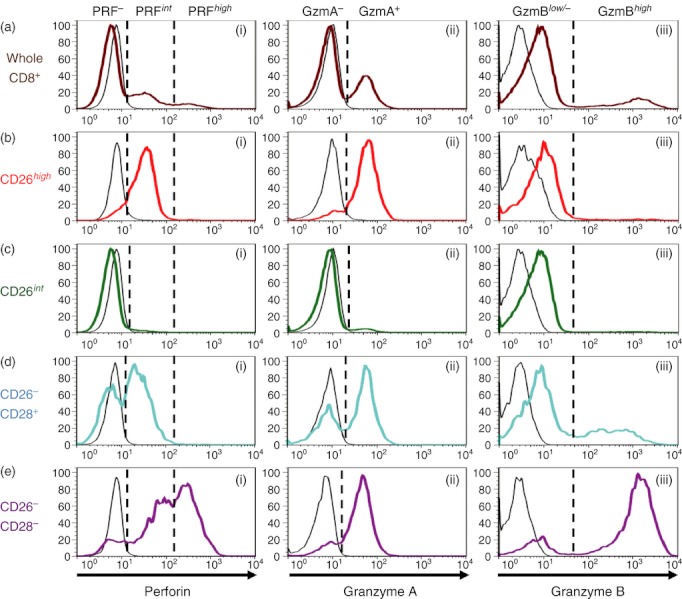
CD26high CD8+ T cells are an early effector memory subset, as characterized by analysis of intracellular cytotoxic granules. Purified CD8+ T cells from peripheral blood mononuclear cells were stained with CD26, CD28, perforin (PRF), granzyme A (GzmA) and granzyme B (GzmB) monoclonal antibodies, and analysed by flow cytometry. Following gating for whole CD8+ population (brown lines in a), CD8+ CD26high population (red lines in b), CD8+ CD26int population (green lines in c), CD8+ CD26− CD28+ population (blue lines in d), or CD8+ CD26− CD28− population (purple lines in e), each subset was analysed for the expression of PRF, GzmA or GzmB. The data are shown as histograms of PRF (i), GzmA (ii), or GzmB (iii) intensity among each subset, representative of eight independent donors. The black lines in each histogram show the data of isotype control.
Taken together, these data indicate that CD26high CD8+ T cells are an early EM subset and CD26int CD8+ T cells are a naive subset, whereas CD28+ CD8+ T cells are composed of heterogeneous subsets. Therefore, these findings strongly suggest that CD26+ CD8+ T cells may have an effector function that is different from that of the CD28+ subset of CD8+ T cells.
CD26-mediated co-stimulation in CD8+ T cells preferentially enhances excretion of GzmB as compared with CD28-mediated co-stimulation
The data above suggest that CD26+ CD8+ T cells have a different effector role from CD28+ CD8+ T cells. To examine the cellular function associated with each co-stimulatory effect, we performed co-stimulation studies using anti-CD3 and/or anti-CD26 or anti-CD28 mAbs. For this purpose, we first performed a cell proliferation assay. As shown in the Supplementary data section, neither whole T cells (pan-T cells) of human PBMC nor purified CD8+ T cells exhibited proliferative activity following stimulation with anti-CD3 mAb alone (see Supplementary material, Fig. S1), whereas both pan-T cells and CD8+ T cells showed equal enhancement of proliferation by anti-CD3 plus anti-CD28 or anti-CD3 plus anti-CD26 co-stimulation (Fig. S1a,b). These data indicate that CD8+ T cells exhibit proliferative activity through either CD26-mediated or CD28-mediated co-stimulation. We next examined production of cytotoxic granules or cytokines in the presence of CD26-mediated or CD28-mediated co-stimulation. For this purpose, we evaluated the expression levels of PRF, GzmA or GzmB in CD8+ T cells. As shown in Fig. 3(a), expression of GzmB in CD8+ T cells was increased following CD26-mediated co-stimulation compared with CD28-mediated co-stimulation at any stimulation intensity (Fig. 3a). Moreover, time–course analysis showed that GzmB expression was greater over the tested time intervals after CD26-mediated co-stimulation than after CD28-mediated co-stimulation (Fig. 3b). In contrast, no difference in the expression of PRF or GzmA was observed following CD26-mediated co-stimulation or CD28-mediated co-stimulation (data not shown).
Figure 3.
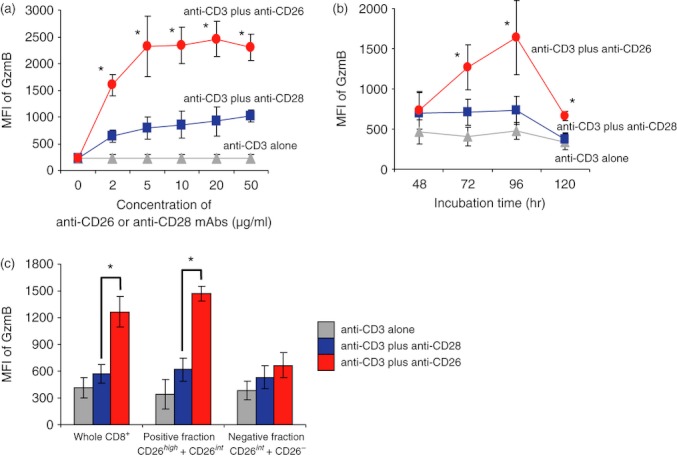
CD26-mediated co-stimulation of CD8+ T cells induces greater Granzyme B expression than CD28-mediated co-stimulation. (a) Purified CD8+ T cells were stimulated with anti-CD3 monoclonal antibodies (mAb) alone, anti-CD3 plus anti-CD28 mAbs, or anti-CD3 plus anti-CD26 mAbs at the indicated concentrations for 72 hr. (b) Purified CD8+ T cells were stimulated with anti-CD3 mAb alone, anti-CD3 plus anti-CD28 mAbs (5 μg/ml), or anti-CD3 plus anti-CD26 mAbs (5 μg/ml) for the indicated time. (c) Purified CD8+ T cells were separated using anti-CD26 mAb (5F8) and anti-mouse IgG1-conjugated magnetic beads as described in the Materials and methods. Whole CD8+ T cells, positively selected cells (positive fraction) or negatively selected cells (negative fraction) were stimulated and incubated by the same method as shown in (b) for 72 hr. Intracellular granzyme B (GzmB) was detected by flow cytometry. Data are shown as mean ± SE of mean fluorescence intensity (MFI) of GzmB from two independent donors (a) and five independent donors (b,c), comparing MFI in anti-CD3 plus anti-CD26 to that in anti-CD3 plus anti-CD28 (*P < 0·01).
To confirm the differences in effector function associated with CD26-mediated co-stimulation in CD26high CD8+ T cells from that of CD26int CD8+ T cells, we examined the expression of GzmB in CD8+ T cells following purification by anti-CD26 mAb and anti-mouse IgG1 microbeads. As shown in the Supplementary material, Fig. S2, both CD26high CD8+ and CD26int CD8+ cells were selected in the positive fraction after purification (Fig. S2b), whereas CD26int CD8+ and CD26− CD8+ cells were contained in the flow-through (negative fraction) (Fig. S2c). Using each positive or negative fraction, expression of GzmB following CD26 or CD28 co-stimulation was analysed. As shown in Fig. 3(c), GzmB was equally expressed in cells of the negative fraction (CD26int CD8+ and CD26− CD8+ cells) either by CD26 co-stimulation or by CD28 co-stimulation. On the other hand, in the positive fraction (mixture of CD26high CD8+ and CD26int CD8+ cells), GzmB expression was much more enhanced by CD26-mediated co-stimulation than by CD28-mediated co-stimulation (* in Fig. 3c). These observations strongly suggest that the CD26high CD8+ subset, but not the CD26int CD8+ subset, is essential to induce distinctive CD26-mediated effector function from CD28-mediated co-stimulation.
In addition to increased GzmB expression, production of TNF-α, IFN-γ and sFasL in CD8+ T cells was greater following CD26 co-stimulation than CD28 co-stimulation (Fig. 4a-i–iii). In contrast with these inflammatory cytokines, production of IL-2 by CD8+ T cells was apparently less following CD26 co-stimulation than the level seen with CD28 co-stimulation (Fig. 4a-iv). The same effect was also found on the cytokine production over a wide range of anti-CD26 and anti-CD28 mAbs tested as well as the induction of GzmB expression (data not shown). To confirm the above results regarding cytokine production, we conducted real-time RT-PCR. As shown in Fig. 4(b), mRNA expression of TNF-α, IFN-γ or IL-2 (but not FasL) was significantly up-regulated following CD28 co-stimulation compared with CD26 co-stimulation at the 12 hr incubation time period. Meanwhile, mRNA expression levels of all the cytokines tested were higher after 72 hr of CD26 co-stimulation than CD28 co-stimulation (Fig. 4b-i–iv). These results correlated with the kinetics of cytokine production shown in Fig. 4(a). Taken together, these data suggest that CD26 co-stimulation results in enhanced CD8+ T-cell effector function by increasing production of GzmB, TNF-α, IFN-γ or sFasL, compared with CD28 co-stimulation.
Figure 4.
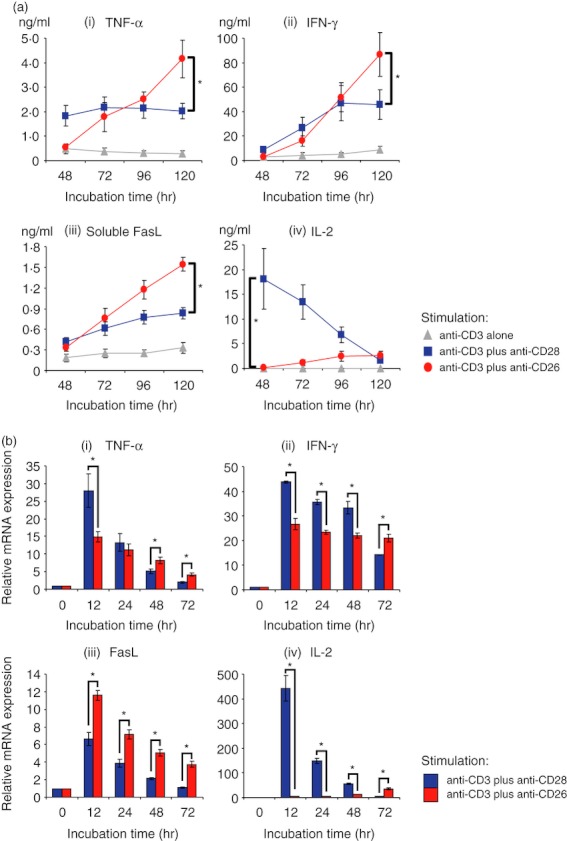
CD26-mediated co-stimulation of CD8+ T cells induces greater levels of tumour necrosis factor-α (TNF-α), interferon-γ (IFN-γ), and soluble Fas ligand (sFasL) than CD28-mediated co-stimulation. Purified CD8+ T cells were stimulated with anti-CD3 monoclonal antibody (mAb) alone, anti-CD3 plus anti-CD28 mAbs, or anti-CD3 plus anti-CD26 mAbs for the indicated times. (a) Concentrations of TNF-α (i), IFN-γ (ii), sFasL (iii) and interleukin-2 (IL-2) (iv) were examined by ELISA. (b) mRNA expression of TNF-α (i), IFN-γ (ii), FasL (iii) and IL-2 (iv) was quantified by real-time RT-PCR. Each expression was normalized to HPRT1 and relative expression levels compared with resting CD8+ T cells (0 hr) were shown. Data are shown as mean ± SE of triplicate wells from six independent donors (a) and shown as mean ± SD of triplicate samples (b), comparing values in anti-CD3 plus anti-CD26 to that in anti-CD3 plus anti-CD28 (*P < 0·01).
CD26-mediated co-stimulation of CD8+ T cells preferentially enhances cytotoxic effect compared with CD28-mediated co-stimulation
Finally, we conducted cytotoxic assays by mixed lymphocyte reaction (MLR) in the presence of CD26-mediated or CD28-mediated co-stimulation. For this purpose, CFSE-labelled U937 cells were co-cultured with activated CD8+ T cells, and then cells were harvested and stained with Annexin V-PE and 7-AAD. CFSE-positive cells (U937) as target cells were gated in to detect Annexin V+ 7-AAD+ dead cells (see Supplementary material, Fig. S3a). As shown in Fig. 5, higher levels of Annexin V+ 7-AAD+ cells were found by CD26-mediated cytotoxic effect than by CD28-mediated effect (* in Fig. 5). This cytotoxic effect of CD8+ T cells induced by CD26-mediated co-stimulation was enhanced with increasing levels of effector cells in a dose-dependent manner (Fig. 5). Moreover, this cytotoxic effect via CD26-mediated co-stimulation was significantly decreased by GzmB inhibitor or anti-FasL neutralizing antibody (Fig. S3b). These data strongly suggest that CD26-mediated co-stimulation is sufficient to induce cytotoxic effector function in CD8+ T cells via GzmB and/or FasL and that the CD26 pathway of co-stimulation is distinctive from the CD28 pathway.
Figure 5.
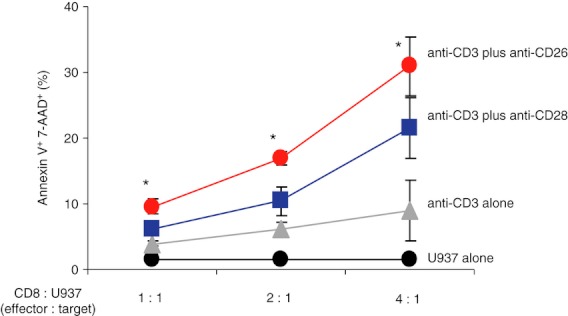
CD26-mediated co-stimulation of CD8+ T cells results in greater cytotoxic effect than CD28-mediated co-stimulation. Stimulated CD8+ T cells and CFSE-labelled U937 cells were used as effector and target cells, respectively. Mixed lymphocyte reaction assay using these effector and target cells was conducted as described in Materials and methods. Data are shown as mean ± SE of % positive cells stained with Annexin V and 7-AAD among CFSE-positive cells (U937 target cells) from four independent donors, comparing percentage of positive cells in anti-CD3 plus anti-CD26 to that in anti-CD3 plus anti-CD28 (*P < 0·01).
Discussion
In the present study, we demonstrate that CD26high CD8+ T cells belong to an early EM subset and that the cytotoxic effect of human CD8+ T cells is exerted in part by CD26-mediated co-stimulation of CD26high CD8+ T cells, resulting in enhanced expression of GzmB, TNF-α, IFN-γ and sFasL.12–14
Analysis of cell surface markers and intracellular cytotoxic granules indicates that CD26high CD8+ T cells exclusively express CD28 and belong to an early EM subset (Figs 1 and 2). In fact, CD26-mediated co-stimulation of CD26high CD8+ T cells induced increased expression levels of GzmB, TNF-α, IFN-γ and sFasL, as well as enhanced cytotoxic effect (Figs 3, 4 and 5). Of note is that CD26-mediated co-stimulation resulted in greater effector function than that induced by CD28-mediated co-stimulation. These findings strongly suggest that the CD26 co-stimulation pathway in CD8+ T cells resulting in enhanced cytotoxic effect is distinct from the CD28 co-stimulation pathway. In contrast to CD26high CD8+ T cells, CD26int CD8+ T cells belong to the naive subset (Figs 1 and 2). Moreover, co-stimulation through either the CD26 or CD28 pathway did not result in differences in effector function of CD26int CD8+ T cells (Fig. 3). Purification of CD26high CD8+ and CD26int CD8+ T cells by cell sorting may be required for more precise analyses of effector function of these two subsets instead of using the MACS separation system.
The expression pattern of cytotoxic granules or cytokines in CD8+ T cells induced by CD26-mediated co-stimulation was clearly distinct from that induced by CD28-mediated co-stimulation. As shown in Figs 3 and 4, GzmB (Fig. 3), TNF-α (Fig. 4a-i), IFN-γ (Fig. 4a-ii) and sFasL (Fig. 4a-iii) levels were higher in CD26-stimulated CD8+ T cells than in CD28-stimulated CD8+ T cells. Moreover, CD26-mediated co-stimulation resulted in greater cytotoxic effect as analysed by MLR assays than CD28-mediated co-stimulation (Fig. 5). These results may be partly because the CD28+ subset in CD8+ T cells is composed of heterogeneous cell populations, whereas the CD26+ CD8+ T cells only consist of an early EM (CD26high) and a naive (CD26int) subset (Figs 1 and 2). Besides differences in cytotoxic effect, IL-2 production in CD8+ T cells was also different in CD26-mediated co-stimulation compared with CD28-mediated co-stimulation (Fig. 4a-iv). Lower production of IL-2 induced by CD26-mediated co-stimulation may produce lower proliferative activity in early phase as shown in Fig. S1 (* at 72 hr). Our present data therefore support the notion that the signalling pathway via CD26 is distinct from signalling induced through the CD28 molecule, as we have previously demonstrated in human CD4+ T cells,15,16 although the exact mechanisms involved remain to be elucidated.
Taken together, our present findings strongly suggest that CD26high CD8+ T cells have a distinctive effector function in humans, and that the CD26-mediated co-stimulation pathway is different from that of CD28. In this regard, CD26high CD8+ T cells may have a key role in acquired immune reactions such as antigen-specific host defence against infection or cancer, and the pathophysiology of autoimmune diseases or transplantation-related immune disorders such as graft-versus-host disease or graft rejection. Therefore, targeting CD26high CD8+ T cells has the potential to be useful in studies of immune responses to new vaccine candidates as well as innovative therapies for immune-mediated diseases.
Acknowledgments
This work was supported by Grant-in-Aid from the Ministry of Education, Science, Sports and Culture (K.O. and C.M.) and the Ministry of Health, Labour and Welfare, (C.M.) Japan.
Conflicts of interests
None.
Disclosure
None.
Supporting Information
Additional Supporting Information may be found in the online version of this article:
Figure S1. CD26-mediated co-stimulation or CD28-mediated co-stimulation equally enhances proliferation of CD8+ T cells as well as CD3+ T cells.
Figure S2. CD26 expression of CD8+ T cells following isolation by anti-human CD26 monoclonal antibody-conjugated magnetic beads.
Figure S3. CD26-mediated co-stimulation enhances cytotoxic function of CD8+ T cells as analysed by mixed lymphocyte reaction assays.
References
- 1.Morimoto C, Schlossman SF. The structure and function of CD26 in the T-cell immune response. Immunol Rev. 1998;161:55–70. doi: 10.1111/j.1600-065x.1998.tb01571.x. [DOI] [PubMed] [Google Scholar]
- 2.Morimoto C, Torimoto Y, Levinson G, Rudd CE, Schrieber M, Dang NH, Letvin NL, Schlossman SF. 1F7, a novel cell surface molecule, involved in helper function of CD4 cells. J Immunol. 1989;143:3430–9. [PubMed] [Google Scholar]
- 3.Ohnuma K, Munakata Y, Ishii T, et al. Soluble CD26/dipeptidyl peptidase IV induces T cell proliferation through CD86 up-regulation on APCs. J Immunol. 2001;167:6745–55. doi: 10.4049/jimmunol.167.12.6745. [DOI] [PubMed] [Google Scholar]
- 4.Ohnuma K, Yamochi T, Uchiyama M, et al. CD26 up-regulates expression of CD86 on antigen-presenting cells by means of caveolin-1. Proc Natl Acad Sci USA. 2004;101:14186–91. doi: 10.1073/pnas.0405266101. [DOI] [PMC free article] [PubMed] [Google Scholar]
- 5.Ohnuma K, Yamochi T, Uchiyama M, et al. CD26 mediates dissociation of Tollip and IRAK-1 from caveolin-1 and induces upregulation of CD86 on antigen-presenting cells. Mol Cell Biol. 2005;25:7743–57. doi: 10.1128/MCB.25.17.7743-7757.2005. [DOI] [PMC free article] [PubMed] [Google Scholar]
- 6.Ohnuma K, Uchiyama M, Yamochi T, et al. Caveolin-1 triggers T-cell activation via CD26 in association with CARMA1. J Biol Chem. 2007;282:10117–31. doi: 10.1074/jbc.M609157200. [DOI] [PubMed] [Google Scholar]
- 7.Ibegbu CC, Xu YX, Fillos D, Radziewicz H, Grakoui A, Kourtis AP. Differential expression of CD26 on virus-specific CD8+ T cells during active, latent and resolved infection. Immunology. 2009;126:346–53. doi: 10.1111/j.1365-2567.2008.02899.x. [DOI] [PMC free article] [PubMed] [Google Scholar]
- 8.Matteucci E, Ghimenti M, Di Beo S, Giampietro O. Altered proportions of naive, central memory and terminally differentiated central memory subsets among CD4+ and CD8+ T cells expressing CD26 in patients with type 1 diabetes. J Clin Immunol. 2011;31:977–84. doi: 10.1007/s10875-011-9573-z. [DOI] [PubMed] [Google Scholar]
- 9.Torimoto Y, Dang NH, Tanaka T, Prado C, Schlossman SF, Morimoto C. Biochemical characterization of CD26 (dipeptidyl peptidase IV): functional comparison of distinct epitopes recognized by various anti-CD26 monoclonal antibodies. Mol Immunol. 1992;29:183–92. doi: 10.1016/0161-5890(92)90099-j. [DOI] [PubMed] [Google Scholar]
- 10.Sallusto F, Lenig D, Forster R, Lipp M, Lanzavecchia A. Two subsets of memory T lymphocytes with distinct homing potentials and effector functions. Nature. 1999;401:708–12. doi: 10.1038/44385. [DOI] [PubMed] [Google Scholar]
- 11.Takata H, Takiguchi M. Three memory subsets of human CD8+ T cells differently expressing three cytolytic effector molecules. J Immunol. 2006;177:4330–40. doi: 10.4049/jimmunol.177.7.4330. [DOI] [PubMed] [Google Scholar]
- 12.Medema JP, Toes RE, Scaffidi C, et al. Cleavage of FLICE (caspase-8) by granzyme B during cytotoxic T lymphocyte-induced apoptosis. Eur J Immunol. 1997;27:3492–8. doi: 10.1002/eji.1830271250. [DOI] [PubMed] [Google Scholar]
- 13.Scaffidi C, Fulda S, Srinivasan A, et al. Two CD95 (APO-1/Fas) signaling pathways. EMBO J. 1998;17:1675–87. doi: 10.1093/emboj/17.6.1675. [DOI] [PMC free article] [PubMed] [Google Scholar]
- 14.Croft M. The role of TNF superfamily members in T-cell function and diseases. Nat Rev Immunol. 2009;9:271–85. doi: 10.1038/nri2526. [DOI] [PMC free article] [PubMed] [Google Scholar]
- 15.Ohnuma K, Takahashi N, Yamochi T, Hosono O, Dang NH, Morimoto C. Role of CD26/dipeptidyl peptidase IV in human T cell activation and function. Front Biosci. 2008;13:2299–310. doi: 10.2741/2844. [DOI] [PubMed] [Google Scholar]
- 16.Ohnuma K, Dang NH, Morimoto C. Revisiting an old acquaintance: CD26 and its molecular mechanisms in T cell function. Trends in Immunol. 2008;29:295–301. doi: 10.1016/j.it.2008.02.010. [DOI] [PubMed] [Google Scholar]
Associated Data
This section collects any data citations, data availability statements, or supplementary materials included in this article.


