


Abstract
Mapping gene regulatory networks is a significant challenge in systems biology, yet only a few methods are currently capable of systems-level identification of transcription factors (TFs) that bind a specific regulatory element. We developed a microfluidic method for integrated systems-level interaction mapping of TF–DNA interactions, generating and interrogating an array of 423 full-length Drosophila TFs. With integrated systems-level interaction mapping, it is now possible to rapidly and quantitatively map gene regulatory networks of higher eukaryotes.
INTRODUCTION
Transcription factors (TFs) regulate gene expression by binding to specific regulatory DNA elements. Mapping the interactions that constitute a gene regulatory network (GRN) is important for elucidating many central regulatory mechanisms and is one of the current challenges of systems biology. Numerous TF-centric approaches exist for measuring TF binding in vivo and in vitro (1). Chromatin Immunoprecipitation (ChIP)-based methods can map all binding locations of a TF in vivo (1,2). In vitro methods such as Protein Binding Microarrays (PBM) (3), High-Throughput Systematic Evolution of Ligands by Exponential Enrichment (HT-SELEX) (4,5), High-Throughput Sequencing - Fluorescent Ligand Interaction Profiling (HiTS-FLIP) (6) and mechanically induced trapping of molecular interactions (MITOMI) (7) are capable of determining a TF’s consensus motif, binding specificities and affinities. Gene-centric (enhancer-centric) approaches attempt to derive a comprehensive list of TFs capable of binding a given DNA element. The dominant method for large-scale gene centric mapping of GRNs is based on one-hybrid techniques (8). Although capable of testing a large number of TFs against a specific DNA element, yeast one hybrid (Y1H) approaches have several technical limitations including the following: (i) a high false positive/negative rate; (ii) intracellular interactions allow no control over the reaction conditions; and (iii) mapping of DNA elements requires ∼2 weeks, leading to low turnaround times (9). Owing to some of these reasons, Y1H assays have recently been combined with MITOMI for downstream hit validation. Another approach to gene-centric mapping of GRNs (10) is the use of classical protein arrays, as recently shown by Hu et al. (11) who expressed, purified, arrayed and interrogated 4191 human proteins. But classical protein arrays remain extremely labor intensive to produce and have not been integrated with advanced detection mechanisms. The development of nucleic acid programmable protein arrays solved some of the problems associated with generating protein arrays, but nucleic acid programmable protein arrays have not been applied to GRN mapping (12).
We developed a high-throughput gene-centric approach for the integrated systems-level interaction mapping (iSLIM) of TF–DNA interactions. iSLIM is based on an in situ synthesized array of hundreds of full-length TFs, which are interrogated with specific DNA elements. To assure highly accurate and quantitative data, measurements are conducted on an integrated microfluidic platform, and detection is accomplished by MITOMI (7,13–15). MITOMI is a microfluidic approach capable of obtaining quantitative measurements of molecular interactions by physically trapping interacting molecules with a deflectable microfluidic membrane (7). We have previously shown that MITOMI is capable of measuring thousands of TF–DNA interactions in parallel on a single device obtaining equilibrium dissociation constants for hundreds of TF–DNA interactions (7). More recently, we showed that a next generation kinetic MITOMI device could acquire 768 kinetic rate measurements on a single chip (13). The MITOMI platform is also capable of synthesizing proteins in situ followed by on-chip protein characterization (16,15). Here, we expanded on the protein synthesis capacity of the MITOMI platform allowing us to synthesize hundreds of full-length Drosophila TFs. As such, iSLIM has systems-level throughput, is a quantitative approach and features a low false positive and negative rate. Notably, a single multiplexed iSLIM experiment is completed in 1–2 days, allowing for significantly faster turnaround times than Y1H assays or protein array approaches.
In this study, we expressed 423 full-length eukaryotic TFs on a single device and simultaneously interrogate the array with 12 specific DNA elements for a total of 5076 interaction measurements per experiment. Interaction hits can be quickly characterized on the same platform to determine de novo consensus sequences (14), position weight matrix (PWM) (7), specificities, affinities, kinetic rates (13,17) and higher-order protein–protein interactions (16). The iSLIM platform is thus uniquely suited for the comprehensive analysis of GRNs and the only method capable of both gene-centric and TF-centric approaches to GRN mapping.
MATERIALS AND METHODS
Construction of a linear DNA template library
A collection of open reading frames (ORFs) coding for all known Drosophila melanogaster TFs was previously cloned into Gateway compatible destination vectors (9) with a C-terminal GST tag.
A universal set of primers [Integrated DNA Technologies (IDT)] was designed framing the Gateway cassette on the pF3A-WG-GST plasmid with a 5′ primer (5′-GTATCCGCTCATGGATCTCGATC-3′) located 10-bp upstream of the SP6 promoter and a Cy3-labeled 3′ primer (5′-/5Cy3/CGGTTTTATGGACAGCAAGCGA-3′) located 24-bp downstream of the T7 terminator. A 96-well plate colony polymerase chain reaction (PCR) was performed on 575 samples where plasmids had been successfully transformed into Escherichia coli. About 0.4-µl cell template from a glycerol stock were transferred into 50 µl of a ready-to-use High Fidelity PCR Master reaction mix (Roche) with a 96-well metal solid pin replicator tool (V & P Scientific). The reaction mix was cycled for 2 min at 94°C, followed by 10 cycles of 10 s at 94°C, 70 s at 54°C (annealing) and 2 min at 72°C (elongation), then another 20 cycles of 15 s at 94°C, 30 s at 54°C (annealing) and elongation for 2 min + 5 s for each successive cycle at 72°C, followed by a final extension at 72°C for 7 min. Following the High Fidelity PCR Master manual, two PCR cycling protocols with different elongation times and temperatures (2 min at 72°C and 4 min at 68°C, respectively) were used for each clone to cover most of the expected PCR fragment sizes ranging from 1.5 kb to 7.2 kb.
Correct size of the PCR products was checked on E-Gel® 96 1% agarose gels (Invitrogen) (Supplementary Figure S1). A MatLab-based image analysis program automatically detected and analysed PCR product bands. The program listed the number of detected DNA fragments (number of peaks) per gel lane, their size and intensity. We selected almost 80% (454 of 575 entry clones) for our linear DNA template library (Supplementary Figure S2) based on expected transcription size (±33% from expected size), band intensity and purity of the PCR product. Final linear DNA templates were selected based on fragment size (within ± 33% from expected DNA length), its band intensity in the electrophoresis gel (Inti > 300 a.u.) and purity (P = Inti/∑(Inti) > 0.8) of the linear DNA fragment (Supplementary Figure S3). Selected PCR products were diluted 1:3 with 2(w/v)% bovine serum albumin (BSA)/dH2O and transferred into two 384-well plates using a liquid handling robot (Tecan).
Synthesis of target DNA (Klenow)
Single-stranded Cy5-labeled DNA oligo sequence templates for 12 TFs from the even-skipped GRN (bcd, D, gt, kni, Kr, Mad, Med, pan, prd, tin, ttk, twi) (18) were ordered from IDT (see Supplementary Table S1). To synthesize double-stranded DNA target sequences, we prepared a 20 µl primer mix containing 2 µl of 150 µM target DNA sequence, 0.4 µl 5′ Comp Cy5 primer (5′-/Cy5/GTCATACCGCCGGA-3′), 2 µl 10× NEBuffer 2 (NEB) and 15.6 µl PCR-grade water. The primer mix was denatured for 3 min at 94°C and then slowly cooled down (0.1°C/s) to 37°C before adding 10 µl of a Klenow-fragment-nucleotide mix containing 1 µl Klenow Fragment (3′→5′ exo–, NEB), 3 µl dNTP (10 mM PCR nucleotide mix, Roche), 1 µl 10× NEBuffer 2 (NEB) and 5 µl PCR-grade water. The final 30 µl mix was then incubated for 60 min at 37°C and 20 min at 72°C before slowly cooling it to 30°C at a rate of 0.1°C/s.
De Bruijn DNA library design and synthesis
De Bruijn sequences have essentially been designed and generated as previously described (19). All possible 8-mer DNA sequences (a total of 65 536) were computationally assembled into a DNA library of 1523 individual 68-mer oligonucleotides and one 72-mer oligonucleotide. Oligonucleotides with five or more consecutive guanines were replaced by its reverse complement to avoid problems during primer extension. Each oligonucleotide contained multiple, overlapping 8-bp sequences, a 5′-CGC-3′ clamp at the 5′ end and a 5′-CTCCGGCGGTATGAC-3′sequence at the 3′ end for hybridization to a fluorophore labeled extension primer. Double stranded target DNAs were essentially generated as outlined earlier in the text. However, instead of using only one Cy5-labeled extension primer, we used an additional Cy-3-labeled primer. DNA library was split into equal size of 762 oligonucleotides and extended with either Cy3- or Cy5-labeled primer. Following completion of extension, a pair of Cy3- and Cy5-labeled double-stranded was pooled.
Microfluidic device fabrication and glass slides preparation
Microfluidic chip design and fabrication as well as coating of glass slides with epoxysilane were performed as previously described (20).
DNA spotting and device alignment
Solutions of DNA sequences were spotted onto epoxy-coated microscope slides with 373 µm column and 746 µm row spacing using a QArray2 microarrayer (Genetix) and 946MP2 slit-pins (ArrayIt). Sample solutions contained 2(w/v)% BSA/dH2O to prevent covalent linkage of DNA to the epoxy surface and to visualize DNA spots for alignment to the microfluidic device. Spotted DNA arrays were manually aligned to microfluidic PDMS devices containing 768 unit cells using a Nikon SMZ1500 stereoscope and bonded overnight at 40°C.
TF–DNA detection with TF-array on-chip experimental procedure
The surface area was modified by depositing layers of BSA-biotin and NeutrAvidin/PBS as previously described (20). The surface derivatization was completed by immobilizing 1 µg/ml biotinylated GST antibody (ab71283, abcam) in 1% BSA/PBS to the area beneath the button membrane and blocking the surface using a blocking solution of 0.5% non-fat dried milk powder, 1% BSA in PBS and 0.1 mg/ml sheared salmon sperm DNA (Sigma).
An in vitro transcription-translation (ITT) mix containing 5 µl TnT® SP6 High-Yield Wheat Germ Protein Expression System (Promega), 0.25 µl tRNALys−Bodipy−Fl (Promega) and 3 µl of nuclease-free water (Promega) was loaded into the chambers of the device to solubilize the linear DNA. Incubation for 3 h at room temperature with the sandwich valves closed allowed the expressed GST-tagged TFs to diffuse to the antibody. The device was imaged on a modified ArrayWoRx (Applied Precision) microarray scanner with the button membrane open and closed before and after a final wash step, respectively.
For interaction studies, we pooled all 12 synthesized target DNA and diluted them 1:10 in PCR-grade water. The ITT mix was prepared containing 5 µl TnT® SP6 High-Yield Wheat Germ Protein Expression System (Promega), 0.25 µl tRNALys−Bodipy−Fl (Promega), 0.8 µl of pre-diluted pooled target DNA mix, 0.32 µl sheared salmon sperm DNA (Sigma) and 1.63 µl of nuclease-free water (Promega). Loading of the ITT-DNA mix, incubation and image acquisition were the same as in the aforementioned procedure.
Correlation of signal detection from BODIPY lysine
For the experiment in which we correlated the amount of BODIPY-labeled lysines that were incorporated into the proteins to the amount of detected proteins (Supplementary Figure S4), we let a second GST antibody bind to the BODIPY-labeled surface immobilized TFs. A monoclonal fluorescently labeled GST antibody (Hilyte Fluor™ 647, ab64370) was diluted 1:200 in 1 % BSA/PBS to a final concentration of 5 µg/ml and loaded on chip for 5 min with the button membrane closed. After closing the sandwich valve again and re-opening the button membrane, the antibody solution was allowed to diffuse and bind to the GST-tagged proteins for 30 min, after which the device was washed once more for 5 min with the membrane buttons closed and the sandwich valves open and scanned a third time.
Concentration-dependent binding measurements
For the concentration-dependent binding measurements, we printed six serial dilutions in 1% BSA for each target DNA on epoxy-coated glass slides, aligned and bonded them to the MITOMI device. Surface chemistry was as described for the TF detection studies. TF proteins were produced off chip by adding 0.5 µl linear DNA template (unpurified PCR product) to 5 µl TnT® SP6 High-Yield Wheat Germ Protein Expression System (Promega), 0.25 µl tRNALys−Bodipy−Fl (Promega) and 1.75 µl of nuclease-free water (Promega) and incubating the ITT-TF mix for 2 h at 25°C.
DNA binding was measured in two different modes (Supplementary Figure S5): For the monomeric measurements, the supernatant of the ITT-TF mix was loaded onto the device. The protein was allowed to bind to the GST antibody beneath the button valve, then excess protein was washed off before solubilizing the target DNA spots in the chamber with PBS and letting the DNA diffuse to the TF underneath the button area, where we captured interactions by collapsing the button membrane. For the measurements in dimer mode, the area beneath the button membrane was protected by collapsing the membrane while loading the ITT-TF mix into the DNA chambers. Chambers were then closed again to wash off any DNA that could have had potentially diffused out of the chamber to avoid cross-contamination of chambers. TFs were allowed to interact with the resuspended target DNA in the chambers before binding to the immobilized antibody underneath the button membrane.
8-mer library (de Bruijn) on-chip experimental procedure
We programmed the MITOMI device with a library of 1524 oligonucleotides. Surface chemistry/modification and off-chip TF production were prepared as described earlier in the text. The supernatant of the ITT-TF mix was loaded into the chambers with button membranes and outlet valve closed, which allowed the DNA to interact with the TFs. The neck valves were then closed again, and the channels flushed with ITT mix, before closing the sandwich valves and allowing the solution to diffuse to the area beneath the button. After 1 h of incubation, the button membrane trapped surface-bound TF–DNA complexes, and a final PBS wash removed unbound TFs and DNA from the channels.
Data acquisition and analysis
For each experiment, slides were scanned on an ArrayWorx scanner with 0.5 s and 1.0 s exposure times before and after the final wash step at the following wavelengths: 488 nm for BODIPY-labeled proteins, 685 nm for Cy5-labeled target DNA (or anti GST647) and 595 nm for the Cy3-labeled in the de Bruijn experiments.
For each experiment, two images were analysed with GenePix6.0 (Molecular Devices). The first image (before washing) determined the available DNA concentration in solution, the second (after washing) the amount of surface-bound DNA and protein. The parallel recording in the 4′,6-diamidino-2-phenylindole (DAPI) channel allowed a quick detection of the area below the button membrane, which had been labeled with NeutrAvidin® Alexa Fluor® 350 conjugate. For detection of surface-bound protein and DNA, a microarray grid was aligned to the stained circular NA spots and used as a template for the detection of protein pull-down and DNA-binding events. Local backgrounds were subtracted for all channels by moving the grid just next to the chamber, outside the channels. We excluded unit cells with ‘bad’ features or insufficient signals from further analysis, which was done with a code written in Mathematica (Wolfram Research).
Kd determination for concentration-dependent binding measurements
The concentration of available target DNA for binding in each unit cell was determined by measuring the Cy-5 fluorescence in the chamber after incubation. For this purpose, we generated a calibration curve, for which we filled the device with serial dilutions of Cy5-labeled target DNA in 1% BSA at eight concentrations (1.25 µM, 0.625 µM, 0.156 µM, 0.078 µM, 0.039 µM, 19.5 nM, 9.8 nM and 4.9 nM) and scanned the device at 635 nm with 0.5 s and 1.0 s exposure time, respectively (Supplementary Figure S8).
Measured Cy5 chamber intensities were converted to concentrations using the calibration curve (described earlier in the text). For each protein, measured fluorescence ratios r (r = DNA-Cy5 intensity/protein-BODIPY FL intensity) were fitted as a function of total available DNA concentration ([D] n RFU) to a single-site binding model to determine the equilibrium binding constant (Kd) using Prism 5 (GraphPad Software):
| (1) |
For each protein, we performed a global non-linear regression fit for all target sequences over all concentrations with the same Bmax because this maximum intensity ratio, at which all binding sites are occupied, should be the same for all sequences.
De Bruijn analysis and motif discovery
The de Bruijn analysis was performed essentially as described by Fordyce et al. (14) with the exception that Multiple EM for Motif Elicitation (MEME) was used for the initial motif discovery instead of fREDUCE. We first normalized the background adjusted Cy3 and Cy5 DNA pull-down signals by dividing each data point by the mean of each data set. The combined data sets (Cy3 and Cy5 channels) were rank ordered, and all oligos above the mean plus two standard deviations were used in an initial MEME search. The MEME search was conducted using the standard MEME tool (v. 4.8.1) using a maximum motif width of 14 bps and the remaining standard settings (zero or one motif per sequence, min motif width 6, max number of motifs to find: 3). If MEME returned a statistically significant motif, it was used as a seed motif for MatrixREDUCE (21). We then ran MatrixREDUCE (REDUCE Suite v2.0) on the data set using standard settings and the seed motif derived from MEME. In some instances, REDUCE could be used directly to provide a seed motif by running the algorithm first without providing a seed motif. The motifs returned by REDUCE and MEME were plotted using LogoGenerator (included with REDUCE Suite v2.0).
RESULTS
Construction of a linear DNA template library of TFs
ORFs coding for 755 predicted fly TFs had been previously cloned into Gateway entry vectors (9) and were transferred into a pF3A-WG-GST destination vector generating 575 expression ready clones. We first attempted to express protein directly from plasmids, but observed low expression (data not shown), and plasmid purification was itself a laborious and expensive process. We thus applied an alternative approach by amplifying the ORFs by colony PCR. We used two PCR cycling protocols for each clone to efficiently amplify the large range of ORF sizes (1.5–7.2 kb). All PCR reactions were validated by gel electrophoresis (Supplementary Figure S1) and automatically assessed for quality using a MatLab-based program. We successfully amplified 454 of 575 ORFs (79%) spanning the entire size range of up to 7.2 kb (Supplementary Figure S3). The linear template library generated by PCR is sufficient to spot dozens of arrays, and the PCR reactions can be used directly for array generation without requiring additional purification steps, further streamlining the approach.
Generation of an on-chip Drosophila TF array
We programmed a microfluidic device consisting of 768 MITOMI unit cells with the linear template library (Figure 1) and expressed 423 full-length Drosophila TFs on-chip constituting 60% of all predicted fly TFs (Figure 2). We expressed 93.2% of the 454 linear DNA template library with protein sizes ranging from 317 to 2078 amino acids (37–231 kDa) (Figure 3). By comparison, we previously expressed 43 S. pneumoniae proteins ranging in size from 35 to 757 amino acids on a microfluidic device (16). The protein array generated in this study thus increases throughput by an order of magnitude and consists of large eukaryotic proteins.
Figure 1.
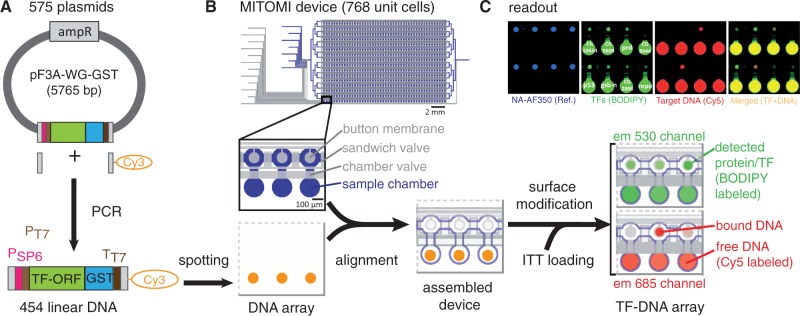
Experimental workflow. (A) Linear DNA templates were generated from plasmids by PCR. (B) PCR reactions were directly spotted onto a glass slide and aligned to a microfluidic device containing 768 unit cells. After surface modification and on-chip protein synthesis, TF–DNA interactions are detected by scanning the device on a fluorescence DNA microarray scanner. (C) A typical readout shows the TF–DNA pull-down area, stained with AlexaFluor350-labeled NeutrAvidin (blue), TF expression (green), bound target DNA (red) and the TF–DNA interaction of the merged channels.
Figure 2.
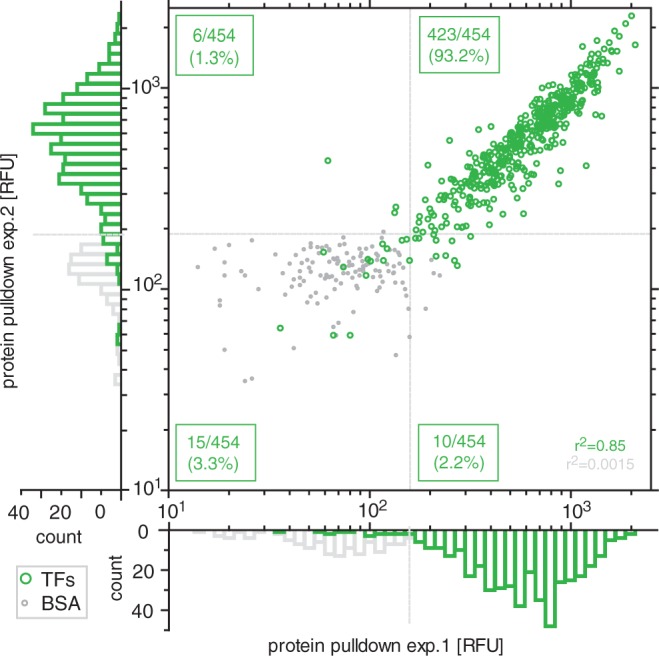
Correlation of protein expression levels (TF) and negative controls (BSA) from two different chips. Dotted gray lines indicate the background threshold (2 s.d. above the mean of the negative control).
Figure 3.
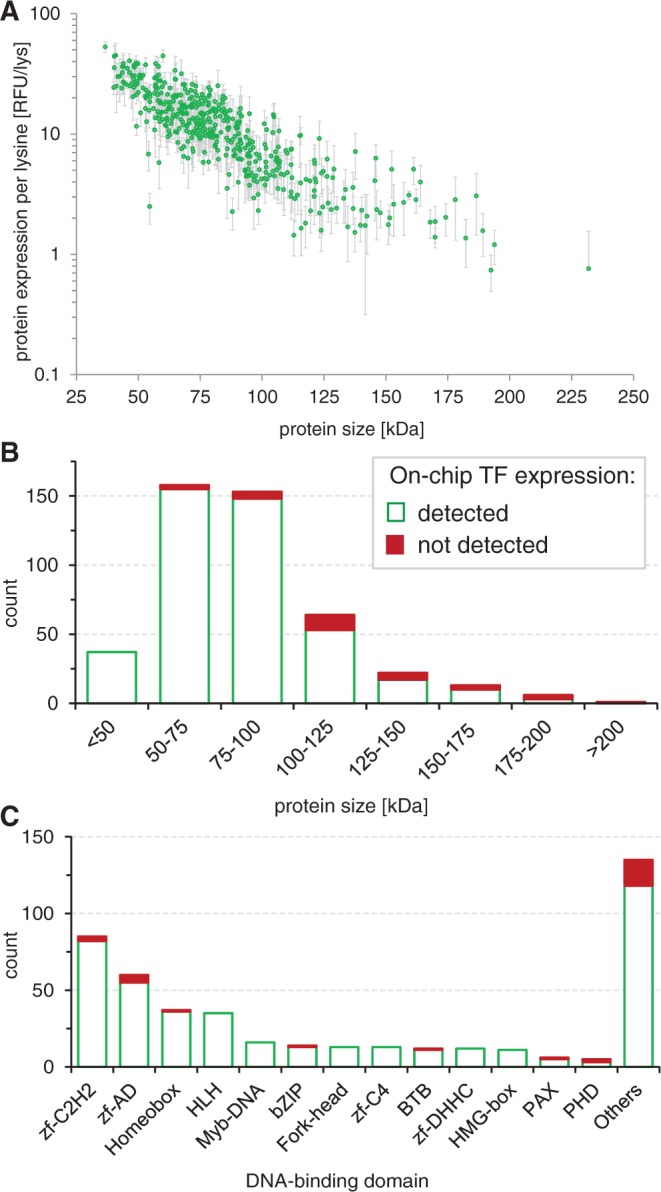
On-chip protein expression. (A) Expression levels (normalized to the number of lysine residues per protein) as a function of protein size of all 454 TF for six experiments (error bars: standard deviation). Histograms of (B) protein size (C) and DNA-binding domains of the expressed Drosophila TFs.
Assessment of TF integrity
With iSLIM, we could quantitate the amount of protein present for each TF, unlike in Y1H methods where TF expression levels are not assessed. We furthermore estimated how many of the expressed TFs could functionally bind DNA. We randomly selected eight TFs spanning the entire size range and tested each TF against a de Bruijn library (all 655 328 mer sequences computationally segmented into 1524 double-stranded target DNAs) (14). Of the eight TFs tested, three TFs bound strongly and specifically to DNA allowing us to determine PWMs for these TFs. An additional two TFs showed DNA pull-down, but the quality of the data was not sufficient to derive PWMs, and three TFs failed to bind to DNA (Supplementary Figure S6). Based on this analysis, we estimate that 38–63% of TFs on the array can functionally bind DNA. This estimate, and a second estimate of 44% (see later in the text), compares well with a previous estimate of 35–41% of functional TFs derived from a protein array generated by expression of human proteins in yeast, followed by large-scale purification, and microarraying (11). We thus could establish that protein arrays generated by in vitro transcription/translation perform as well as classical protein arrays, but drastically reduce cost and labor associated with array generation. A similar comparison with Y1H assays is difficult, as parameters such as TF expression and ability to bind DNA have not been assessed in Y1H assays, but a recent Y1H approach using the same Drosophila TF library recovered only 26% of control reactions (9). iSLIM therefore outperforms both Y1H and classical protein arrays in terms of functionality (see Supplementary Table S2 for a summary of current gene-centric methods).
Recent interrogations of TF-binding specificities by ChIP-seq and in vitro methods suggest that TFs exhibit considerable cross-reactivity and that promiscuous binding can be of functional significance (22). With iSLIM, we investigated the extent of TF promiscuity on a systems level by measuring the binding of 12 DNA consensus motifs for TFs involved in the well-studied even-skipped GRN (bcd, D, gt, kni, Kr, Mad, Med, pan, prd, tin, ttk, twi) (18) against all 423 TFs present on our array (Figure 4). We interrogated all 12 DNA motifs as a pool, allowing us to test a total of 5076 interactions in a single experiment (423 TFs × 12 DNA motifs). For 11 of these 12 motifs, the interacting TF was present on our array. We observed DNA binding by four TFs (Kr, gt, prd, D), whereas seven TFs failed to bind DNA above background (bcd, kni, ttk, tin, Mad, twi, pan). Amongst these seven TFs, twist (twi) is known to require dimerization with another TF for DNA binding (23), and Mad was shown to bind DNA only in a truncated form (24). Given that Mad and twi were not expected to be functional, we arrive at four of nine TFs (44%) that functionally bound to DNA in the context of this particular set of proteins.
Figure 4.
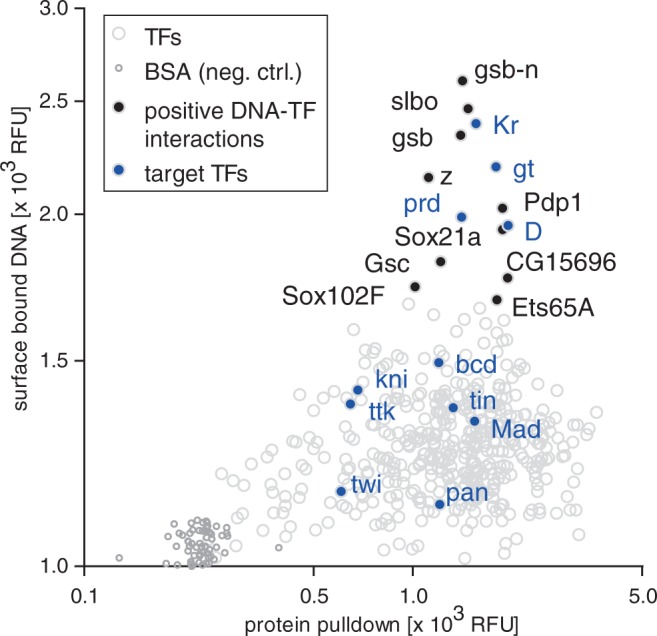
Detecting TF–DNA interactions with iSLIM. Scatter plot showing the DNA binding as a function of protein expression for all 423 TFs on the array to a pool of 12 DNA consensus motifs for TFs involved in the even-skipped GRN. Interactions are represented as gray circles. Highlighted are targeted TFs expressed on the array (blue) and additional TFs that interacted with the consensus sequences (black).
Affinity and specificity measurements of TF–DNA interactions
In addition to previously known interactions, we identified 10 TFs (gsb-n, gsb, Pdp1, slbo, z, Sox21a, Gsc, Ets65A, bun, CG15696) that reproducibly bound to one or more of the 12 consensus motifs, of which three TFs (Pdp1, Sox21a, bun) had no prior PWM associated with them. As we initially interrogated the 12 consensus sequences as a pool, we next determined the specificities and affinities of each of the 10 TFs individually by obtaining saturation binding curves for each TF–DNA sequence combination (Figure 5, Supplementary Figure S5). Overall, we obtained Kd values for 204 TF–DNA interactions from binding curves consisting of 5′472 data points.
Figure 5.
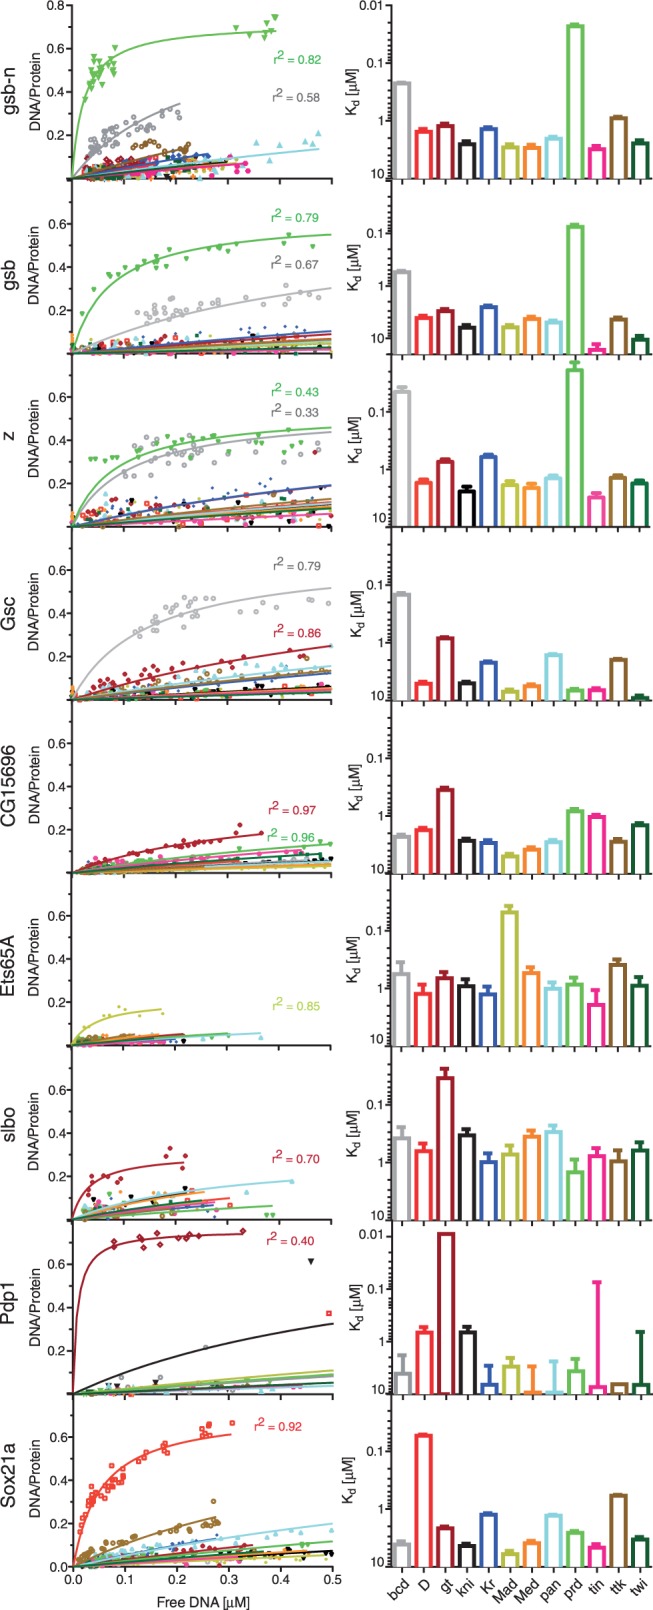
Specificities and affinities of TFs for which binding was observed were measured for all 12 DNA consensus motifs (Figure 4). Concentration-dependent binding curves are derived from fitting the measured DNA/protein ratio signals over available consensus DNA (in solution) to a single-site binding model (left); binding affinities to each consensus motif is plotted as Kd value with standard errors (right).
The detailed affinity analysis showed that all 10 TFs were able to bind DNA, indicating that the false positive rate of iSLIM is low. Of these 10 TFs, seven TFs bound specifically and with high affinity to one of the 12 consensus motifs: (i) gsb, and gsb-n bound the prd motif; (ii) slbo, and Pdp1 bound the gt motif; (iii) Gsc bound the bcd motif; (iv) Ets65A bound the Mad motif; and (v) Sox21a bound the D motif. Z bound to both the bcd and prd motif with high affinity. CG15696 binding was weak but showed a slight preference for the gt motif, whereas bun was entirely non-specific.
Determination of DNA-binding motifs
We completed our TF characterization by determining the PWMs for seven TFs including Kr, prd, CG15696, Rel and achi, and de novo PWMs for the uncharacterized TFs Pdp1 and Sox21a (Figure 6, Supplementary Figure S7). We adopted and streamlined the method of Fordyce et al. (14), permitting the same 8-mer measurement depth using 768 unit cells instead of the 4160 unit cell device previously required. The motifs determined in our analysis were in agreement with motifs found in the literature, and the novel motifs found for Pdp1 and Sox21a reflected known motifs of other members of the bZip (Pdp1) and HMG-box (Sox21a) family of TFs. The compression of the 8-mer library into a 768 unit cell device was thus still capable of de novo consensus motif discovery. Additionally, we showed that the use of a de Bruijn library is a stringent assessment of TF functionality. The PWMs motifs discovered by iSLIM can be used as starting points for more precise measurements of the specificity of a given TF by MITOMI, which requires a seed sequence from which a specific DNA library can be designed (optimally the consensus sequence).
Figure 6.
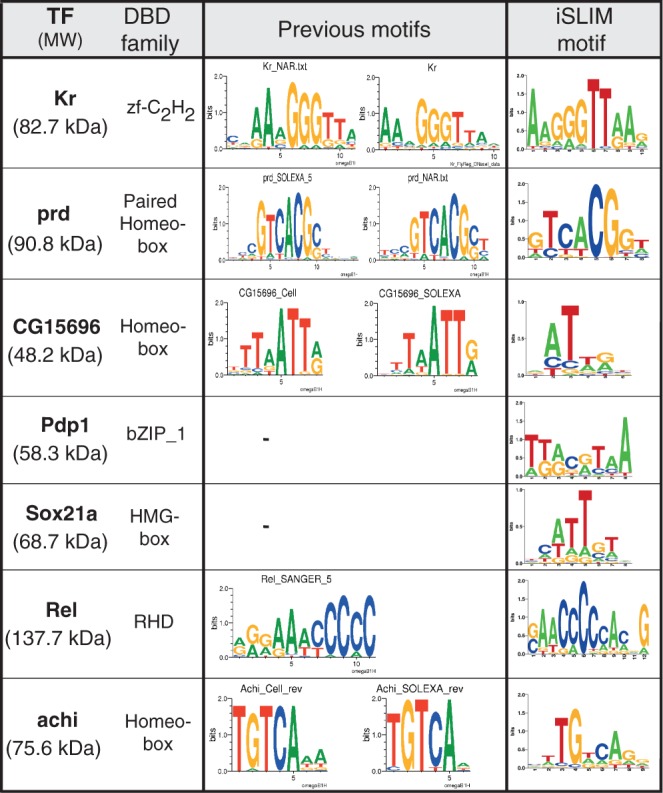
Determination of DNA binding motifs by de Bruijn analysis of seven TFs. The binding specificity of selected TFs was assessed on an oligonucleotide array containing all possible 8-mer sequences (de Bruijn library). The library consisted of 1524 double-stranded oligonucleotides, labeled with Cy3 and Cy5 in equal parts. The motifs found with iSLIM platform are shown in comparison with previously known motifs (if any).
DISCUSSION
In summary, we established iSLIM as a comprehensive methodology for the gene-centric mapping of GRNs. With iSLIM, it is possible to rapidly generate large-scale TF arrays from ORF libraries and map thousands of TF-DNA interactions in a single experiment. Unlike other methods applied to gene-centric mapping of GRNs, iSLIM is a quantitative approach that allows an assessment of the presence and quality of each TF being interrogated. Furthermore, a single iSLIM experiment requires an order of magnitude less time than Y1H and eY1H approaches (1–2 days instead of ∼14 days) (9,25). Compared with classical protein arrays, iSLIM circumvents tedious cell-based protein expression, and purification, significantly reducing associated costs and labor. iSLIM is the only method capable of both gene-centric and TF-centric approaches to GRN characterization. Moreover, iSLIM can fully characterize TF–DNA interactions including determination of de novo consensus motifs/PWMs (14), quantitative measurements of binding energy landscapes (7,26) and large-scale kinetic measurements (27). Finally, as the method is conducted in vitro and integrated with a next generation detection method, reaction conditions can be precisely controlled enabling the analysis of higher-order interactions (28), which is not feasible with Y1H methods and may be difficult to achieve using standard protein arrays. Given these performance advantages over existing methods, iSLIM will contribute to the large-scale mapping of GRNs and provide a detailed quantitative analysis of the interactions constituting GRNs.
SUPPLEMENTARY DATA
Supplementary Data is available at NAR Online: Supplementary Tables 1 and 2 and Supplementary Figures 1–8.
FUNDING
SystemsX.ch grant DynamiX-RTD (2008/005); École Polytechnique Fédérale de Lausanne. Funding for open access charge: SystemsX.ch grant DynamiX-RTD [2008/005].
Conflict of interest statement. None declared.
Supplementary Material
ACKNOWLEDGEMENTS
The authors thank Manuel Bueno from the Biomolecular Screening Facility (EPFL) for assistance with the liquid handling robots and Jean-Bernard Nobs for assistance with the MatLab program.
REFERENCES
- 1.Geertz M, Maerkl SJ. Experimental strategies for studying transcription factor-DNA binding specificities. Brief. Funct. Genomics. 2010;9:362–373. doi: 10.1093/bfgp/elq023. [DOI] [PMC free article] [PubMed] [Google Scholar]
- 2.Park PJ. ChIP–seq: advantages and challenges of a maturing technology. Nat. Rev. Genet. 2009;10:669–680. doi: 10.1038/nrg2641. [DOI] [PMC free article] [PubMed] [Google Scholar]
- 3.Badis G, Berger MF, Philippakis AA, Talukder S, Gehrke AR, Jaeger SA, Chan ET, Metzler G, Vedenko A, Chen X, et al. Diversity and complexity in DNA recognition by transcription factors. Science. 2009;324:1720–1723. doi: 10.1126/science.1162327. [DOI] [PMC free article] [PubMed] [Google Scholar]
- 4.Zhao Y, Granas D, Stormo GD. Inferring binding energies from selected binding sites. PLoS Comp. Biol. 2009;5:e1000590. doi: 10.1371/journal.pcbi.1000590. [DOI] [PMC free article] [PubMed] [Google Scholar]
- 5.Jolma A, Kivioja T, Toivonen J, Cheng L, Wei G, Enge M, Taipale M, Vaquerizas JM, Yan J, Sillanpaa MJ, et al. Multiplexed massively parallel SELEX for characterization of human transcription factor binding specificities. Genome Res. 2010;20:861–873. doi: 10.1101/gr.100552.109. 10.1101/gr.100552.109. [DOI] [PMC free article] [PubMed] [Google Scholar]
- 6.Nutiu R, Friedman RC, Luo S, Khrebtukova I, Silva D, Li R, Zhang L, Schroth GP, Burge CB. Direct measurement of DNA affinity landscapes on a high-throughput sequencing instrument. Nat. Biotechnol. 2011;29:659–664. doi: 10.1038/nbt.1882. 10.1038/nbt.1882. [DOI] [PMC free article] [PubMed] [Google Scholar]
- 7.Maerkl SJ, Quake SR. A systems approach to measuring the binding energy landscapes of transcription factors. Science. 2007;315:233–237. doi: 10.1126/science.1131007. [DOI] [PubMed] [Google Scholar]
- 8.Vidal M, Brachmann RK, Fattaey A, Harlow E, Boeke JD. Reverse two-hybrid and one-hybrid systems to detect dissociation of protein-protein and DNA-protein interactions. Proc. Natl Acad. Sci. USA. 1996;93:10315–10320. doi: 10.1073/pnas.93.19.10315. [DOI] [PMC free article] [PubMed] [Google Scholar]
- 9.Hens K, Feuz J-D, Isakova A, Iagovitina A, Massouras A, Bryois J, Callaerts P, Celniker SE, Deplancke B. Automated protein-DNA interaction screening of Drosophila regulatory elements. Nat. Methods. 2011;8:1065–1070. doi: 10.1038/nmeth.1763. [DOI] [PMC free article] [PubMed] [Google Scholar]
- 10.Deplancke B. Experimental advances in the characterization of metazoan gene regulatory networks. Brief. Funct. Genomic. Proteomic. 2009;8:12. doi: 10.1093/bfgp/elp001. [DOI] [PubMed] [Google Scholar]
- 11.Hu SS, Xie ZZ, Onishi AA, Yu XX, Jiang LL, Lin JJ, Rho H-SH, Woodard CC, Wang HH, Jeong JSJ, et al. Profiling the human protein-DNA interactome reveals ERK2 as a transcriptional repressor of interferon signaling. Cell. 2009;139:610–622. doi: 10.1016/j.cell.2009.08.037. [DOI] [PMC free article] [PubMed] [Google Scholar]
- 12.Ramachandran N, Raphael JV, Hainsworth E, Demirkan G, Fuentes MG, Rolfs A, Hu Y, Labaer J. Next-generation high-density self-assembling functional protein arrays. Nat. Methods. 2008;5:535–538. doi: 10.1038/nmeth.1210. [DOI] [PMC free article] [PubMed] [Google Scholar]
- 13.Geertz M, Shore D, Maerkl SJ. Massively parallel measurements of molecular interaction kinetics on a microfluidic platform. Proc. Natl Acad. Sci. 2012;109:16540–16545. doi: 10.1073/pnas.1206011109. [DOI] [PMC free article] [PubMed] [Google Scholar]
- 14.Fordyce PM, Gerber D, Tran D, Zheng J, Li H, Derisi JL, Quake SR. De novo identification and biophysical characterization of transcription-factor binding sites with microfluidic affinity analysis. Nat. Biotechnol. 2010;28:970–975. doi: 10.1038/nbt.1675. [DOI] [PMC free article] [PubMed] [Google Scholar]
- 15.Maerkl SJ, Quake SR. Experimental determination of the evolvability of a transcription factor. Proc. Natl Acad. Sci. USA. 2009;106:18650–18655. doi: 10.1073/pnas.0907688106. [DOI] [PMC free article] [PubMed] [Google Scholar]
- 16.Gerber D, Maerkl SJ, Quake SR. An in vitro microfluidic approach to generating protein-interaction networks. Nat. Methods. 2009;6:71–74. doi: 10.1038/nmeth.1289. [DOI] [PMC free article] [PubMed] [Google Scholar]
- 17.Bates SR, Quake SR. Highly parallel measurements of interaction kinetic constants with a microfabricated optomechanical device. Appl. Phys. Lett. 2009;95:73705–73705. doi: 10.1063/1.3211382. [DOI] [PMC free article] [PubMed] [Google Scholar]
- 18.Wilczynski B, Furlong EE. Challenges for modeling global gene regulatory networks during development: insights from Drosophila. Dev. Biol. 2010;340:161–169. doi: 10.1016/j.ydbio.2009.10.032. [DOI] [PubMed] [Google Scholar]
- 19.Philippakis AA, Qureshi AM, Berger MF, Bulyk ML. Design of compact, universal DNA microarrays for protein binding microarray experiments. J. Comput. Biol. 2008;15:655–665. doi: 10.1089/cmb.2007.0114. [DOI] [PMC free article] [PubMed] [Google Scholar]
- 20.Rockel S, Geertz M, Maerkl SJ. MITOMI: a microfluidic platform for in vitro characterization of transcription factor-DNA interaction. Methods Mol. Biol. 2012;786:97–114. doi: 10.1007/978-1-61779-292-2_6. [DOI] [PubMed] [Google Scholar]
- 21.Foat BC, Foat BC, Morozov AV, Morozov AV, Bussemaker HJ, Bussemaker HJ. Statistical mechanical modeling of genome-wide transcription factor occupancy data by MatrixREDUCE. Bioinformatics. 2006;22:e141–e149. doi: 10.1093/bioinformatics/btl223. [DOI] [PubMed] [Google Scholar]
- 22.Zhou X, O'Shea EK. Integrated approaches reveal determinants of genome-wide binding and function of the transcription factor Pho4. Mol. Cell. 2011;42:826–836. doi: 10.1016/j.molcel.2011.05.025. [DOI] [PMC free article] [PubMed] [Google Scholar]
- 23.Yin Z, Yin Z, Xu XL, Xu XL, Frasch M, Frasch M. Regulation of the twist target gene tinman by modular cis-regulatory elements during early mesoderm development. Development. 1997;124:4971–4982. doi: 10.1242/dev.124.24.4971. [DOI] [PubMed] [Google Scholar]
- 24.Kim J, Johnson K, Chen HJ, Carroll S, Laughon A. Drosophila Mad binds to DNA and directly mediates activation of vestigial by Decapentaplegic. Nature. 1997;388:304–308. doi: 10.1038/40906. [DOI] [PubMed] [Google Scholar]
- 25.Reece-Hoyes JS, Diallo A, Lajoie B, Kent A, Shrestha S, Kadreppa S, Pesyna C, Dekker J, Myers CL, Walhout AJ. Enhanced yeast one-hybrid assays for high-throughput gene-centered regulatory network mapping. Nat. Methods. 2011;8:1059–1064. doi: 10.1038/nmeth.1748. [DOI] [PMC free article] [PubMed] [Google Scholar]
- 26.Shultzaberger RK, Maerkl SJ, Kirsch JF, Eisen MB. Probing the Informational and regulatory plasticity of a transcription factor DNA–binding domain. PLoS Genet. 2012;8:e1002614. doi: 10.1371/journal.pgen.1002614. [DOI] [PMC free article] [PubMed] [Google Scholar]
- 27.Geertz M, Rockel S, Maerkl SJ. A high-throughput microfluidic method for generating and characterizing transcription factor mutant libraries. Methods Mol. Biol. 2012;813:107–123. doi: 10.1007/978-1-61779-412-4_6. [DOI] [PubMed] [Google Scholar]
- 28.Schröter C, Ares S, Morelli LG, Isakova A, Hens K, Soroldoni D, Gajewski M, Jülicher F, Maerkl SJ, Deplancke B, et al. Topology and dynamics of the Zebrafish segmentation clock core circuit. PLoS Biol. 2012;10:e1001364. doi: 10.1371/journal.pbio.1001364. [DOI] [PMC free article] [PubMed] [Google Scholar]
Associated Data
This section collects any data citations, data availability statements, or supplementary materials included in this article.