

Abstract
As a target of antiviral drugs, the influenza A M2 protein has been the focus of numerous structural studies and has been extensively explored as a model ion channel. In this study, we capitalize on the expanding body of high-resolution structural data available for the M2 protein to design and interpret site-directed spin-labeling electron paramagnetic resonance spectroscopy experiments on drug-induced conformational changes of the M2 protein embedded in lipid bilayers. We obtained data in the presence of adamantane drugs for two different M2 constructs (M2TM 22–46 and M2TMC 23–60). M2TM peptides were spin labeled at the N-terminal end of the transmembrane domain. M2TMC peptides were spin labeled site specifically at cysteine residues substituted for amino acids within the transmembrane domain (L36, I39, I42, and L43) and the C-terminal amphipathic helix (L46, F47, F48, C50, I51, Y52, R53, F54, F55, and E56). Addition of adamantane drugs brought about significant changes in measured electron paramagnetic resonance spectroscopy environmental parameters consistent with narrowing of the transmembrane channel pore and closer packing of the C-terminal amphipathic helices.
Keywords: membrane proteins, lipid bilayers, M2 protein, nitroxide spin label, EPR spectroscopy, adamantane drug binding
Introduction
After decades of frustration, high-resolution crystal structures of membrane proteins are being published in unprecedented numbers. High-resolution crystal data have been a boon for several fields for which membrane proteins are critical players. However, membrane proteins are not static, and single crystal structures are unable to capture crucial conformational dynamics that may be critical for understanding drug action and designing drugs. To fully characterize the drug-binding properties of a membrane-bound protein, it is useful to complement crystallography with techniques that can capture protein movement, such as nuclear magnetic resonance (NMR), molecular dynamics modeling, and/or the family of techniques used in this study, site-directed spin-labeling electron paramagnetic resonance spectroscopy (SDSL-EPR).1 Ideally, these complementary studies should be carried out in lipid membrane bilayers. The packing of lipids around transmembrane (TM) domains impacts the conformational changes that can occur upon drug binding. Furthermore, partitioning of drugs into lipid bilayers must be addressed to fully and quantitatively understand the binding of drugs to sites on a TM protein.
SDSL-EPR is exquisitely suited to study membrane-bound proteins reconstituted into lipid bilayers at physiologically relevant temperatures.1 Structural parameters measured in SDSL-EPR experiments include distances from ∼12 to 60 Å, topology with respect to the membrane bilayer, and mobility information on multiple timescales.2 SDSL-EPR is not limited by the size of the protein, and the high sensitivity of the method allows a range of drug:protein:lipid ratios to be tested, enabling a fuller characterization of drug binding than is practical with many other biophysical methods.
M2 is a 97-amino acid protein critical to the life cycle of influenza A.3 M2 has been the focus of numerous structural studies and has been extensively explored as a model ion channel4 and, most recently, as a player in viral budding.5 M2 consists of an N-terminal extracellular region, a TM domain that mediates homotetramerization and proton channel formation, and a C-terminal domain that extends into the cytoplasm (Fig. 1).4 Channel activity can be inhibited by the amino-adamantyl drugs, amantadine (1-aminoadamantane) and rimantadine (1-(1-adamantyl)ethylamine). Over 90% of circulating influenza A strains have developed resistance to these adamantane drugs.6 Resistance to current antivirals and the threat of future pandemics make the development of new antiviral drugs a priority.
Figure 1.
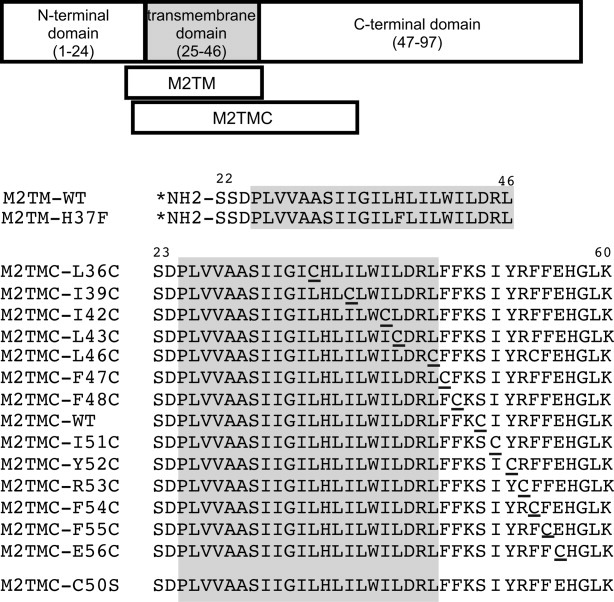
Spin-labeled M2 peptides used in this study. Wild-type sequence corresponds to the M2 protein from influenza strain A/Udorn/72 (H3N2). M2TM (23–46) peptides were spin labeled (indicated by *) at the N-terminus. M2TMC (23–60) peptides were spin labeled at single cysteine sites (underlined). All M2TMC sequences other than the WT sequence have a C50S replacement in addition to the cysteine substitution necessary for spin labeling. The last cysteine-less sequence was used for spin dilution.
Previously, we published two different SDSL-EPR studies on M2.7, 8 In the first study, a M2TM (22–46) peptide that spans the TM domain and homotetramerizes to form the channel pore was spin labeled with a nitroxide at the N-terminus and studied in lipid bilayers of different thicknesses. Analyses of EPR spectral changes demonstrated that the conformation of the TM helical bundle depends on lipid bilayer properties.7 In the second study, M2TMC (23–60) peptides that included part of the C-terminal domain in addition to the TM domain were spin labeled at nine consecutive sites C-terminal to the TM region. We demonstrated that this C-terminal region is an amphipathic alpha helix associated with the membrane surface based upon periodic variations in lipid accessibility data and patterns of distance-dependent interactions between spin labels within the tetrameric bundle.8
Here, we extend our previous SDSL-EPR work and present data on the conformation of the M2 protein in the presence of adamantane drugs. Two different binding sites have been reported for adamantane drugs: a high-affinity site inside the TM pore and a second lower affinity, lipid-exposed site found near the cytoplasmic end of the channel.9, 10 The high affinity drug-binding site in the channel pore has been shown to be the pharmacologically relevant binding site.4 Conformational studies on drug-bound M2 protein in lipid bilayers can contribute valuable information to drug development efforts. Here, we report EPR spectroscopy data reflecting the effect of adamantane drugs on the conformation of two different M2 constructs (M2TM 22–46 and M2TMC 23–60). M2TM peptides were spin labeled at the amino terminus. M2TMC peptides were spin labeled site specifically at cysteine residues substituted for amino acids within the TM domain (L36, I39, I42, and L43) and the C-terminal amphipathic helix (L46, F47, F48, C50, I51, Y52, R53, F54, F55, and E56). Addition of adamantane drugs brought about significant changes in measured distance-dependent spin-spin couplings and accessibilities to paramagnetic relaxation agents with differential partitioning into lipid versus aqueous environments. Conformational changes consistent with observed spectral parameters are discussed in light of the structural data available for the M2 protein.
Results
Conformation of M2TM-WT peptide depends on pH and the presence of drug
We spin labeled two synthetic M2TM segments, M2TM-WT and M2TM–H37F (sequences shown in Fig. 1), at their N-termini. In the M2TM-H37F peptide, the protonatable imidazole ring on His37 is substituted with a nearly isosteric benzyl side chain. Protonation of His37 is critical for conformational changes induced by low pH and shuttling of protons through the channel.11 Channels consisting of M2TM-H37F peptides are expected to be unresponsive to lowered pH and thus serve as a control.
Spin-labeled M2TM-WT and M2TM-H37F peptides were reconstituted into 1-palmitoyl-2-oleoyl-sn-glycero-phosphocholine (POPC):1-palmitoyl-2-oleoyl-sn-glycero-3-[phospho-rac-(1-glycerol)] (POPG) (4:1 molar ratio) lipid bilayers at a 1:200 peptide:lipid molar ratio. EPR spectroscopy at room temperature was then used to probe the distances between the spin-labeled N-terminal ends of the TM helices within the tetrameric bundle under three different sets of conditions: pH 7.8 without drug, pH 5.6 without drug, and pH 7.8 with drug added. EPR spectra for M2TM-WT peptides are shown in the top row of Figure 2. Spectra for the control M2TM-H37F peptides are displayed in the bottom row of Figure 2.
Figure 2.

EPR spectra of spin-labeled M2TM peptides. Continuous wave (CW) X-band EPR spectra of N-terminally labeled WT and H37F mutant M2TM peptides. Peptides were reconstituted into POPC:POPG (4:1 molar ratio) liposomes (peptide:lipid molar ratio of 1:200) under three conditions: pH 7.8 without drug (left), pH 5.6 without drug (center), and pH 7.8 with drug added (right, 1:10 peptide:amantadine molar ratio, 5 mol % drug-to-lipid ratio). Overlay of spectra of fully labeled tetrameric channels (black) and spectra of dilute-labeled channels (gray; one spin-labeled peptide + nine unlabeled peptides). Interaction parameter (Ω) reflects distance between N-termini within the tetrameric bundle. Ω is the ratio of central line amplitudes (M = 0) of the normalized dilute labeled and fully labeled spectra.
To focus on spin-spin interactions that provide direct structural information through the distance dependence of dipolar couplings, spectra of fully labeled (black spectra) and dilute-labeled channels (gray spectra) are superimposed in Figure 2. Broadening in the fully labeled samples with respect to the underlabeled samples is due to spin-spin interactions. Because of the tetrameric geometry of the channel, two sets of distances between spin labels are present in the fully labeled samples: lateral and diagonal. The ambiguity introduced by both lateral and diagonal spin pairs complicates the extraction of quantitative distances from continuous wave (CW) EPR spectral line shapes. The interaction parameter (Ω) is defined as the ratio of central line amplitudes (M = 0) of the normalized dilute-labeled and fully labeled spectra and can be used as a qualitative measure of interspin proximity.12 Comparison of Ω values has been previously used to characterize the structural rearrangements of other homooligomeric channels.13
Through-space magnetic dipolar interaction between two spin labels less than ∼20 Å apart leads to distance-dependent broadening of the CW EPR spectral line shapes.14 For distances exceeding ∼20 Å, spin-spin interactions cause no detectable difference in the peak-to-peak amplitude, and Ω is approximately equal to one. Spin labels separated by less than 13 Å within an oligomer can result in such broadened lines that the central line amplitude becomes negligible compared to the nonbroadened amplitude.
As shown in Figure 2, dipolar broadening (Ω > 1) occurs for all three conditions for the M2TM-WT peptide, consistent with the formation of a tetrameric bundle with N-terminal ends within ∼20 Å. The Ω value measured for M2TM-WT under the high pH, drug-free condition is 1.3. This is on the order of the previously measured Ω value of 1.6 for a M2TM peptide reconstituted into a different, but related, set of conditions (POPC bilayers at pH 8.6).7 As pH is lowered to pH 5.6 for M2TM-WT, Ω is reduced to 1.1, indicating that the N-terminal spin labels move apart within the tetramer. This is consistent with solid-state NMR (ssNMR) structural studies showing increased hydration of the channel lumen at lower pH.15 When amantadine is added to M2TM-WT (pH 7.8), the fully labeled spectrum significantly broadens due to the presence of distance-dependent dipolar coupling (Ω increase to 2.5), consistent with a conformational change upon drug binding that brings the N-terminal spin-labeled ends of the TM domains closer together.
There is also a significant and reproducible change in the line shape of the dilute-labeled EPR spectrum of M2TM-WT upon drug binding, reflecting a change in motional dynamics of the spin label that is independent of spin-spin interaction. The change in line shape for dilute-labeled M2TM-WT channels upon the addition of drug is highlighted in the upper row of Figure 3(A), where the EPR spectrum of the drug-bound state (blue) is compared to that of the drug-free state (black) at pH 7.8. The drug-bound dilute-spin line shape is a composite of multiple spectra, consistent with the peptides sampling at least two conformations that have different dynamic properties. The existence of multiple conformations was previously observed for M2TM (22–46) in bilayers using ssNMR spectroscopy methods.15, 16 The ssNMR data also suggested that the relative populations of conformational states sampled by M2TM (22–46) depend both on the types of lipid used to form the membrane bilayers and the presence of drug.15, 16
Figure 3.

Comparison of dilute-labeled spectra of spin-labeled M2TM peptides. EPR spectra of dilute-labeled channels shown in Figure 2 are overlaid to compare spectral line shapes. (A) pH 7.8 without drug (black) and pH 7.8 with drug (blue) for M2TM-WT (top) and M2TM-H37F (bottom). (B) M2TM-WT (black) and M2TM-H37F (magenta) at pH 7.8 without drug.
Conformation of control M2TM-H37F peptide does not change with pH or drug
Distance-dependent spin-spin interactions are not detected for the M2TM-H37F peptide under any condition, indicating that the N-terminal ends of the TM domains of these peptides are more than ∼20 Å apart under all three sets of conditions (Fig. 2, bottom row). Furthermore, the spectral line shape of dilute-labeled M2TM-H37F peptide was unaffected by the addition of drug [Fig. 3(A), bottom row]. The lack of spectral changes for the M2TM-H37F peptides in the presence of drug is in agreement with previous findings that His37 is critical for drug binding of M2.17 We note that the spectrum of dilute-labeled M2TM-WT peptide under drug-free conditions is very similar to the spectrum of the M2TM-H37F under drug-free conditions [Fig. 3(B)], despite the significant differences seen in dipolar spin-spin interactions between the two peptides in Figure 2. These EPR results suggest that the M2TM-H37F peptides do oligomerize in lipid bilayers, but that the helical bundles are significantly less well packed, resulting in no detectable spin-spin interaction. This is in agreement with electrophysiological studies that have shown that an H37F M2 mutant protein does form channels; however, the channels are not proton selective.11 Previous biophysical studies have also demonstrated that M2TM-H37F peptides do tetramerize but have a weaker association within the homotetramer compared to M2TM-WT.18
Drug binding leads to closer packing of TM domain of M2TMC peptides
Conformational flexibility of the spin-labels at the N-termini of M2TM peptides limits the resolution of the structural information that can be determined.7 Thus, we next spin labeled several sites along the TM helix (L36, I39, I42, and L43) of a longer M2 peptide (M2TMC 23–60) and looked at the EPR spectra both with and without drug present. The spin-labeling sites in the TM domain were carefully chosen to prevent potential perturbation of the native fold due to spin-label attachment. All four sites (36, 39, 42, and 43) point away from the channel pore in previously solved structures19, 20 and were previously shown not to perturb channel function upon mutation to cysteine.21
The spin interaction Ω values for spin labels located at sites 36, 39, 42, and 43 in the drug-free form of the M2TMC channel (Fig. 4, gray bars) decrease as one moves from the site located deepest in the membrane bilayer (Site 36) toward the C-terminal end of the TM domain. This pattern of Ω values indicates that the channel gets wider at the C-terminal end, as seen in several previously published structures of M2.4 Upon addition of drug, the spin-labeled TM sites all have increased Ω values (Fig. 4, black bars), consistent with a narrower TM tetrameric bundle in the drug-bound form of M2, as seen and discussed above in our EPR results for the M2TM-WT peptide.
Figure 4.

Drug-induced conformational change of spin-labeled sites within the transmembrane domain of the M2TMC (23–60) peptides. Interaction parameter (Ω) values for spin labels at specified positions on the M2TMC peptide in POPC:POPG (4:1 molar ratio) liposomes (1:200 peptide:lipid molar ratio) at pH 7.8 without drug (gray) and with drug (black), 1:20 peptide:rimantadine molar ratio, 10 mol % drug-to-lipid ratio. Interaction parameter (Ω) reflects intersubunit proximity within the tetrameric bundle. Ω is the ratio of central line amplitudes (M = 0) of the normalized dilute labeled and fully labeled spectra. Error bars shown reflect the uncertainty in amplitudes of the dilute labeled and fully labeled spectra due to spectral signal-to-noise. CW X-band EPR spectra used to calculate Ω values included in online Supporting Information (Supporting Information Figure S1).
As a measurement of the relative mobility of the spin-labeled sites both with and without drug, we calculated the inverse peak-to-peak width of the central line, ΔHpp(0)−1, or simply ΔH , from each of the dilute labeled spectra corresponding to the sites shown in Figure 4. Increase in the line width of a dilute-labeled spectrum correlates with reduced mobility, which would then be reflected in a reduced inverse value of ΔH
 . Despite the significant changes in distance-dependent dipolar couplings upon drug binding, there were no significant changes in measured values of ΔH
 calculated from dilute-labeled spectra. This is perhaps not surprising since the spin-labeling sites in the TM domain all point outward from the pore toward the lipids, having been carefully chosen to prevent potential perturbation of the native fold due to spin-label attachment.
Drug binding leads to closer approach of the C-terminal amphipathic helices
We previously published spin-label data for nine consecutive sites (48–56) C-terminal to the TM region.8 We demonstrated that this C-terminal region was a membrane surface alpha helix based upon periodic variations in lipid accessibility data and patterns of spin label-spin label couplings within the tetrameric bundle. Here, we show data for two more residues (46 and 47) and examine spectral changes that occur upon the addition of adamantane drugs. All the sites chosen for spin labeling do not significantly perturb channel function upon mutation to cysteine.8, 21 Note that spin-label data for Site 49 are not included since a mutation to cysteine at Lys 49 is detrimental to channel function.8
Spin interaction Ω values for C-terminal spin labels are plotted in Figure 5. Compared to the drug-free state (gray bars), all the Ω values were increased upon addition of drug (black bars), indicating that interspin distances were shortened upon addition of drug. The shortest distances for both drug-free and drug-bound forms are in the segment of residues 51–53, suggesting a geometric arrangement that is similar between the drug-bound and drug-free states but closer together in the presence of drug.
Figure 5.

Drug-induced conformational change of spin-labeled sites within the C-terminal helix of the M2TMC (23–60) peptides. (A) Interaction parameter (Ω) values for spin labels at specified positions on the M2TMC peptide in POPC:POPG (4:1 molar ratio) liposomes (1:200 peptide:lipid molar ratio) at pH 7.8 without drug (gray) and with drug (black), 1:25 peptide:rimantadine molar ratio, 7.5 mol % drug-to-lipid ratio. Interaction parameter (Ω) reflects intersubunit proximity within the tetrameric bundle. Ω is the ratio of central line amplitudes (M = 0) of the normalized dilute labeled and fully labeled spectra. Error bars shown reflect the uncertainty in amplitudes of the dilute labeled and fully labeled spectra due to spectral signal-to-noise. CW X-band EPR spectra used to calculate Ω values included in online Supporting Information (Supporting Information Figure S1). (B) O2 accessibilities without drug (gray) and with drug (black). Error bars on the ΔP1/2 parameters are the 95% confidence intervals from the fits to the power saturation curves described in the Materials and Methods section. Data for spin labels at Site 49 are omitted since a K49C mutation causes loss of ion channel function.
As a measurement of the relative mobility of the spin-labeled sites both with and without drug, we calculated the inverse peak-to-peak width of the central line, ΔH , from each of the dilute-labeled spectra corresponding to the sites shown in Figure 5. There were no significant changes in measured values of ΔH
 for this C-terminal region, although the changes in Ω values clearly indicate that drug binding leads to closer approach of the C-terminal amphipathic helices. As shown in several earlier studies on M2, the protein is intrinsically dynamic,15, 16 and the overall motion of the C-terminal region, particularly flexibility about the hinge between the TM helix and the C-terminal helix, could make it difficult to detect motional changes due to drug binding within the C-terminal region using the qualitative estimate provided by calculation of ΔH
 values.
Collision frequencies between spin labels and paramagnetic O2 were measured using power saturation techniques. Molecular oxygen is a small hydrophobic species that partitions into lipid bilayers. O2 concentration is greatest in the center of the bilayer and decreases toward the membrane surface. Residue-by-residue patterns of measured accessibilities to O2 have been used to predict a protein's secondary structure and topology with respect to the membrane.14 O2 accessibilities for the drug-free (gray line) and drug-bound (black line) states are shown in Figure 5(B). O2 accessibility data for the drug-free state show a periodic variation typical for an amphipathic α-helix lying on the surface of a membrane bilayer. For the drug-free state, the sites with the largest oxygen accessibilities correspond to the most membrane-embedded sites of the amphipathic helix (hydrophobic residues F48, I51, and F55). Interestingly, upon drug binding, the O2 accessibilities of Sites 51–52 significantly decrease, disrupting the periodicity expected for an isolated membrane-surface helix where oxygen accessibility is simply determined by the amount of O2 dissolved in the lipids. It is possible that drug-induced peptide-peptide interactions, and not simply depth in the hydrophobic membrane,14 are impacting the measured O2 accessibilities in the region of Sites 51–52. The existence of tight peptide-peptide interactions between helical subunits in the homotetramer is consistent with the large Ω values measured for this region in the drug-bound state.
While O2 accessibility data can be informative about membrane topology for membrane protein surface helices, these accessibilities can be difficult to interpret for tightly packed regions of a protein or for residues lying along a water-permeable membrane channel. Thus, we employed a different relaxation agent to explore conformational properties of the sites we spin labeled along the TM channel domain.
Accessibility of spin-labeled sites to Ni(II) chelated to a lipid head group
We measured the proximity of our spin-labeled TM sites to the membrane–aqueous interface using paramagnetic Ni(II) chelated to a lipid head group. Ni-chelate lipid accessibility studies have been used to identify spin-labeled peptide sites proximal to the membrane surface in other SDSL-EPR studies of membrane proteins.22 The accessibility of spin-labeled M2TMC TM sites to Ni-chelate lipid is shown in Figure 6. Accessibility data for a spin label within the membrane surface C-terminal helix (Site 48) is included as a reference. In the absence of drug, all of the sites shown in Figure 6 showed some accessibility to the Ni-chelate lipid. Ni-chelate lipid accessibility to Site 48 was the largest among the five sites shown, consistent with the C-terminal amphipathic helix lying along the membrane surface. The larger accessibility of Sites 42/43 compared to Sites 36/39 is consistent with these two residues being part of a transitional region between the TM domain and the C-terminal helix.
Figure 6.
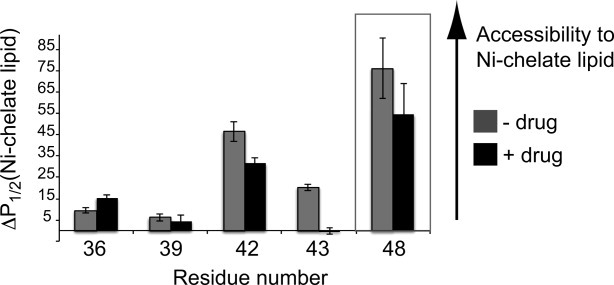
Drug binding changes accessibility of spin-labels to the membrane interface. Accessibility of spin labels to lipid-headgroup-chelated Ni(II) in POPC:POPG (4:1 molar ratio) liposomes 1:200 peptide:lipid molar ratio at pH 7.8 without drug (gray) and with drug (black) 1:20 peptide:rimantadine molar ratio, 10 mol % drug-to-lipid ratio. Sites 36–43 are in the TM domain. Site 48 is within the C-terminal surface helix and included as a reference to indicate the access the lipid-headgroup-chelated Ni(II) has to a membrane surface residue. Error bars on the ΔP1/2 parameters are the 95% confidence intervals from the fits to the power saturation curves described in the Materials and Methods section.
Upon addition of drug, the most notable change is the complete loss of accessibility at Site 43 to the Ni-chelate lipid. The drug-bound data shown in Figure 6 were collected in a molar excess of drug (1:20 peptide:drug molar ratio, which is equivalent to 1:80 channel:drug molar ratio since the protein is tetrameric). To further characterize what is happening to a spin label located at Site 43, accessibilities to Ni-chelate lipid were collected over a range of drug concentrations (Fig. 7). When drug is added at 1:1 or 1:4 channel:drug molar ratio, there is no significant change in accessibility compared to the accessibility measured in the absence of drug. Upon addition of 20-fold molar excess of drug to the channel, accessibility of Site 43 to Ni-chelate lipids is significantly reduced. Upon addition of 80-fold molar excess of drug to the channel, we observe a complete loss of accessibility of the spin label at Site 43 to the Ni-chelate lipid.
Figure 7.

Accessibility of Site 43 to Ni-chelated lipid over a range of drug concentrations. Accessibility of spin labels to lipid-headgroup-chelated Ni(II) for M2TMC-L43SL in POPC/POPG 4:1 liposomes, 1:200 peptide:lipid molar ratio, at pH 7.8 at the indicated channel:rimantadine ratios. Error bars on the ΔP1/2 parameters are the 95% confidence intervals from the fits to the power saturation curves described in the Materials and Methods section.
Discussion
Comparison of drug-free conformation of M2TMC in lipid bilayers with ssNMR model
This study expands upon the previously published spin-label EPR data available for M27, 8 to include new information on TM sites and additional C-terminal domain sites. It is instructive to examine how our EPR data from the 14 spin-labeled sites on M2TMC (23–60) compare to the most recently published structure of a similar M2 peptide (M2TMC 22–66) in lipid bilayers (PDB structure 2L0J).20 This most recently published structural model was determined using ssNMR and was collected in the absence of drug.20
Supporting Information Figures S2–S4 compare our drug-free M2TMC (23–60) EPR data with the published drug-free ssNMR model. There is reasonable agreement between our EPR data and the packing of the TM domain (Supporting Information Fig. S2) and the depth of TM sites in the membrane (Supporting Information Fig. S3). Although EPR data and the ssNMR model for the C-terminal membrane surface helical sites both show a periodic pattern expected for the three-dimensional proximity of helices, the sites of closest approach are different (Supporting Information Fig. S4). The lipid membranes employed in our study are different from those used in the ssNMR study, and the interaction between the C-terminal amphipathic helix and the membrane surface likely differs. The ssNMR structure was determined in neutral DOPC:DOPE (4:1 molar ratio) bilayers, whereas our EPR samples used negatively charged POPC:POPG (4:1 molar ratio) bilayers. It has already been established that membrane properties affect the conformational states sampled by the M2 protein.7, 15 Sensitivity of the conformation of the M2 protein to hydrophobic environment was also hypothesized to account for differences between a solution NMR structure determined in detergent micelles and previously published SDSL-EPR work on the C-terminal domain of M2TMC (23–60) in lipid bilayers.8
M2 conformational changes in the TM domain upon binding of adamantane drugs
The EPR data presented here clearly demonstrate that the conformation of the TM domain of M2 changes significantly upon addition of drug. Measurements of distance-dependent spin-spin couplings reveal that the pore formed by homotetramerization of the TM helices becomes narrower in the presence of drug. Previous studies have demonstrated that the high-affinity drug binding site is located in the N-terminal channel lumen near Ser 31 and drug binding to this site leads to a more rigid conformation of the M2 channel.23 Based on analysis of ssNMR chemical shifts, it has been proposed that M2 can sample a range of conformational states, but addition of drug reduces the range of states sampled and promotes a motionally restricted conformation with a well-defined kink at Gly 34.15
M2 conformational changes in the C-terminal domain upon binding of adamantane drugs
While a range of studies has focused on the changes in the TM domain upon drug binding, less has been published about how drug binding can alter the conformation and dynamics of the C-terminal amphipathic helix. The EPR data presented here suggest that the geometric arrangement of the C-terminal domain is similar between the drug-bound and drug-free states but that the C-terminal helices are more closely packed in the presence of drug. Drug binding to the high affinity site within the TM pore leads to constriction of the TM domain that could be propagated out to the C-terminal helices. Binding to the secondary lower affinity site was probed by examining EPR spectral changes over a range of drug concentrations.
Spectral changes vary with drug concentration
EPR data over a range of drug concentrations allowed us to probe binding to both the high affinity binding site within the channel pore as well as the secondary site located near the C-terminal end of the TM domain. The high affinity site, which can be occupied by a single adamantane drug molecule, is located in the channel pore near the N-terminal lumen, surrounded by residues 27, 30, 31, and 34.4, 6, 23 The four equivalent low-affinity sites are located on the outer rim of the C-terminal end of the TM homotetrameric helical bundle interacting with residues 40–45.4, 9
As the concentration of drug increases, the accessibility of a spin label at Site 43 to Ni-chelate lipid decreases. Accessibility is unchanged at 1:1 and 1:4 channel:drug molar ratios but significantly decreases at 1:20 channel:drug molar ratios, with a complete loss of accessibility at a 1:80 channel:drug molar ratio. Spectral changes at the two highest drug concentrations tested are consistent with drug binding to the lower affinity exterior binding site of M2, of which Leu 43 is proposed to be a part. The decrease in accessibility of the spin label at Site 43 at high drug concentrations could reflect bound drug molecules blocking access to Ni-chelate lipid or a drug-induced conformational change that prevents the same access.
When characterizing the binding of a drug to a membrane protein embedded in lipid bilayers, it is important to consider how the drug interacts with membrane lipids. Adamantane drugs are lipophilic and have been shown to partition extensively into lipid bilayers where they localize to the hydrophilic/hydrophobic interface.24, 25 Thus, in addition to the drug:protein ratio, the drug-to-lipid ratio also impacts drug-binding properties. An ssNMR study of M2TM (22–46) peptide in DMPC bilayers indicated that binding to the lower affinity exterior site of M2 could be observed when the drug was present at drug-to-lipid ratios above 7 mol %.23 Adamantane membrane partition coefficients depend strongly on the lipid composition,24 and the drug-to-lipid ratio at which binding sites are occupied will vary depending on membrane composition. Here, we used POPC:POPG (4:1 molar ratio) bilayers with a peptide:lipid molar ratio of 1:200 (channel:lipid molar ratio of 1:800 since the protein is tetrameric). The two highest drug concentrations (1:20 and 1:80 channel:drug molar ratio) correspond to 2.5 and 10 mol % drug-to-lipid ratios, respectively. Thus, under our sample conditions, the lower affinity exterior binding site appears to be at least partially occupied at 2.5 mol % drug-to-lipid ratio based upon the Ni-chelate accessibility data shown in Figure 7. The drug-to-lipid ratios used for the spectral studies reported in Figures 2–6 were 5 mol % drug-to-lipid and higher. The drug-induced conformational changes we demonstrate thus appear to result from interaction with both the high affinity site inside the TM pore as well as the second lower affinity, lipid-exposed site found near the cytoplasmic end of the channel. There is also some evidence that the partitioning of adamantane drugs into membranes can impact the physical properties of lipid bilayers25 and, as such, impact the conformations sampled by the M2 protein through changes in surrounding membrane lipids.
Conclusions
Here, we have reported a more complete set of SDSL-EPR data for the M2 protein in lipid bilayers than previously published: residue-by-residue interhelix distances and accessibilities to paramagnetic relaxation agents for select sites within the TM domain, and a more complete coverage of the amphipathic helix C-terminal to the TM domain. M2 conformational information inferred from EPR data collected in the absence of drug is broadly consistent with a recent ssNMR model for the drug-free state, although differences might have resulted from the choice of lipids to form membrane bilayers.
Upon drug binding, the M2 protein assumes a constricted conformation characterized by shortened distances between both the TM and the membrane surface helices within the tetrameric bundle. Interestingly, at high drug concentrations, there was a complete loss of accessibility to Ni-chelate lipid at Site 43. We investigated what might cause this observation by titrating down the amount of drug added. We found that, as drug concentration is lowered, accessibility of Site 43 to Ni-chelate lipid is restored. This observation is consistent with the existence of two drug binding sites, the second of which is occupied at 2.5 mol % drug-to-lipid ratio and above for the M2TMC (23–60) peptides embedded in POPC:POPG (4:1 molar ratio) lipid bilayers.
Materials and Methods
Synthesis and spin labeling of peptides
Peptide synthesis and purification were performed as described previously,8 and sequences of peptides are provided in Figure 1. M2TM peptides were nitroxide spin labeled at the N-terminus using the 2,2,5,5-tetramethyl-3-pyrrolin-1-oxyl-3-carboxylic acid N-hydroxysuccinimide ester.7 M2TMC peptides were nitroxide spin labeled using cysteine-specific 1-oxyl-2,2,5,5-tetramethyl-3-pyrroline-3-methyl methanethiosulfonate spin labels.8
Reconstitution of M2 peptides into lipid bilayers
M2 peptides were reconstituted into lipid bilayers consisting of POPC and POPG, POPC:POPG 4:1 molar ratio. The peptide:lipid molar ratio was 1:200. The reconstitution protocol was described in detail previously.8 The buffer for pH 7.8 samples was 50 mM Tris, 100 mM KCl, and 1 mM EDTA. The buffer for pH 5.6 samples was 50 mM MES, 100 mM KCl, and 1 mM EDTA. The buffer used for Ni-chelated lipid accessibility studies did not contain EDTA.
The Ni-chelated lipid used in accessibility measurements was 1,2-dioleoyl-sn-glycero-3-[(N-(5-amino-1-carboxypentyl)iminodiacetic acid)succinyl] nickel salt (DOGS-NTA(Ni)). Bilayers for these measurements had a POPC:POPG:DOGS-NTA(Ni) molar ratio of 4:1:1.25. Use of DOGS-NTA(Ni) to probe membrane protein structure has been described previously.22
Drug stock solutions were prepared in trifluoroethanol, and appropriate volumes were aliquoted into glass vials. Trifluoroethanol was removed first under a gentle stream of nitrogen gas and then under high vacuum overnight to remove remaining solvent. Preformed proteoliposomes were added to drug films, vortexed, and incubated for 24 h at room temperature.
EPR spectroscopy and data analysis
CW EPR spectra were recorded at room temperature on an X-band Bruker EMX spectrometer equipped with an ER4123D resonator. Samples used for analysis of spectral line shapes were placed in glass capillary tubes and EPR spectra were acquired using 2 mW incident microwave power, 1 G field modulation amplitude at 100 kHz, and 150 G sweep width. For comparison of line shapes, each spectrum was double integrated and normalized to the same number of spins.
For power saturation measurements, samples were collected in gas-permeable TPX capillary tubes. Power saturation data were obtained under three sets of conditions: equilibrated with nitrogen gas, equilibrated with ambient air, and equilibrated with nitrogen in the presence of DOGS-NTA(Ni). For experiments with low accessibility to fast relaxing paramagnetic reagents, EPR spectra were measured at eight power levels. For experiments with high accessibility to paramagnetic reagents, 16 power levels were studied as the saturation effect was sometimes significantly mitigated and thus more data points were required to achieve a good fit. Data were analyzed, and ΔP1/2 parameters reflecting side chain accessibility to paramagnetic reagents were determined as described previously.8
Supplementary material
Additional Supporting Information may be found in the online version of this article.
References
- 1.Mchaourab H, Steed R, Kazmier K. Toward the fourth dimension of membrane protein structure: Insight into dynamics from spin-labeling EPR spectroscopy. Structure. 2011;19:1549–1561. doi: 10.1016/j.str.2011.10.009. [DOI] [PMC free article] [PubMed] [Google Scholar]
- 2.Bridges M, Hideg K, Hubbell W. Resolving conformational and rotameric exchange in spin-labeled proteins using saturation recovery EPR. Appl Magn Reson. 2010;37:363–390. doi: 10.1007/s00723-009-0079-2. [DOI] [PMC free article] [PubMed] [Google Scholar]
- 3.Pinto LH, Lamb RA. The M2 proton channels of influenza A and B viruses. J Biol Chem. 2006;281:8997–9000. doi: 10.1074/jbc.R500020200. [DOI] [PubMed] [Google Scholar]
- 4.Wang J, Qiu J, Soto C, Degrado W. Structural and dynamic mechanisms for the function and inhibition of the M2 proton channel from influenza A virus. Curr Opin Struct Biol. 2011;21:68–80. doi: 10.1016/j.sbi.2010.12.002. [DOI] [PMC free article] [PubMed] [Google Scholar]
- 5.Rossman J, Lamb R. Influenza virus assembly and budding. Virology. 2011;411:229–236. doi: 10.1016/j.virol.2010.12.003. [DOI] [PMC free article] [PubMed] [Google Scholar]
- 6.Leonov H, Astrahan P, Krugliak M, Arkin IT. How do aminoadamantanes block the influenza M2 channel and how does resistance develop? J Am Chem Soc. 2011;133:9903–9911. doi: 10.1021/ja202288m. [DOI] [PubMed] [Google Scholar]
- 7.Duong-Ly K, Nanda V, Degrado WF, Howard KP. The conformation of the pore region of the M2 proton channel depends on lipid bilayer environment. Protein Sci. 2005;14:856–861. doi: 10.1110/ps.041185805. [DOI] [PMC free article] [PubMed] [Google Scholar]
- 8.Nguyen PA, Soto CS, Polishchuk A, Caputo GA, Tatko CD, Ma CL, Ohigashi Y, Pinto LH, Degrado WF, Howard KP. pH-induced conformational change of the influenza M2 protein C-terminal domain. Biochemistry. 2008;47:9934–9936. doi: 10.1021/bi801315m. [DOI] [PMC free article] [PubMed] [Google Scholar]
- 9.Pielak RM, Oxenoid K, Chou JJ. Structural investigation of rimantadine inhibition of the AM2–BM2 chimera channel of influenza viruses. Structure. 2011;19:1655–1663. doi: 10.1016/j.str.2011.09.003. [DOI] [PMC free article] [PubMed] [Google Scholar]
- 10.Cady S, Wang T, Hong M. Membrane-dependent effects of a cytoplasmic helix on the structure and drug binding of the influenza virus M2 protein. J Am Chem Soc. 2011;133:11572–11579. doi: 10.1021/ja202051n. [DOI] [PMC free article] [PubMed] [Google Scholar]
- 11.Balannik V, Carnevale V, Fiorin G, Levine BG, Lamb RA, Klein ML, Degrado WF, Pinto LH. Functional studies and modeling of pore-lining residue mutants of the influenza A virus M2 ion channel. Biochemistry. 2010;49:696–708. doi: 10.1021/bi901799k. [DOI] [PMC free article] [PubMed] [Google Scholar]
- 12.Mchaourab HS, Perozo E. Berliner L, Eaton S, Eaton G, editors. Biological magnetic resonance. Distance measurements in biological systems by EPR. 2000. pp. 185–247.
- 13.Perozo E, Cortes DM, Cuello LG. Structural rearrangements underlying K+-channel activation gating. Science. 1999;285:73–78. doi: 10.1126/science.285.5424.73. [DOI] [PubMed] [Google Scholar]
- 14.Klug C, Feix J. Methods and applications of site-directed spin labeling EPR spectroscopy. Methods Cell Biol. 2008;84:617–658. doi: 10.1016/S0091-679X(07)84020-9. [DOI] [PubMed] [Google Scholar]
- 15.Hu F, Luo W, Cady S, Hong M. Conformational plasticity of the influenza A M2 transmembrane helix in lipid bilayers under varying pH, drug binding, and membrane thickness. Biochim Biophys Acta. 2011;1808:415–423. doi: 10.1016/j.bbamem.2010.09.014. [DOI] [PMC free article] [PubMed] [Google Scholar]
- 16.Yi M, Cross T, Zhou H. Conformational heterogeneity of the M2 proton channel and a structural model for channel activation. Proc Natl Acad Sci USA. 2009;106:13311–13316. doi: 10.1073/pnas.0906553106. [DOI] [PMC free article] [PubMed] [Google Scholar]
- 17.Hu F, Schmidt-Rohr K, Hong M. NMR detection of pH-dependent histidine-water proton exchange reveals the conduction mechanism of a transmembrane proton channel. J Am Chem Soc. 2012;134:3703–3713. doi: 10.1021/ja2081185. [DOI] [PMC free article] [PubMed] [Google Scholar]
- 18.Howard KP, Lear JD, Degrado WF. Sequence determinants of the energetics of folding of a transmembrane four-helix-bundle protein. Proc Natl Acad Sci U S A. 2002;99:8568–8572. doi: 10.1073/pnas.132266099. [DOI] [PMC free article] [PubMed] [Google Scholar]
- 19.Acharya R, Carnevale V, Fiorin G, Levine BG, Polishchuk AL, Balannik V, Samish I, Lamb RA, Pinto LH, Degrado WF, Klein ML. Structure and mechanism of proton transport through the transmembrane tetrameric M2 protein bundle of the influenza A virus. Proc Natl Acad Sci U S A. 2010;107:15075–15080. doi: 10.1073/pnas.1007071107. [DOI] [PMC free article] [PubMed] [Google Scholar]
- 20.Sharma M, Yi M, Dong H, Qin H, Peterson E, Busath D, Zhou H, Cross T. Insight into the mechanism of the influenza A proton channel from a structure in a lipid bilayer. Science. 2010;330:509–512. doi: 10.1126/science.1191750. [DOI] [PMC free article] [PubMed] [Google Scholar]
- 21.Pinto LH, Dieckmann GR, Gandhi CS, Papworth CG, Braman J, Shaughnessy MA, Lear JD, Lamb RA, Degrado WF. A functionally defined model for the M2 proton channel of influenza a virus suggests a mechanism for its ion selectivity. Proc Natl Acad Sci U S A. 1997;94:11301–11306. doi: 10.1073/pnas.94.21.11301. [DOI] [PMC free article] [PubMed] [Google Scholar]
- 22.Gross A, Hubbell WL. Identification of protein side chains near the membrane-aqueous interface: a site-directed spin labeling study of KcSA. Biochemistry. 2002;41:1123–1128. doi: 10.1021/bi015828s. [DOI] [PubMed] [Google Scholar]
- 23.Cady SD, Schmidt-Rohr K, Wang J, Soto CS, Degrado WF, Hong M. Structure of the amantadine binding site of influenza M2 proton channels in lipid bilayers. Nature. 2010;463:689–693. doi: 10.1038/nature08722. [DOI] [PMC free article] [PubMed] [Google Scholar]
- 24.Wang J, Schnell J, Chou J. Amantadine partition and localization in phospholipid membrane: a solution NMR study. Biochem Biophys Res Commun. 2004;324:212–217. doi: 10.1016/j.bbrc.2004.09.039. [DOI] [PubMed] [Google Scholar]
- 25.Li C, Yi M, Hu J, Zhou HX, Cross TA. Solid-state NMR and MD simulations of the antiviral drug amantadine solubilized in DMPC bilayers. Biophys J. 2008;94:1295–1302. doi: 10.1529/biophysj.107.112482. [DOI] [PMC free article] [PubMed] [Google Scholar]
Associated Data
This section collects any data citations, data availability statements, or supplementary materials included in this article.