

Abstract
There is considerable interest in determining the activation mechanism of G protein-coupled receptors (GPCRs), one of the most important types of proteins for intercellular signaling. Recently, it was demonstrated for the cannabinoid CB1 GPCR, that a single mutation T210A could make CB1 completely inactive whereas T210I makes it essentially constitutively active. To obtain an understanding of this dramatic dependence of activity on mutation, we used first-principles-based methods to predict the ensemble of low-energy seven-helix conformations for the wild-type (WT) and mutants (T210A and T210I). We find that the transmembrane (TM) helix packings depend markedly on these mutations, leading for T210A to both TM3+TM6 and TM2+TM6 salt-bridge couplings in the cytoplasmic face that explains the inactivity of this mutant. In contrast T210I has no such couplings across the receptor explaining the ease in activating this mutant. WT has just the TM3+TM6 coupling, known to be broken upon GPCR activation. To test this hypothesis on activity, we predicted double mutants that would convert the inactive mutant to normal activity and then confirmed this experimentally. This CB1 activation mechanism, or one similar to it, is expected to play a role in other constitutively active GPCRs as well.
Keywords: protein structure prediction, G protein binding, computational methods, conformational ensemble
Introduction
Activation of G protein-coupled receptors (GPCRs) by extracellular sensory and non-sensory signals affects multiple intracellular signaling cascades by modulating G protein and/or β arrestin-coupled pathways.1 This pleiotropic consequence on GPCR activation is facilitated by their remarkable conformational flexibility, enabling the formation of multiple distinct conformations that can influence function. Because of the putative stability of the inactive state, most GPCR crystal structures correspond to this form: bovine rhodopsin (bRho),2–11 squid (Todarodes pacificus) rhodopsin (sRho),12, 13 human β2 adrenergic receptor (inactHβ2AR),14–16 turkey (Meleagris gallopavo) β1 adrenergic receptor (inactTβ1AR),17, 18 human A2A adenosine receptor (inactHA2AAR),19, 20 human D3 dopamine receptor (hDD3R),21 human CXCR4 receptor (hCXCR4),22 human histamine H1 receptor (hH1HR),23 human sphingosine 1-phosphate 1 receptor (hS1P1R),24 mouse (Mus musculus) μ-opioid receptor (mOPRM),25 mouse δ-opioid receptor (mOPRD),26 human κ-opioid receptor (hOPRK),27 and human NOP opioid receptor (hOPRX).28 However, several crystal structures have captured one or more of the “active” forms of GPCRs: bovine opsin (bOps),29, 30 bovine metarhodopsin II (meta II),31 constitutively active mutant of bRho,32 human β2 adrenergic receptor (actHβ2AR),33–35 and human A2A adenosine receptor (actHA2AAR).36, 37 These latter structures provide molecular level hints of the mechanisms of GPCR activation, but little is known about the structural transformations underlying the conversion of a GPCR from an inactive form through a constitutively active wild-type (WT) form to a more constitutively active form.
The cannabinoid CB1 receptor, which is located mainly in the central nervous system, displays partial constitutive activity. We have shown previously38 and confirm here using GTPγS assays (Fig. 1), that mutating the Thr residue T210 near the cytoplasmic end of transmembrane 3 (TM3) to Ala makes CB1 inactive, whereas substituting in Ile makes it highly constitutively active.38 The residue T210 will be referred to as T3.46 throughout the remainder of this manuscript (using the Ballesteros-Weinstein numbering scheme39), indicating that it is located one helix turn above the conserved R3.50 residue (see Fig. S1A in Supporting Information). Tables SIA and SIB (Supporting Information) summarize previous experimental results for CB1 WT receptor and these two mutants. Changes in binding profiles for the inverse agonist rimonabant in the presence and absence of G protein-coupling indicated that the T3.46I receptor adopts the active state, while the T3.46A receptor is in an inactive state38 (Supporting Information, Table SIB). We found experimentally that a high concentration of GTPγS precludes G protein-coupling, promoting the inactive form. Under these conditions, T3.46I, which otherwise has a weak binding affinity for inverse agonists, displayed a 30-fold enhancement in its affinity for rimonabant. In comparison, the WT receptor displayed a five-fold increase in rimonabant affinity, while the T3.46A receptor showed a negligible increase in affinity for this ligand. This hierarchy of rimonabant affinity changes in the absence of the G protein-coupling parallels the ease with which each receptor adopts an inactive conformation.38 These major changes upon single point mutations provide an excellent system for probing the molecular mechanisms of GPCR activation, allowing us to follow the structural changes from the fully inactive form, through the weakly constitutively active form typically seen in WT receptors, to the highly constitutively active form.
Figure 1.

Comparison of basal GTPγS binding to HEK293 cell membranes expressing the CB1 receptors. The level of [35S]GTPγS binding was measured in the absence of ligand for the WT, T3.46I, and T3.46A receptors. The [35S]GTPγS binding for the mock-transfected, and for the membrane expressing the WT receptor with inverse agonist rimonabant treatment, are shown for comparison. Data are presented as specific binding of GTPγS to the membrane preparation. Nonspecific binding was determined in the presence of 10 μM unlabeled GTPγS. Each data point represents the mean ± S.E.M. of at least three independent experiments performed in duplicate. Statistical significance of the differences between the level of each receptor and that of a mock-transfected sample was assessed using one-way ANOVA and Bonferroni's post hoc test; *, P < 0.05; **, P < 0.01; ***, P < 0.001. The dashed line indicates the level of non CB1-mediated GTPγS binding obtained from [35S]GTPγS binding to the mock-transfected membrane sample (see also Fig. S1 and Supporting Information, Table SI.)
To provide the structural information needed to understand activation of GPCRs, we have been developing first-principles-based computational methods40, 41 to predict the ensemble of energetically favorable conformations available to play a role in multiple GPCR-mediated pathways. Our objective is to accurately predict multiple conformations of a GPCR that may or may not be closely related to the crystallographically characterized receptors. Homology modeling approaches are not yet capable of predicting such multiple conformations, as shown below in the discussion. We report here the results of applying these methods to CB1, providing a structural basis for understanding the dramatic effects on activation observed experimentally for single mutations at the T3.46 position in this receptor.38 We then use this structural understanding to predict two double mutants expected to convert the fully inactive T3.46A to WT level constitutively activity, which we subsequently confirm experimentally with GTPγS binding assays. This strongly supports the predicted structures, and reaffirms the proposed structural basis for the activation mechanism for CB1 receptor.
Results
Basal GTPγS binding as a measurement of G protein-coupling activity reveals that T3.46I is highly constitutively active whereas T3.46A is fully inactive
To evaluate the basal G protein-coupling activity of the WT, T3.46A, and T3.46I receptors, we measured the level of [35S]GTPγS binding to HEK293 cell membranes expressing the receptors in the absence of ligand (Fig. 1). Specific GTPγS binding for the T3.46A receptor is 52.6 fmol/mg in the absence of the ligand which is comparable to the level observed in a mock-transfected sample and with the level of the WT sampled after treatment with the rimonabant inverse agonist. Thus, we refer to T3.46A as “fully inactive.” For the WT receptor in the absence of the ligand the level of GTPγS binding is 91.3 fmol/mg, an increase of 37.8 fmol/mg above the level of the mock-transfected sample whereas for the T3.46I mutant it is 112.4 fmol/mg, an increase of 58.9 fmol/mg. These data are consistent with the previous ligand binding profile,38 confirming that the T3.46A receptor is inactive and unable to bind to the G protein, the WT receptor has constitutive activity, and the T3.46I receptor is much more constitutively active, with the latter two able to couple to the G protein.
Predictions of the stable structural ensembles for CB1 WT and mutant receptors
To identify a structural basis for the experimental findings, we used the GPCR Ensemble of Structures in Membrane Bilayer Environment (GEnSeMBLE) method40, 41 to predict the ensemble of energetically favorable conformations, in other words the packing within the seven-helix bundle, for all three CB1 receptors (WT, T3.46A, and T3.46I). The methodology is described below in the “Materials and Methods” Section and in more detail in Section S7 of Supporting Information.
We find that these mutations of T3.46 lead to substantial changes in helix packing within the seven-helix bundle, which in turn lead to major differences in the salt-bridge interactions between the cytoplasmic end of TM6, which is expected to play a role in activation, with other TMs, as described in Supplementary Information Section S3, especially Supporting Information, Table SIIA, provides the results for the three receptors.
Intermolecular interactions in the inactive T3.46A receptor
The consensus salt-bridge patterns in the predicted ensemble of low energy conformations for the T3.46A, WT, and T3.46I receptors are shown in Table I and Figure 2. The consensus set is defined by the presence of the particular interhelical interaction in more than half of the 10 lowest energy conformations. The differences in the consensus set of interactions for each receptor clearly show that there are major differences in the helix packing of each receptor. The conformations of the inactive mutant T3.46A receptor lead to a consensus salt-bridge pattern [Table I and Fig. 2(A)] that includes the following salt-bridges, indicated by a plus (+) throughout the manuscript, and hydrogen bonds, indicated by a dash (–) throughout the manuscript:
Table I.
Comparison of Consensus Salt-bridge Patterns for Each of the Previously Discussed Receptors (T3.46A, WT, and T3.46I) Plus our Proposed Double Mutants (T3.46A/R2.37Q and T3.46A/R2.37A)
| Receptor | Level of activity | R2.37(Q/A) + D6.30 hydrogen bond | R3.50 + D6.30 ionic lock | R2.37(Q/A) + D3.49 hydrogen bond | R5.71 + D6.30 salt-bridge | D2.63 + K3.28 salt-bridge | D3.49 + K4.41 salt-bridge |
|---|---|---|---|---|---|---|---|
| T3.46A | Fully inactive | Yes | Yes | No | No | No | Yes |
| T3.46A/R2.37A | Partially constitutively active | No | No | No | No | Yes | Yes |
| T3.46A/R2.37Q | Partially constitutively active | No | Yes | Yes | No | Yes | Yes/No |
| WT | Partially constitutively active | No | Yes | Yes | No | Yes | Yes |
| T3.46I | Highly constitutively active | No | No | Yes | Yes | Yes | No |
See also Supporting Information Table SII and Figure S4.
Figure 2.

(A–C) Predicted structures of the T3.46A, WT, and T3.46I receptors, showing the salt-bridges and hydrogen bonds formed on the cytoplasmic side. (A–C) Receptors are selected based on lowest average energy in Table I and best agreement with the consensus pattern of salt-bridges and hydrogen bonds. T3.46A (A) is represented by T3.46A-1, WT (B) is WT-3, and T3.46I (C) is T3.46I-4. These models for each receptor are used throughout this paper. Salt-bridges and hydrogen bonds in the consensus pattern are indicated by arrows and shaded boxes. Dotted lines show the hydrogen bonds between the residues (see also Supporting Information, Tables SII and SIII.). [Color figure can be viewed in the online issue, which is available at wileyonlinelibrary.com.]
 |
We propose that the critical interactions opposing activation in this inactive receptor (T3.46A) are two ionic locks, defined as salt-bridge interactions that putatively keep a receptor inactive:
R3.50 + D6.30 between the conserved residue Arg of the DRY motif at the cytoplasmic end of TM3 and the Asp on TM6, and
R2.37 + D6.30 between Arg at the cytoplasmic end of TM2 and Asp on TM6.
The hydrogen bond between TMs 2 and 6 [(H2.41–R6.32), located approximately one turn above the (R2.37 + D6.30) interaction], further strengthens the coupling between TM2 and TM6.
The TM3+TM6 coupling is observed in crystal structures of such inactive GPCRs as bRho,2–11 sRho,12, 13 hDD3R,21 and thermally stabilized inactTβ1AR17 and inactHA2AAR20 mutants. Furthermore, experimental studies showed that protonation of E6.30 of the inactHβ2AR causes activation,42 and that breaking of this ionic lock is necessary for full activation.43 The (D3.49 + K4.41) interaction is similar to the salt-bridge between D3.49 and R4.37 in the hCXCR4 crystal.27 Likewise, the extracellular (D6.58 + K7.32) interaction is similar to the salt-bridge between D6.58 and H7.32 in the hCXCR4 crystal.27
Conversely, the TM2+TM6 coupling is unique to this CB1 mutant. We believe this ionic lock is critical for maintaining the receptor in its fully inactive form.
Intermolecular interactions in the constitutively active WT receptor
The consensus interaction network for the WT conformational ensemble [Table I and Fig. 2(B)] includes six salt-bridges. Three of these salt-bridges [(D3.49 + K4.41), (R3.50 + D6.30), and (D6.58 + K7.32)] were also present in the T3.46A consensus and in the crystallographically characterized inactive class A GPCRs discussed above, and are therefore consistent with known systems.
The three additional salt-bridges found in the WT protein conformational ensemble are: (R2.37 + D3.49), (H2.41 + D3.49), and (D2.63 + K3.28). In the T3.46A mutant receptor, we found that R2.37 interacts with D6.30, but in the WT it forms a salt-bridge with D3.49 as shown in Figure 2(B). The most remarkable difference between WT and T3.46A is that T3.46A receptor has two polar interactions between TMs 2 and 6, (R2.37 + D6.30) and (H2.41–R6.32), which are not observed in the WT receptor. Thus, instead of the direct TM2+TM6 coupling in the T3.46A mutant, the WT receptor displays the TM2+TM3 coupling between nearest-neighbor TMs.
The WT conformational ensemble consensus interaction also has four hydrogen bonds including (S2.45–T3.46) [Supporting Information, Fig. S1(B)]. This hydrogen bond is especially important because it involves the residue (T3.46), whose mutation causes the large changes in structure being investigated here.
Intermolecular interactions in the much more constitutively active (than WT) T3.46I receptor
The consensus of the highly constitutively active mutant T3.46I conformational ensemble [Table I and Fig. 2(C)] includes four salt-bridges and two hydrogen bonds: (R2.37 + D3.49), (H2.41 + D3.49), (D2.63 + K3.28), (R5.71 + D6.30), (Y2.40–R4.39), and (C6.47–N7.45). The three salt-bridges linking TMs 2 and 3 are present in the WT receptor, but none of them are in the T3.46A mutant. The (R3.50 + D6.30) interaction from the WT is broken in T3.46I as seen in Table I and Figure 2(C). Thus, the T3.46I receptor has no salt-bridges spanning the cytoplasmic side of the TM helix bundle. This end of the T3.46I receptor has a larger diameter (11.6 Å between residues D6.30 and R3.50) than that of T3.46A (8.5 Å) or WT (8.9 Å) enabling it to potentially accommodate the C-terminal α-helix of the Gα protein during activation, which in actHβ2AR-Gs complex is 19.0 Å (PDB ID: 3SN6).35 This makes the extracellular ligand binding pocket more accessible in the T3.46I mutant.
The (R5.71 + D6.30) interaction is unique to the T3.46I mutant conformation and is similar to the TM5+TM6 salt-bridges observed in the constitutively active bRho mutant (PDB ID: 2X72),32 the putatively active bOps (PDB ID: 3CAP, 3DQB),29, 30 meta II (PDB ID: 3PQR, 3PXO),31 and perhaps a water-mediated interaction in the nanobody-bound activated actHβ2AR (PDB ID: 3POG)34 crystal structures. In active bRho, bOps, and meta II, the salt-bridge is formed between K5.66 and E6.30. Thus, the T3.46I mutant has similar structural signatures observed in other activated GPCRs.
Effect of single amino acid mutations on CB1 receptor TM helix packing
Tables IIA and B highlight the differences in the helix orientation angles (defined in Ref. 40) among the three receptors, also shown in Figure 3. The helical axis for these angles is uniquely defined for a straight or kinked helix by taking the least moment of inertia vector from the eigensolution of the moment of inertia matrix for the helix obtained using only heavy backbone atoms.40 Figure 3(A) and Table IIA show that TM2 of WT rotates (η, helix rotation angle) toward TM3 by 90° while TM6 sweeps away (φ, helix sweep angle) from the center of the TM helix bundle by 30° (clockwise). The combination of these two motions breaks the TM2+TM6 coupling of T3.46A. TM2 also tilts (θ, helix tilt angle) toward TM3 by 10° with respect to its counterpart in T3.46A. This movement plus its rotation allows the (R2.37 + D3.49) interaction to form. The TM3+TM6 coupling is maintained for both T3.46A and WT because, unlike TM2, TM3 sweeps toward TM6 by 45°. As for the (D3.49 + K4.41) interaction, TM4 of the WT rotates clockwise by 30° and sweeps 30° toward the center of the TM helix bundle compared to T3.46A. This forward-tilting motion of the cytoplasmic end of TM4 and the rotations of both the TM3 and TM4 helices help maintain the TM3+TM4 coupling in WT.
Table II.
The Predicted Structures for the T3.46A and T3.46I Mutants Have Different Helix Packing Angles. (A and B) Differences in θ, φ, and η Angles for the T3.46A and WT Structures (A) and WT and T3.46I Structures (B), Which Represent the Two Steps of Activation
| (A) | θ (°) | φ (°) | η (°) | ||||||||||||
|---|---|---|---|---|---|---|---|---|---|---|---|---|---|---|---|
| TM# | 2 | 3 | 4 | 6 | 2 | 3 | 4 | 6 | 2 | 3 | 4 | 6 | |||
| T3.46A-1 | 0 | −10 | 10 | 0 | 0 | −30 | 0 | 30 | −150 | −15 | 30 | 15 | |||
| WT-3 | −10 | −10 | 10 | 0 | 0 | 15 | −30 | 0 | −60 | 0 | 0 | 15 | |||
| Change (T3.46A-WT) | 10 | 0 | 0 | 0 | 0 | −45 | 30 | 30 | −90 | −15 | 30 | 0 | |||
| (B) | θ (°) | φ (°) | η (°) | ||||||||||||
|---|---|---|---|---|---|---|---|---|---|---|---|---|---|---|---|
| TM# | 2 | 3 | 4 | 5 | 6 | 2 | 3 | 4 | 5 | 6 | 2 | 3 | 4 | 5 | 6 |
| WT-3 | −10 | −10 | 10 | 0 | 0 | 0 | 15 | −30 | −15 | 0 | −60 | 0 | 0 | −150 | 15 |
| T3.46I-4 | −10 | −10 | 10 | 0 | −10 | 0 | 0 | −15 | 0 | −15 | −60 | 0 | 30 | −90 | 0 |
| Change (WT-T3.46I) | 0 | 0 | 0 | 0 | 10 | 0 | 15 | −15 | −15 | 15 | 0 | 0 | −30 | −60 | 30 |
See also Supporting Information Table SII.
Figure 3.
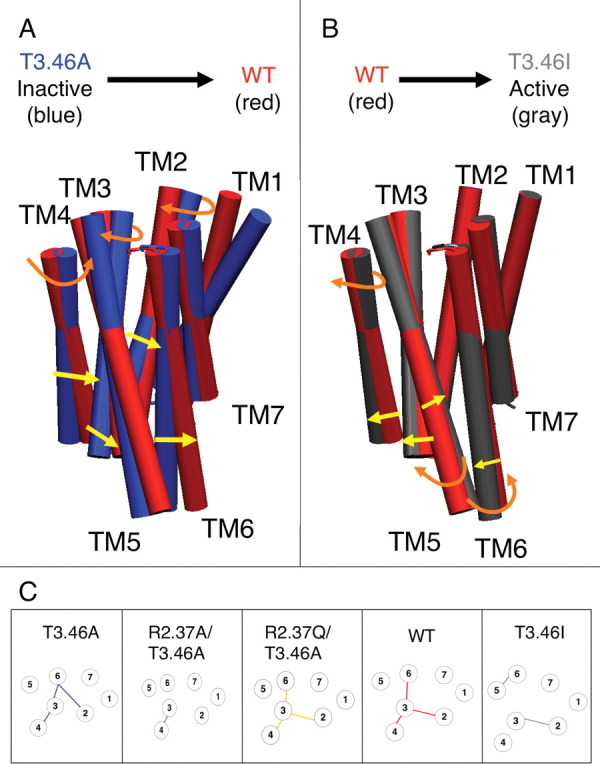
(A–C) Conformational changes in CB1 receptors during activation and the effect on salt-bridges. (A–B) Comparisons of TM helix bundle rearrangement caused by the mutation of T3.46A (blue) to WT (red) (A), or WT to T3.46I (gray) (B). The structures chosen to illustrate the activation mechanism are based upon the lowest average energy rank and the salt-bridge patterns shown in Figures 2(A–C). The T3.46A model corresponds to T3.46A-1, the WT model matches WT-3, and the T3.46I's counterpart is T3.46I-4. Arrows indicate the direction of movement and the change is specified as shifts in the tilt (θ) [yellow], sweep (φ) [yellow], or rotation (η) [orange] angles (see also Table SIII and Figure S2). (C) The ionic locks and salt-bridges critical for activation are illustrated in the predicted structures of human CB1. Circles represent the TM regions (numbered accordingly). Lines connecting the TMs indicate the intracellular salt-bridges stabilizing the α-helices. Extracellular salt-bridges have been omitted. Lines represent the salt-bridges present in the following receptors: T3.46A (blue), T3.46A/R2.37A (green), T3.46A/R2.37Q (yellow), WT (red), and T3.46I (gray).
Comparing T3.46I with WT [Table IIB and Fig. 3(B)], we see that TM6 tilts 10° away from the center of the bundle, breaking the TM3+TM6 coupling. To form the TM5+TM6 coupling of T3.46I, the extracellular ends of TMs 5 and 6 sweep away from each other by 15° causing their cytoplasmic ends to come closer together. These helices also rotate toward each other by 60° and 30°, respectively. The TM3+TM4 coupling is broken by the two helices leaning away from each other by 15°, while TM4 rotates by 30° away from TM3. The TM2+TM3 coupling is maintained due to the stationary TM2. This TM does not move despite the mutation of the adjacent TM's T3.46 to I3.46 whose bulkier side chain would clash with the residues on TM2. TM3 sweeps slightly away from TM2 by 15° to provide more space for the larger side chain of Ile and to avoid repulsive interactions.
Homology modeling is unable to explain these functional effects of single point mutations as shown in Supporting Information, Section S5.1.
Validation of structural basis of T3.46A inactivity by predicting a second mutation (at position R2.37) aimed at restoring constitutive activity to the T3.46A mutant
To evaluate the importance of the TM2+TM6 coupling in maintaining the inactive conformation of the receptor (as in T3.46A), we proposed two double mutants: T3.46A/R2.37A and T3.46A/R2.37Q [Fig. 4(A and B)] that we predicted would restore constitutive activity by breaking the TM2+TM6 coupling. We expected that changing the Arg to a nonpolar Ala or to a charge-neutralizing Gln on the cytoplasmic end of TM2 would break the (R2.37 + D6.30) interaction present in the inactive T3.46A receptor by weakening the interaction with D6.30. This loss of TM2+TM6 coupling should cause the receptor conformation to change and resemble the constitutively active WT receptor, which should be observable in a functional assay.
Figure 4.

(A and B) Conformational predictions of the constitutively active double mutants, T3.46A/R2.37Q and T3.46A/R2.37A. (A–B) Receptors are selected based on lowest average energy in Table I and best agreement with the consensus pattern of salt-bridges and hydrogen bonds. T3.46A/R2.37A (A) is represented by T3.46A/R2.37A-1, and T3.46A/R2.37Q (B) is T3.46A/R2.37Q-3. Salt-bridges and hydrogen bonds in the consensus pattern are indicated by arrows and shaded boxes. Dotted lines show the hydrogen bonds between the residues. (C) Comparison of basal GTPγS binding to HEK293 cell membranes expressing the CB1 receptors including the double mutants (T3.46A/R2.37Q and T3.46A/R2.37A). The level of [35S]GTPγS binding was measured in the absence of ligand for the WT, T3.46I, T3.46A, T3.46/R2.37A, and T3.46/R2.37Q receptors. The level of [35S]GTPγS binding for the mock-transfected membrane sample is shown for comparison. The data description is same as for Figure 1 (see also Supporting Information, Table SIV and Figure S3). [Color figure can be viewed in the online issue, which is available at wileyonlinelibrary.com.]
We proceeded to predict the optimum ensemble of structures for these double mutants using the same computational procedure as for WT and the two single mutants.
For T3.46A/R2.37A double mutant, the consensus interactions of the 10 best-predicted conformations agree with our expectations, resembling a constitutively active receptor. All couplings between TM2 and TM6 and even the (R3.50 + D6.30) interaction are absent in the lowest energy conformations of this double mutant [Fig. 4(A) and Table I]. It also lacks the (R5.71 + D6.30) interaction observed in the highly constitutively active T3.46I receptor. However, it does contain the (D3.49 + K4.41) interaction found in the T3.46A and WT receptors. This receptor also contains the (D2.63 + K3.28) interaction on the extracellular side of the receptor bundle. This salt-bridge is observed in both the constitutively active WT and T3.46I receptors, but not in the inactive T3.46A receptor. The lack of the TM2+TM6 and TM3+TM6 couplings implies that this receptor would be constitutively active. The presence of the TM3+TM4 coupling as seen in WT and inactive T3.46A suggests that this double mutant might be less constitutively active than the WT receptor.
For T3.46A/R2.37Q double mutant receptor, the consensus of the 10 best conformations agrees with our expectations, leading to a salt-bridge similar to that of the WT receptor [Fig. 4(B) and Table I]. The Gln residue at position 2.37 interacts with D3.49 as in the WT and T3.46I receptors, whereas in the inactive T3.46A receptor, the corresponding Arg interacts with D6.30. None of the low-lying T3.46A/R2.37Q double mutant conformations show this interaction as expected. The (R3.50 + D6.30) interaction remains intact in this double mutant, appearing in eight of the 10 lowest energy conformations. Like the T3.46A/R2.37A receptor, it too has the extracellular (D2.63 + K3.28) interaction, which as mentioned above, is seen only in the constitutively active receptors. Half of the structures have the intracellular (D3.49 + K4.41) interaction found in the T3.49A and WT receptors. As the polar interaction patterns closely resemble those of the WT, we predict that the T3.46A/R2.37Q double mutant would make the inactive T3.46A mutant constitutively active. These predicted structures formed the basis of the subsequent GTPγS assays to test the activity of the double mutants as described below.
Experimental confirmation that the double mutants, T3.46A/R2.37Q and T3.46A/R2.37A, are constitutively active
Figure 4(C) shows a comparison of the level of basal GTPγS binding for the double mutants along with the other receptors and the mock-transfected sample shown in Figure 1. As predicted, the T3.46A/R2.37A and T3.46A/R2.37Q receptors are more constitutively active relative to T3.46A. The GTPγS binding in the absence of ligand is larger for the T3.46A/R2.37A and T3.46A/R2.37Q receptors, with levels of 72.2 and 77.4 fmol/mg, respectively, than that of the fully inactive T3.46A receptor (52.6 fmol/mg). Although these two double mutants display less constitutive activity than the WT (91.3 fmol/mg), the mutations of the R2.37 residue produce substantial levels of constitutive activity. This confirms that our models are predictive and accurately show the importance of the critical TM2+TM6 ionic lock in keeping the T3.46A receptor in the inactive conformation. Intriguingly, these double mutant receptors show somewhat different non-covalent interaction patterns. The T3.46A/R2.37Q receptor has (Q2.37–D3.49) and (R3.50 + D6.30) interactions, whereas the T3.46A/R2.37A receptor does not (Table I). However, our functional assay data indicate that the difference between the constitutive activities of these receptors is not statistically significant [Fig. 4(C)].
Discussion
An activation mechanism for CB1 receptor consistent with crystallographically characterized GPCRs and mutagenesis experiments
By comparing the predicted salt-bridge patterns for the human CB1 WT and two mutant receptors, T3.46A and T3.46I, we propose an activation mechanism in terms of receptor transformations. Figure 3(C) illustrates the predicted patterns of four salt-bridges: (R2.37 + D6.30), (R3.50 + D6.30), (D3.49 + K4.41), and (R5.71 + D6.30).
T3.46A (inactive) has the following salt-bridges: (R2.37 + D6.30), (D3.49 + K4.41), and (R3.50 + D6.30).
During the first step of partial activation to form the weakly constitutively active WT, the TM2+TM6 coupling in the inactive T3.46A receptor is broken to form the TM2+TM3 coupling of the WT receptor. Thus, the TM2+TM6 coupling appears to be essential for the receptor to be fully inactive.
The TM3+TM4 and TM3+TM6 couplings break during the second step of activation to form the highly constitutively active T3.46I conformation with a new TM5+TM6 coupling. Thus, the breaking of the TM3+TM6 coupling appears to be responsible for full activation, or beyond WT levels.
Our proposed double mutants, T3.46A/R2.37A and T3.46A/R2.37Q, share salt-bridge signatures with the WT receptor. Based on their structures alone, we predicted that the receptors would be constitutively active, which was subsequently confirmed by our experiments.
These conformational changes lead to helix movements consistent with those observed in the inactive-to-active experimentally characterized GPCRs. For example, they agree with NMR studies of bRho and meta II,44 which showed that TM3 remains fairly rigid and does not re-orient while TM6 moves significantly during activation. Recent crystal structures of activated GPCRs allow us to compare the conformational differences between the antagonist and agonist-bound Hβ2AR34, 35 and HA2AAR,36 or the 11-cis-retinal-bound bRho and the apo-protein bOps,30 with our weakly constitutively active WT and the highly constitutively active T3.46I, as seen in Supporting Information, Table SIII. TMs 1–4 are relatively fixed between bRho and bOps and inactHA2AAR and actHA2AAR, whereas the TMs 5–7 show the greatest structural changes. For example, in bRho, TM6′s cytoplasmic end moves 6–7 Å away from the bundle interior (30), and in HA2AAR, the same helix shifts by 3–4 Å. HA2AAR's movement is smaller than that of bOps because HA2AAR may be constrained by the substitution of T4 lysozyme for the third intracellular loop.36
Our CB1 structures show a similar change as TM6 swings outward by 6.6 Å, which agrees well with the bRho-bOps case.30 In Hβ2AR, E6.30 moves by 11.40 Å when stabilized by a nanobody34 or by 14.7 Å when stabilized by a GS protein,35 while in CB1 the conserved residue shifts by 7.4 Å. Also evident in crystal structures is the movement of TMs 5 and 6 toward each other. In the bRho-bOps activation, the two helices tilt so they become parallel.30 We find the same shifts in TM5 and TM6 of CB1, as seen in Figure 3(B). The most marked differences between our predicted CB1 structures and the crystallized GPCRs occur in the movement of TM7. None of the salt-bridges crucial to activation in CB1 involve TM7, so its placement appears not to be as important as the other TMs.
The CB1 receptor is unusual in that the TM3+TM6 coupling, (R3.50 + D6.30), appears to be insufficient in preventing activation. Several studies have questioned the importance of that salt-bridge interaction in the activation mechanism of the CB receptors. Site-directed mutagenesis of R3.50A in CB2 suggested that this mutation only weakly affects agonist binding and partially affects signaling.45 Another experiment showed that this same CB2 receptor mutation prevented constitutive activation and downfield signaling,46 which would contradict the previous study by indicating the importance of R3.50 in function and signaling. Both studies, however, do agree that the R3.50A mutation does not impact agonist binding. Our modeling studies provide a structural explanation of these experimental results. The ionic lock (R2.37 + D6.30) of the T3.46A mutant spanning the helix bundle is unique while the (R3.50 + D6.30) ionic lock is commonly found in inactive GPCRs. R2.37 is present in CB1, but CB2 has a similar K2.37 residue that we suggest could form a similar the TM2+TM6 coupling. In other class A GPCRs residue 2.37 is most often an Asn, a Ser, or a Thr, which explains why this particular ionic lock has not been observed in most crystallographically characterized receptors. The exception is the hS1P1R crystal structure, but its R2.37 side-chain was not resolved in the crystal structure, and hence, it is not known how this residue interacts. Indeed, it points into the center of the TM helix bundle making the TM2+TM6 coupling possible.24 We believe that this unique (R2.37 + D6.30) interaction rather than the (R3.50 + D6.30) ionic lock is responsible for preventing cannabinoid receptor activation, which would explain the limited importance of the R3.50 residue.
Validation of the role of TM2+TM6 interaction in keeping T3.46A inactive
The predicted structures of the CB1 receptor mutants are consistent with the experimental studies indicating that the R2.37 + D6.30 interaction may be mandatory to maintain the inactive state in the CB1 as well as CB2 receptors. To evaluate the importance of the TM2+TM6 coupling in maintaining the inactive conformation, we proposed two double mutants, T3.46A/R2.37A and T3.46A/R2.37Q expected to break this coupling. We tested this prediction computationally and found that the TM2+TM6 coupling does not form. We experimentally evaluated the consequence of breaking this predicted R2.37 + D6.30 interaction. First, we assessed the thermal stability of the receptors. Consistent with our prediction that the TM2+TM6 coupling impacts receptor conformational flexibility, we observed a substantial decrease in the double mutants' denaturation Tm (Supporting Information, Fig. S3) indicating a decrease in receptor stability with respect to T3.46A. Second, we evaluated the level of GTPγS binding, finding a substantial increase in constitutive activity relative to the T3.46A receptor. These results show that the double mutants are significantly more active than T3.46A just as we predicted.
These results underscore the importance of the R2.37 residue in maintaining the inactive conformation [Fig. 4(C)], confirming that the TM2+TM6 coupling is critical for constraining the receptor to maintain the inactive conformation. These experimental results further support our hypothesis that breaking the TM2+TM6, not the TM3+TM6, coupling is crucial to convert the inactive structure to the active conformational.
Comparison to previous CB1 modeling studies
Previous CB1 modeling studies used homology modeling to bRho or other crystallized GPCRs as templates, followed in some cases by molecular dynamics.47–53 These studies are summarized in-depth in Supporting Information Section S5.2. Software programs such as Modeller54 have also been used previously to predict CB1′s structure. The ModBase dataset (http://modbase.compbio.ucsf.edu/modbase-cgi/index.cgi) contains multiple CB1 structure predictions constructed from Modeller software.55 One of its more reliable conformations, according to the MPQS score, is based on the agonist-bound actHA2AAR crystal (PDB ID: 2YDV chain A)37 homology model. In this predicted conformation R3.50 does not form an ionic lock with D6.30 even though both residues are conserved. As mentioned above, this particular interaction has been observed in multiple class A GPCRs. Furthermore, ligand-binding residues are not accessible to the binding site of these homology built structures.47, 49 For example W5.43A leads to a ∼1000-fold drop in binding affinity for the antagonist rimonabant,49 but the ModBase prediction, has this residue facing into the lipid membrane region. In our predicted structures, this residue points into the binding site. Thus, the homology-based structures do not account for the essential characteristics of the CB1 receptor.
Using the CB1 receptor as the model, we provide the first complete picture of the GPCR activation mechanism from the inactive form (T3.46A) through the weakly constitutively active form (WT) to a highly constitutively active form (T3.46I). Some molecular signatures of our mechanism have been observed in crystal structures of inactive and active forms, while others are novel and may be specific to the cannabinoid family. Based on our understanding of unique interaction observed between TMs 2 and 6 in the inactive T3.46A receptor, we designed double mutants expected to be constitutively active and subsequently confirmed this by GTPγS assays. This lays the groundwork for predicting inactive and active mutations for this and other GPCRs, which may be used to determine new ligands to have specific activity for activating particular G proteins, β arrestins, and perhaps other functionalities.
The ability of our first-principles-based ensemble methods to predict structures that explain experiments and to predict novel mutations with specific functionality subsequently validated by experiments, suggests that these methods may be very useful in understanding activation and specific ligand-GPCR interactions for other systems.
Our experimental and computational studies show that dramatic changes in the global receptor conformations can be caused by the mutation of a single residue. This invalidates the implicit assumption in using mutation-binding studies to validate a model ligand-protein structure, where it is assumed that the overall global structure of the receptor changes little. Our study shows cases in which this assumption is wildly invalid, requiring careful reinterpretation of all such GPCR binding-mutagenesis studies.
Materials and Methods
GTPγS binding assay
Membrane preparations from HEK293 cells expressing CB1 receptors were generated as described previously.56 Approximately 10 μg of membrane preparations were incubated for 60 min at 30°C in a total volume of 500 μL GTPγS binding assay buffer (50 mM Tris-HCl, pH 7.4, 3 mM MgCl2, 0.2 mM EGTA, and 100 mM NaCl) with 0.1 nM [35S]GTPγS (1250 Ci/mmol, PerkinElmer Life Sciences, Boston, MA), 1 μM GDP, and 0.1% (w/v) BSA. Non-specific binding was determined with 10 μM unlabeled GTPγS (Sigma, St. Louis, MO). The levels of GTPγS binding were measured in the absence of ligand to determine basal G protein-coupling activity. The reaction was terminated by rapid filtration to separate the membrane-bound fraction from the free through Whatman GF/C filters. The radioactivity of the membrane-bound [35S]GTPγS trapped in the filters was determined by liquid scintillation counting. Levels of [35S]GTPγS binding for the WT and mutant receptors were compared using analysis of variance (ANOVA) followed by Bonferroni's post hoc test for significance. P values of <0.05 were considered to be statistically significant.
Predicting receptor structures
For WT and each mutant, we predicted an ensemble of receptor structures from our first principles based GEnSeMBLE Monte Carlo method.40, 41 These procedures are described in more detail in the Supporting Information Section S7. All simulations used the Dreiding force field.57 The lowest 10 conformations in the ensembles of each mutant were analyzed in detail for the presence of salt-bridge and hydrogen bond as presented above in the “Results” Section.
The GEnSeMBLE method is based on first-principles rather than training sets of previously crystallized proteins. The procedure involves several steps: predicting the TM helix regions of the receptor, generating the template of the receptor bundle, sampling a complete set of seven-helix bundle conformations, and identifying the lowest energy receptor conformations.
We used the PredicTM method to predict TM regions based on an octanol hydrophobicity scale.58 These predicted regions were extended to include the entire section with α-helical character based on a consensus of secondary structure server predictions. We built these TM regions with the program OptHelix, which uses a series of molecular dynamics and minimization to optimize the shape of the seven individual helices.
These seven helices were then aligned to the template of a various GPCR structures. We generated several complete TM helix bundles using multiple crystal templates and evaluated the respective energies. The inactTβ1AR crystal template (PDB ID: 2VT4)17 resulted in the lowest energy helix packing conformations for the WT CB1 receptors and was used for the remainder of the procedure. With this initial structure, we performed a thorough helix angle sampling with our various programs.40, 41
The BiHelix program sampled helix rotation angle (η) for all pairs of interacting helices, used SCREAM (Side Chain Rotamer Excitation Analysis Method)59 to optimize side chain interactions for each sampled conformation, and minimized the side chains for 10 steps. BiHelix energies were combined and evaluated as described before40 and ordered by energy.
The program ComBiHelix built the top 1000 conformations from BiHelix, the previous step, and used SCREAM with 10-step minimization to optimize side chain interactions.
The program SuperBiHelix took the lowest energy conformation from ComBiHelix, the previous step, to sample helix tilt angle (θ), sweep angle (φ), and rotation angle (η) for all pairs of interacting helices and then used SCREAM with 10-step minimization to optimize side chain interactions. BiHelix energies were combined and evaluated as described before40 and ordered by energy.
The program SuperComBiHelix took the top 2000 conformations from SuperBiHelix, the previous step, and used SCREAM with 10-step minimization to optimize side chain interactions.
Lastly, the lowest energy structures from SuperComBiHelix were selected according to the average of the Average Energy Rank, the average of the charged total energy rank, neutralized total energy rank, charged interhelical energy rank, and neutralized interhelical energy rank.
The single and double mutant receptors—T3.46A, T3.46I, T3.46A/R2.37A, and T3.46A/R2.37Q—followed the same general guidelines with a few exceptions. The T3.46 residue in the optimized WT CB1 TM3 helix from OptHelix was mutated into Ala or Ile using SCREAM. For the double mutants, the R2.37 residue in the optimized WT CB1 TM2 helix from OptHelix was mutated into Ala or Gln using SCREAM. The remaining steps followed the same procedure as for the WT receptor.
Acknowledgments
The work in the laboratory of D.A.K. was supported by National Institutes of Health Grant DA020763. The work in the laboratory of W.A.G was initiated with gifts from PharmSelex/Accelerator and finished with funding from NIH grants (R01NS071112, R01NS073115, and R01AI040567) as well as from Sanofi.
Glossary
Abbreviations
- actHA2AAR
active human A2A adenosine receptor
- actHβ2AR
active human β2 adrenergic receptor
- actTβ1AR
active turkey (Meleagris gallopavo) β1 adrenergic receptor
- bOps
bovine opsin
- bRho
bovine rhodopsin
- CB1
human cannabinoid 1 receptor
- CB2
human cannabinoid 2 receptor
- EC2
extracellular loop 2
- GEnSeMBLE
GPCR Ensemble of Structures in Membrane Bilayer Environment
- GPCR
G-protein coupled receptor
- GTPγS
guanosine 5′-O-(3-thiotriphosophate)
- hCXCR4
human chemokine CXCR4 receptor
- HEK
human embryonic kidney
- hDD3R
human dopamine D3 receptor
- hH1HR
human H1 Histamine receptor
- hOPRK
human κ-opioid receptor
- hOPRX
human NOP opioid receptor
- hS1P1R
human sphingosine 1-phosphate 1 receptor
- IC2
intracellular loop 2
- IC3
intracellular loop 3
- inactHA2AAR
inactive human A2A adenosine receptor
- inactHβ2AR
inactive human β2 adrenergic receptor
- inactTβ1AR
inactive turkey β1 adrenergic receptor
- meta II
bovine metarhodopsin II
- mOPRD
mouse (Mus musculus) δ-opioid receptor
- mOPRM
mouse (Mus musculus) μ-opioid receptor
- PDB ID
protein data bank identification number
- SCREAM
Side Chain Rotamer Excitation Analysis Method
- sRho
squid (Todarodes pacificus) rhodopsin
- Tm
temperature midpoint of denaturation curve
- TM
transmembrane
Supplementary material
Additional Supporting Information may be found in the online version of this article.
References
- 1.Kenakin T, Miller LJ. Seven transmembrane receptors as shapeshifting proteins: The impact of allosteric modulation and functional selectivity on new drug discovery. Pharmacol Rev. 2010;62:265–304. doi: 10.1124/pr.108.000992. [DOI] [PMC free article] [PubMed] [Google Scholar]
- 2.Palczewski K, Kumasaka T, Hori T, Behnke CA, Motoshima H, Fox BA, Le Trong I, Teller DC, Okada T, Stenkamp RE, Yamamoto M, Miyano M. Crystal structure of rhodopsin: A G protein-coupled receptor. Science. 2000;289:739–745. doi: 10.1126/science.289.5480.739. [DOI] [PubMed] [Google Scholar]
- 3.Okada T, Le Trong I, Fox BA, Behnke CA, Stenkamp RE, Palczewski K. X-ray diffraction analysis of three-dimenrional crystals of bovine rhodopsoon obtained from mixed micelles. J Struct Biol. 2000;120:73–80. doi: 10.1006/jsbi.1999.4209. [DOI] [PubMed] [Google Scholar]
- 4.Teller DC, Okada T, Behnke CA, Palczewski K, Stenkamp RE. Advances in determination of a high-resolution three-dimensional structure of rhodopsin, a model of G-protein-coupled receptors (GPCRs) Biochemistry. 2001;40:7761–7772. doi: 10.1021/bi0155091. [DOI] [PMC free article] [PubMed] [Google Scholar]
- 5.Okada T, Fujiyoshi Y, Silow M, Navarro J, Landau EM, Shichida U. Functional role of internal water molecules in rhodopsin revealed by x-ray crystallography. Proc Natl Acad Sci USA. 2002;99:5982–5987. doi: 10.1073/pnas.082666399. [DOI] [PMC free article] [PubMed] [Google Scholar]
- 6.Okada T, Sugihara M, Bondar A-N, Elstner M, Entel P, Buss V. The retinal confirmation and its in environment in rhodopsin in light of a new 2.2 Å crystal structure. J Mol Biol. 2004;342:571–583. doi: 10.1016/j.jmb.2004.07.044. [DOI] [PubMed] [Google Scholar]
- 7.Li J, Edwards PC, Burghammer M, Villa C, Schertler GFX. Structure of bovine opsin in a trigonal crystal form. J Mol Biol. 2004;343:1409–1438. doi: 10.1016/j.jmb.2004.08.090. [DOI] [PubMed] [Google Scholar]
- 8.Salom D, Lodowski DT, Stenkamp RE, Le Trong I, Golczak M, Jastrzebska B, Harris T, Ballesteros JA, Palczewski K. Crystal structure of a photoactivated deprotonated intermediate of rhodopsin. Proc Natl Acad USA. 2006;103:16123–16128. doi: 10.1073/pnas.0608022103. [DOI] [PMC free article] [PubMed] [Google Scholar]
- 9.Nakamichi H, Buss V, Okada T. Photoisomerization mechanism of rhodopsin and 9-cis-rhodopsin revealed by X-ray crystallography. Biophys J. 2007;92:L106–L108. doi: 10.1529/biophysj.107.108225. [DOI] [PMC free article] [PubMed] [Google Scholar]
- 10.Standfuss JR, Xie G, Edwards PC, Burghammer M, Oprian DD, Schertler GFX. Crystal structure of a thermally stable rhodopsin mutant. J Mol Biol. 2007;372:1179–1188. doi: 10.1016/j.jmb.2007.03.007. [DOI] [PMC free article] [PubMed] [Google Scholar]
- 11.Stenkamp RE. Alternative models for two crystal structures of bovine rhodopsin. Acta Crystallogr Sect D. 2008;64:902–904. doi: 10.1107/S0907444908017162. [DOI] [PMC free article] [PubMed] [Google Scholar]
- 12.Murakami M, Kouyama T. Crystal structure of squid rhodopsin. Nature. 2008;453:363–367. doi: 10.1038/nature06925. [DOI] [PubMed] [Google Scholar]
- 13.Shimamura T, Hiraki K, Takahashi N, Hori T, Ago H, Masuda K, Takio K, Ishiguro M, Miyano Crystal structure of squid rhodopsin with intracellularly extended cytoplasmic region. J Biol Chem. 2008;283:17753–17756. doi: 10.1074/jbc.C800040200. [DOI] [PMC free article] [PubMed] [Google Scholar]
- 14.Rasmussen SGF, Choi H-J, Rosenbaum DM, Kobilka TS, Thian FS, Edwards PC, Burghammer, Ratnala VRP, Sanishvili R, Fischetti RF, Schertler GFX, Weis WI, Kobilka BK. Crystal structure of the human β2 adrenergic G-protein-coupled receptor. Nature. 2007;450:383–387. doi: 10.1038/nature06325. [DOI] [PubMed] [Google Scholar]
- 15.Cherezov V, Rosenbaum DM, Hanson MA, Rasmussem SGF, Thian FS, Kobilka TS, Choi H-J, Kuhn P, Weis WI, Kobilka BK, Stevens RC. High-resolution crystal structure of an engineered human β2-adrenergic G protein-coupled receptor. Science. 2007;318:1258–1265. doi: 10.1126/science.1150577. [DOI] [PMC free article] [PubMed] [Google Scholar]
- 16.Hanson MA, Cherezov V, Griffith MT, Roth CB, Jaakola VP, Chien YET, Velasquez J, Kuhn P, Stevens RC. A specific cholesterol binding site is established by the 2.8 Å structure of the human β2-adrenergic receptor. Structure. 2008;16:897–905. doi: 10.1016/j.str.2008.05.001. [DOI] [PMC free article] [PubMed] [Google Scholar]
- 17.Warne T, Serrano-Vega MJ, Baker JG, Moukhametzianov R, Edwards PC, Henderson R, Leslie AGW, Tate CG, Schertler GFX. Structure of a β1-adrenergic G-protein-coupled receptor. Nature. 2008;454:486–491. doi: 10.1038/nature07101. [DOI] [PMC free article] [PubMed] [Google Scholar]
- 18.Moukhametzianov R, Warne T, Edwards PC, Serrano-Vega MJ, Leslie AGW, Tate CG, Schertler GFX. Two distinct conformations of helix 6 observed in antagonist-bound structures of a β1-adrenergic receptor. Proc Natl Acad Sci USA. 2011;108:8228–8232. doi: 10.1073/pnas.1100185108. [DOI] [PMC free article] [PubMed] [Google Scholar]
- 19.Jaakola V-P, Griffith MT, Hanson MA, Cherezov V, Chien EYT, Lane JR, Ijzerman AP, Stevens RC. The 2.6 Å crystal structure of a human A2A adenosine receptor bound to an antagonist. Science. 2008;322:1211–1217. doi: 10.1126/science.1164772. [DOI] [PMC free article] [PubMed] [Google Scholar]
- 20.Doré AS, Robertson N, Errey JC, Ng I, Hollenstein K, Tehan B, Hurrell E, Bennett K, Congreve M, Magnani F, Tate CG, Weir M, Marshall FH. Structure of the adenosine A2A receptor in complex with ZM241385 and the xanthines XAC and caffeine. Structure. 2011;19:1283–1293. doi: 10.1016/j.str.2011.06.014. [DOI] [PMC free article] [PubMed] [Google Scholar]
- 21.Chien YET, Liu W, Zhao QA, Katrich V, Han GW, Hanson MA, Shi L, Newman AH, Javitch JA, Cherezov V, Stevens RC. Structure of the human dopamine D3 receptor in complex with a D2/D3 selective antagonist. Science. 2010;330:1091–1095. doi: 10.1126/science.1197410. [DOI] [PMC free article] [PubMed] [Google Scholar]
- 22.Wu B, Chien EYT, Mol CD, Fenalti G, Liu W, Katritch V, Abagyan R, Brooun A, Wells P, Bi FC, Hamel DJ, Kuhn P, Handel TM, Cherezov V, Stevens RC. Structures of the CXCR4 chemokine GPCR with small-molecule and cyclic peptide antagonists. Science. 2010;330:1066–1071. doi: 10.1126/science.1194396. [DOI] [PMC free article] [PubMed] [Google Scholar]
- 23.Shimamura T, Shiroishi M, Weyand S, Tsujimoto H, Winter G, Katritch V, Abagyan R, Cherezov V, Liu W, Han GW, Kobayashi T, Stevens RC, Iwata S. Structure of the human histamine H1 receptor complex with doxepin. Nature. 2011;475:65–70. doi: 10.1038/nature10236. [DOI] [PMC free article] [PubMed] [Google Scholar]
- 24.Hanson MA, Roth CB, Jo E, Griffith MT, Scott FL, Reinhart G, Desale H, Clemons B, Cahalan SM, Schuerer SC, Sana MG, Han GW, Kuhn P, Rosen H, Stevens RC. Crystal structure of a lipid G protein-coupled receptor. Science. 2012;335:851–855. doi: 10.1126/science.1215904. [DOI] [PMC free article] [PubMed] [Google Scholar]
- 25.Manglik A, Kruse AC, Kobilka TS, Thian FS, Mathiesen JM, Sunahara RK, Pardo L, Weis WI, Kobilka BK, Granier S. Crystal structure of the μ-opioid receptor bound to a morphinan antagonist. Nature. 2012;485:321–326. doi: 10.1038/nature10954. [DOI] [PMC free article] [PubMed] [Google Scholar]
- 26.Granier S, Manglik A, Kruse AC, Kobilka TS, Thian FS, Weis WI, Kobilka BK. Structure of the δ-opioid receptor bound to naltrindole. Nature. 2012;485:400–404. doi: 10.1038/nature11111. [DOI] [PMC free article] [PubMed] [Google Scholar]
- 27.Wu H, Wacker D, Mileni M, Katritch V, Han GW, Vardy E, Liu W, Thompson AA, Huang X-P, Carroll FI, Mascarella SW, Westkaemper RB, Mosier PD, Roth BL, Cherezov V, Stevens RC. Structure of the human κ-opioid receptor in complex with JDTic. Nature. 2012;485:327–332. doi: 10.1038/nature10939. [DOI] [PMC free article] [PubMed] [Google Scholar]
- 28.Thompson AA, Liu W, Chun E, Katritch V, Vardy E, Huang X-P, Trapella C, Guerrini R, Carlo G, Roth BL, Cherezov V, Stevens RC. Structure of the nociceptin/orphanin FQ receptor in complex with a peptide mimetic. Nature. 2012;485:395–399. doi: 10.1038/nature11085. [DOI] [PMC free article] [PubMed] [Google Scholar]
- 29.Park JH, Scheerer P, Hofmann KP, Choe H-W, Ernst OP. Crystal structure of the ligand-free G-protein-coupled receptor opsin. Nature. 2008;454:183–187. doi: 10.1038/nature07063. [DOI] [PubMed] [Google Scholar]
- 30.Scheerer P, Park JH, Hildebrand PW, Kim YJ, Krauss N, Choe HW, Hofmann KP, Ernst OP. Crystal structure of opsin in its G-protein-interacting conformation. Nature. 2008;455:497–502. doi: 10.1038/nature07330. [DOI] [PubMed] [Google Scholar]
- 31.Choe HW, Kim YJ, Park JH, Morizumi T, Pai EF, Krauss N, Hofmann KP, Scheerer P, Ernst OP. Crystal structure of metarhodopsin II. Nature. 2011;471:651–655. doi: 10.1038/nature09789. [DOI] [PubMed] [Google Scholar]
- 32.Standfuss J, Edwards PCC, D'Antona A, Fransen M, Xie G, Oprian DD, Schertler GFX. The structural basis of agonist-induced activation in constitutively active rhodopsin. Nature. 2011;471:656–660. doi: 10.1038/nature09795. [DOI] [PMC free article] [PubMed] [Google Scholar]
- 33.Rosenbaum DM, Zhang C, Lyons JA, Holl R, Aragao D, Arlow DH, Rasmussen SGF, Choi H-J, DeVree BT, Sunahara RK, Chae PS, Gellman SH, Dror RO, Shaw DE, Weis WI, Caffrey M, Gmeiner P, Kobilka BK. Structure and function of an irreversible agonist-β2 adrenoceptor complex. Nature. 2011;469:236–240. doi: 10.1038/nature09665. [DOI] [PMC free article] [PubMed] [Google Scholar]
- 34.Rasmussen SGF, Choi H-J, Fung JJ, Pardon E, Casarosa P, Chae PS, DeVree BT, Rosenbaum DM, Thian FS, Kobilka TS, Schnapp A, Konetzki I, Sunahara RK, Gellman SH, Pautsch A, Steyaert J, Weis WI, Kobilka BK. Structure of a nanobody-stabilized active state of the β2 adrenoceptor. Nature. 2011;469:175–180. doi: 10.1038/nature09648. [DOI] [PMC free article] [PubMed] [Google Scholar]
- 35.Rasmussen SGF, DeVree BT, Zou Y, Kruse AC, Chung KY, Kobilka TS, Thian FS, Chae PS, Pardon E, Calinski D, Mathiesen JM, Shah STA, Lyons JA, Caffrey M, Gellman SH, Steyaert J, Skiniotis G, Weis WI, Sunahara RK, Kobilka BK. Crystal structure of the β2 adrenergic receptor-Gs protein complex. Nature. 2011;477:549–555. doi: 10.1038/nature10361. [DOI] [PMC free article] [PubMed] [Google Scholar]
- 36.Xu F, Wu HX, Katritch V, Han GW, Jacobson KA, Gao ZG, Cherezov V, Stevens RC. Structure of an agonist-bound human A2A adenosine receptor. Science. 2011;332:322–327. doi: 10.1126/science.1202793. [DOI] [PMC free article] [PubMed] [Google Scholar]
- 37.Lebon G, Warne T, Edwards PC, Bennett K, Langmead CJ, Leslie AGW, Tate CG. Agonist-bound adenosine A2A receptor structures reveal common features of GPCR activation. Nature. 2011;474:521–525. doi: 10.1038/nature10136. [DOI] [PMC free article] [PubMed] [Google Scholar]
- 38.D'Antona A, Ahn KH, Kendall DA. Mutations of CB1 T210 produce active and inactive receptor forms: correlations with ligand affinity, receptor stability, and cellular localization. Biochemistry. 2006;45:5606–5617. doi: 10.1021/bi060067k. [DOI] [PMC free article] [PubMed] [Google Scholar]
- 39.Ballesteros JA, Weinstein H. Integrated methods for the construction of three-dimensional models and computational probing of structure-function relations in G protein-coupled receptors. In: Sealfon SC, editor. Receptor molecular biology. Vol. 25. Waltham, Massachusetts: Academic Press; 1995. pp. 366–428. [Google Scholar]
- 40.Abrol R, Bray JK, Goddard WA., III BiHelix: towards de novo structure prediction of an ensemble of G-protein coupled receptor conformations. Proteins Struct Funct Bioinf. 2012;80:505–518. doi: 10.1002/prot.23216. [DOI] [PMC free article] [PubMed] [Google Scholar]
- 41.Abrol R, Griffith AR, Bray JK, Goddard WA. Structure prediction of G protein-coupled receptors and their ensemble of functionally important conformations. In: Vaidehi N, Klein-Seetharaman J, editors. Vol. 914. New York, NY: Humana Press; 2012. pp. 237–254. Membrane protein structure: methods and protocols. [DOI] [PubMed] [Google Scholar]
- 42.Ballesteros JA, Jensen AD, Liapakis G, Rasmussen SGF, Shi L, Gether U, Javitch JA. Activation of the β2-adrenergic receptor involves disruption of an ionic lock between the cytoplasmic ends of transmembrane segments 3 and 6. J Biol Chem. 2001;276:29171–29177. doi: 10.1074/jbc.M103747200. [DOI] [PubMed] [Google Scholar]
- 43.Yao XJ, Parnot C, Deupi X, Ratnala VRP, Swaminath G, Farrens D, Kobilka B. Coupling ligand structure to specific conformational switches in the β2-adrenoceptor. Nat Chem Biol. 2006;2:417–422. doi: 10.1038/nchembio801. [DOI] [PubMed] [Google Scholar]
- 44.Crocker E, Eilers M, Ahuja S, Hornak V, Hirshfeld A, Sheves M, Smith SO. Location of Trp265 in metarhodopsin II: implications for the activation mechanism of the visual receptor rhodopsin. J Mol Biol. 2006;357:163–172. doi: 10.1016/j.jmb.2005.12.046. [DOI] [PubMed] [Google Scholar]
- 45.Rhee MH, Nevo I, Levy R, Vogel Z. Role of the highly conserved Asp-Arg-Tyr motif in signal transduction of the CB2 cannabinoid receptor. FEBS Lett. 2000;466:300–304. doi: 10.1016/s0014-5793(00)01094-2. [DOI] [PubMed] [Google Scholar]
- 46.Feng WK, Song ZH. Effects of D3.49A, R3.50A, and A6.34E mutations on ligand binding and activation of the cannabinoid-2 (CB2) receptor. Biochem Pharmacol. 2003;65:1077–1085. doi: 10.1016/s0006-2952(03)00005-4. [DOI] [PubMed] [Google Scholar]
- 47.Hurst DP, Lynch DL, Barnett-Norris J, Hyatt SM, Seltzman HH, Zhong M, Song ZH, Nie JJ, Lewis D, Reggio PH. N-(Piperidin-1-yl)-5-(4-chlorophenyl)-1-(2,4-dichlorophenyl)-4-methyl-1H -pyrazole-3-carboxamide (SR141716A) interaction with LYS 3.28(192) is crucial for its inverse agonism at the cannabinoid CB1 receptor. Mol Pharmacol. 2002;62:1274–1287. doi: 10.1124/mol.62.6.1274. [DOI] [PubMed] [Google Scholar]
- 48.Singh R, Hurst DP, Barnett-Norris J, Lynch DL, Reggio PH, Guarnieri F. Activation of the cannabinoid CB1 receptor may involve a W6.48/F3.36 rotamer toggle switch. J Pept Res. 2002;60:357–370. doi: 10.1034/j.1399-3011.2002.21065.x. [DOI] [PubMed] [Google Scholar]
- 49.McAllister SD, Rizvi G, Anavi-Goffer S, Hurst DP, Barnett-Norris J, Lynch DL, Reggio PH, Abood ME. An aromatic microdomain at the cannabinoid CB1 receptor constitutes an agonist/inverse agonist binding region. J Med Chem. 2003;46:5139–5152. doi: 10.1021/jm0302647. [DOI] [PubMed] [Google Scholar]
- 50.Hurst D, Umejiego U, Lynch D, Seltzman H, Hyatt S, Roche M, McAllister S, Fleischer D, Kapur A, Abood M, Shi S, Jones J, Lewis D, Reggio P. Biarylpyrazole inverse agonists at the cannabinoid CB1 receptor: Importance of the C-3 carboxamide oxygen/lysine3.28(192) interaction. J Med Chem. 2006;49:5969–5987. doi: 10.1021/jm060446b. [DOI] [PubMed] [Google Scholar]
- 51.D'Antona A, Ahn KH, Wang L, Mierke DF, Lucas-Lenard J, Kendall DA. A cannabinoid receptor 1 mutation proximal to the DRY motif results in constitutive activity and reveals intramolecular interactions involved in receptor activation. Brain Res. 2006;1108:1–11. doi: 10.1016/j.brainres.2006.05.042. [DOI] [PMC free article] [PubMed] [Google Scholar]
- 52.Shim J-Y. Transmembrane helical domain of the cannabinoid CB1 receptor. Biophys J. 2009;96:3251–3262. doi: 10.1016/j.bpj.2008.12.3934. [DOI] [PMC free article] [PubMed] [Google Scholar]
- 53.Shim J-Y. Understanding functional residues of the cannabinoid CB1 receptor for drug discovery. Curr Top Med Chem. 2010;10:779–798. doi: 10.2174/156802610791164210. [DOI] [PMC free article] [PubMed] [Google Scholar]
- 54.Fiser A, Sali A. Modeller: generation and refinement of homology-based protein structure models. Methods Enzymol. 2003;374:461–491. doi: 10.1016/S0076-6879(03)74020-8. [DOI] [PubMed] [Google Scholar]
- 55.Pieper U, Webb BM, Barkan DT, Schneidman-Duhovny D, Schlessinger A, Braberg H, Yang Z, Meng EC, Pettersen EF, Huang CC, Datta RS, Sampathkumar P, Madhusudhan MS, Sjolander K, Ferrin TE, Burley SK, Sali A. MODBASE, a database of annotated comparative protein structure models and associated resources. Nucleic Acids Res. 2011;39:D465–D474. doi: 10.1093/nar/gkq1091. [DOI] [PMC free article] [PubMed] [Google Scholar]
- 56.Ahn KH, Bertalovitz AC, Mierke DF, Kendall DA. Dual role of the second extracellular loop of the cannabinoid receptor 1: ligand binding and receptor localization. Mol Pharmacol. 2009;76:833–842. doi: 10.1124/mol.109.057356. [DOI] [PMC free article] [PubMed] [Google Scholar]
- 57.Mayo SL, Olafson BD, Goddard WA. DREIDING: a generic force field for molecular simulations. J Phys Chem. 1990;94:8897–8909. [Google Scholar]
- 58.Wimley WC, Creamer TP, White SH. Solvation energies of amino acid side chains and backbone in a family of host−guest pentapeptides. Biochemistry. 1996;35:5109–5124. doi: 10.1021/bi9600153. [DOI] [PubMed] [Google Scholar]
- 59.Kam VWT, Goddard WA. Flat-bottom strategy for improved accuracy in protein side-chain placements. J Chem Theory Comput. 2008;4:2160–2169. doi: 10.1021/ct800196k. [DOI] [PMC free article] [PubMed] [Google Scholar]
Associated Data
This section collects any data citations, data availability statements, or supplementary materials included in this article.