

Abstract
Metabolomics is recognized as a powerful top‐down system biological approach to understand genetic‐environment‐health paradigms paving new avenues to identify clinically relevant biomarkers. It is nowadays commonly used in clinical applications shedding new light on physiological regulatory processes of complex mammalian systems with regard to disease aetiology, diagnostic stratification and, potentially, mechanism of action of therapeutic solutions. A key feature of metabolomics lies in its ability to underpin the complex metabolic interactions of the host with its commensal microbial partners providing a new way to define individual and population phenotypes. This review aims at describing recent applications of metabolomics in clinical fields with insight into diseases, diagnostics/monitoring and improvement of homeostatic metabolic regulation.
Keywords: biomarkers, clinical metabolomics, gut microflora
The metabolome and state of the art technologies for metabolomic analysis
The metabolome refers to the complete set of small molecule metabolites (such as metabolic intermediates, hormones and other signalling molecules and secondary metabolites) to be found within a biological sample. While the first draft of the human metabolome has been completed, cataloging approximately 2500 metabolites, 1200 drugs and 3500 food components found in the human body [1], it is difficult today to estimate fully the exact number of metabolites in our metabolome considering, for example, the vastly unknown metabolites arising from mammalian gut microfora metabolic cross‐talks.
Metabolomics is mainly based on the quantitative measurement of dynamic metabolic changes of living systems in response to genetic modifications or physiological stimuli, including nutrients and drugs [2]. By the global study of low molecular weight metabolites (<1500 Da) in biofluids (plasma/serum and urine) [3,4] and tissues [5], metabolomics assures the characterization of an individual metabolic phenotype. Metabolomics employs mainly two analytical techniques based on proton nuclear magnetic resonance (1H NMR) spectroscopy and mass spectrometry coupled to either gas (GC‐MS) or liquid chromatography (LC‐MS). Metabolomics is a high throughput strategy where hundreds of samples can be analyzed per day or week, depending on the analytical instrument. Although instruments are expensive, costs per sample are relatively low and so large scale population experiments are achievable. NMR spectroscopy offers the unique prospect to profile holistically hundreds of metabolites with no a priori selection. Because NMR is based on the fact that nuclei such as 1H, 13C and 31P can exist at different energy levels in a strong magnetic field because they possess nuclear spin, it can generate valuable structural information. Interestingly, this technique is not only used for the profiling of biological fluids (liquid state NMR), but it is also today commonly employed for the study of metabolic profiling of intact tissue biopsies, using high resolution magic angle spinning NMR (HR‐MAS) [6]. MS methods are also commonly employed for global and targeted profiling and are inherently more sensitive, but require a more comprehensive sample preparation [7,8] with separation of the metabolite components using either GC or LC. Moreover, in order to elucidate better molecular mechanisms that involve the disruption of lipid metabolic pathways, the field of lipidomics has also rapidly emerged. Lipidomics can be achieved by either a comprehensive measurement of the lipidome, i.e. the complete set of biological lipids, from a single analysis in a non‐targeted profiling way (shotgun approach) [9], or alternatively, lipids can be separated before selective detection using LC‐MS methods [10]. Lipidomics and metabolomics are then comprehensively used to generate multivariate datasets, from which meaningful biological information is recovered using advanced statistical tools [11–13].
Metabolomics opens new windows into the complex metabolic networks of mammalian organisms
Because specific physiological states, gene expression and environmental stressors can cause changes in the steady‐state of a biological system, monitoring the resulting metabolic variations provides unique insights into intra‐ and extra‐cellular regulatory processes involved in metabolic homeostasis. The obtained metabolic profiles also encapsulate information on the metabolic activity of the gut microbiota that co‐evolved with complex organisms, and which represents a major determinant in nutrition and health. One of the first studies that applied metabolomic approaches in human nutritional experiments was directed to monitor the effects of supplementing the diet with soy isoflavones [14]. Clear differences in the plasma lipoprotein, amino acid and carbohydrate profiles were observed following dietary soy intervention, indicating an alteration in energy metabolism. More recently, nutrimetabolomic studies have shown that specific dietary‐associated metabolic phenotypes, or metabotypes, in both human basal metabolism and gut microbiota activity, are closely related to specific individual dietary preferences [15–17]. Metabolic profiling of urine revealed in particular that ‘chocolate likers’, i.e. stated for people consuming chocolate on a regular basis, have a specific energy metabolism and harboured distinct gut microbiota metabolic activities, thus anticipating possible long term health consequences. Most recently, to reveal the effects of diet on health, proline betaine was discerned as a putative biomarker of citrus consumption in free living individuals [18]. Such biomarkers were cross validated across a large scale epidemiology study. Clearly investigation of the food metabolome in biofluids has great potential to display the dietary intake of individuals, possibly reducing the current subjective dietary records. Yet, food‐induced metabolic reactions are not only the end results of complex interactions among many bioactives, but also vary greatly among individuals as differences in endogenous factors such as diet, stress, age, environment, genetics, lifestyle and gut microbiota strongly pre‐determine individual metabolic responses. In particular, recent advances in cellular and molecular biology have provided compelling evidence that the intestinal microbiota contribution to the overall health status of the host has been underestimated so far. Both system wide (i.e. whole organism) and organ‐specific changes in metabolic profiles may have components driven by gut microbial activities [19]. The current metabolomic revolution offers an unprecedented opportunity to identify the molecular foundations of these relationships so that we can understand how commensal partners contribute to our normal physiology and how they can be exploited to develop new therapeutic and nutritional strategies. Recent applications of top‐down system biology approaches revealed the depth and width of the long range effects of the gut microbiota in complex organisms, resulting in modulation of host lipid, carbohydrate and amino acid metabolism at a panorganismal scale [19–21]. Wikoff et al. provided additional evidence that the specific metabolic activities of gut bacterial species can provide the host with new biochemical compounds in sufficient amounts to be detected in the systemic blood stream [22]. Martin et al. exemplified how the gut microbial modulation of the gastrointestinal system [23] and extensive microbial‐mammalian co‐metabolism may impact on host main metabolic processes and may induce metabolic deregulations [24]. In this case, gut bacteria can exert modulation over the host metabolism via reprocessing of signalling molecules such as bile acids. As such, bile acids may be an example of a transgenomic mechanism of quorum sensing [25], whereby microbial cells communicate with each other and disperse their metabolic functions thus behaving like a multi‐cellular organism [24]. Together, these studies suggest that controlling the dynamics of the gut microbiome to maintain or re‐establish a balanced and well‐adapted microbiota could help in preventing some microbial‐associated metabolic disorders, such as insulin resistance and hepato‐gastrointestinal diseases.
Clinical applications of metabolomics
Gastrointestinal disease
The intestinal tract is one of the most important organism‐environment interfaces along which gut microbial species and their relative metabolic processes differ from the stomach to the colon and subsequently shape regio‐specifically the surrounding and distant host cell metabolic pathways [26]. Metabolomics provides novel insights to understand and explore the regulation of the digestion and absorption of dietary products in the gastrointestinal tract [11,23]. For example, it is possible to identify different topographical regions of the intestine, characteristic for their structure and function, through specific metabolic profiles [23]. Similar regio‐specific metabolic variations were described in different mammalian models, in relation to compartment structure and function, including energy metabolism, osmoregulation, gut microbial activity and protection against oxidative stress. There is increasing awareness that the influence of the gut microorganisms might be more important in the progression of human diseases than was previously suspected [27]. It is indeed of main concern in the aetiology and/or maintenance of gut dysfunctions, such as irritable bowel syndrome (IBS) [28] or inflammatory bowel diseases (IBD) [29]. The clinically defined and idiopathic forms of IBD, encompassing ulcerative colitis (UC) and Crohn's disease (CD), are spontaneously relapsing and immunologically‐mediated chronic disorders of the gastrointestinal tract [29,30]. Both manifestations are mediated by common and distinct mechanisms influenced by multiple genetic susceptibilities and environmental factors. There is increasing awareness in gastrointestinal science of the prognostic, diagnostic and monitoring potential of metabolomics, as well as the opportunity to provide new insights into IBD pathogenesis [31].
Winterkamp et al. reported previously how N‐methylhistamine, a key metabolite in mast cell metabolism involved in IBD pathogenesis, could be used as an indicator of disease activity in patients [32]. The authors reported how urinary excretion of this metabolite was enhanced in IBD, and could be used to diagnose UC and CD while providing a way to monitor pathological progression. Metabolomics was also proven to be a valuable diagnostic tool to differentiate active and quiescent UC, as per the analysis of intact gut biopsies and colonocytes [33]. Recently, Le Gall et al. described through metabolomics analysis of faecal extracts combined with microbial profiling the alteration of both population and metabolic activity of the gut microbiota in UC and IBS [34]. The authors followed up a population of healthy controls, IBS and UC patients over a 4 year period. NMR‐based metabolomics provided good classification of UC against controls, but could not robustly discriminate IBS pathology. Whereas the faecal excretion of amino and short chain fatty acids (SCFAs) remained stable across the groups, strong differences were detected in the content of taurine, cadaverine, bile acids and branched chain fatty acids. The difference in the metabolic profiles observed in faecal waters of UC and healthy controls was correlated with compositional differences of the gut microbiota, and demonstrated relationships between the disease state and the processing of dietary lipids. This approach was also successfully employed to provide insight into the molecular processes associated to the development of UC, using blood plasma [35] or urine [36] analysis, the latter revealing a possible contribution of gut microbiota via methylamine metabolism. In addition, Williams et al. demonstrated how urinary metabolic profiling could be employed to distinguish CD from UC, which is critical for disease management [37]. Intriguingly, it is the concentrations of gut microbial co‐metabolites that were among the strongest discriminant metabolites, namely hippurate, 4‐cresol sulphate and formate. In CD, UC and controls, there is a gradual decrease in the concentration of aromatic metabolites, whilst formate gradually increased. The monitoring of the faecal metabolome may also unravel diagnostic information for IBD [38]. The faecal extracts of patients with both CD and UC were discriminated by reduced concentrations of SCFAs and methylamines, increased concentrations of most amino acids, reflecting intestinal malabsorption, protein enteropathy loss, and different gut microbial metabolic activities. Interestingly, this study could differentiate samples from CD and UC subjects, with metabolic changes being more marked in the CD group, as noted by high concentrations of glycerol. Janson et al. also illustrated the potential of ion cyclotron resonance fourier transform mass spectrometry (ICR‐FT/MS) to determine the contribution of metabolites produced by the gut microbiota in disease status via faecal monitoring [39]. Biochemical pathways involved in the metabolism and/or synthesis of amino acids, fatty acids, bile acids and arachidonic acid were also highlighted in patients with colonic and ileal CD. Hong et al. reported the use of faecal metabolomics to assess the effects of lactic acid probiotic in a mouse model of acute colitis induced with dextran sulfate sodium (DSS). DSS treatment was associated with a significant decrease of several amino acids, as well as butyrate, uracil and hypoxanthine. These changes were correlated with increases of monosaccharides, glucose and trimethylamine in the faeces. Histological damage, myeloperoxidase activity and malondialdehyde content of colon tissue were reduced, whereas colon length increased in mice supplemented with the probiotics. The probiotic preventive treatment resulted in increased concentrations of acetate, butyrate and glutamine and decreased concentrations of trimethylamine concomitant with the protective effects against DSS‐induced colitis, which suggests the modulation of the gut microbiota is of importance.
However, most of the studies describe metabolic phenotypes at an advanced disease state when symptoms can already be diagnosed by endoscopy. Recently, Martin et al. monitored metabolic alterations in plasma of IL10−/− mice before and during the development of the disease, which might help to define early IBD biomarkers [35].The majority of studies have focused on UC in different animal models by exploring plasma [40], urine [40–42] and biopsies [43,44]. Recently, Baur et al. monitored the gradual development of CD‐like ileitis on the local metabolism taking advantage of the TNFΔARE/WT mouse model [45]. The authors employed non‐targeted 1H NMR spectroscopy and targeted LC‐MS based metabolic profiling techniques in combination with a histological and phenotypic analysis to characterize site specific and systemic metabolic signatures during the development of CD‐like ileitis. These results describe different biological processes associated with the disease onset, including modifications of the general cell membrane composition (phospholipids), alteration of energy homeostasis (faecal energy loss, liver lipids, amino acids and carbohydrates) and finally the generation of inflammatory lipid mediators (eicosanoids and cytokines in the ileum).
Moreover, another major functional digestive disorder affecting around 20% of the industrialized adult population is IBS [46]. IBS generally involves abdominal pain and bowel habit disturbance, with changes in stool frequency and consistency. The aetiology, although multi‐factorial in origin, remains largely undefined. Factors implicated in the onset and development of IBS include perturbation of the gut microbiota precipitated by infection, diet and genetic predisposition [47,48]. Nevertheless, it is not clear whether the altered microbiota is a cause or a consequence of the gut dysfunction. Martin et al. employed NMR‐based metabolomics of plasma, jejunal wall and myenteric plexus‐longitudinal muscle tissues collected from a post‐infective IBS model to assess molecular changes in relation to the disease and nutritional interventions [49]. Post‐infective IBS was associated with a modification of energy homeostatic loss due to intestinal muscular hyper‐contractility, as noted with changes in metabolic intermediates, lipid and amino acid metabolism. In addition, the jejunal wall tissues showed alterations of the concentrations of gut microbiota‐related (acetate, choline and ethanol) metabolites in IBS. Metabolomics confirmed the role of L. paracasei probiotic supplementation in normalizing the muscular activity and the disturbed energy metabolism as evidenced by decreased glycogenesis and elevated lipid breakdown. The development of mucosal inflammation and immune activation in IBS is reckoned as multifactorial, and seemingly implicates complex interactions of genetic, biological, sociocultural and environmental determinants. Among them, the role of psychosocial stress is a key factor in the pathophysiology of IBS. A global view of the metabolic events associated with background stress and its potential influence on the response to novel incoming stress was recently captured in healthy subjects [50]. Stress leads to significant perturbations in gut permeability and energy metabolism. Baseline stress was shown to be reflected in the metabolic profile and cold‐stress application increased lumen‐to‐blood passage of small molecules in the gut, indicating energy homeostasis disruption. Moreover, concentrations of ketone bodies, Krebs's cycle intermediates, glucose and glucogenic amino acids were consistently modulated before and after cold stress applications.
Finally, Bertini et al. also demonstrated that combinatorial metabolomic analysis of blood sera and urine could help further the understanding of coeliac disease [51]. The authors highlighted major urinary changes in gut microbial co‐metabolites that may be associated with aberrant microbiota previously characterized in the small bowel of subjects suffering from coeliac disease [52].
Metabolic syndrome and related cardiometabolic disorders
The continuously increasing prevalence of obesity in many countries around the world is strongly linked to the projected pandemic of type 2 diabetes (T2D) and its cardiovascular complications [53,54]. However, there are many individuals under the same obesogenic and diabetogenic environments who remain metabolically healthy. Recently, Newgard et al. have studied metabolic, endocrine, inflammatory and physiologic differences between obese and lean subjects, and reported a branched‐chain amino acid (BCAA) related metabolic signature contributing to insulin resistance [55]. Suhre et al. recently reported the outcomes from a multiplatform metabolomic analysis of an epidemiological study on diabetes in which diabetes‐related complications could be detected already under sub‐clinical conditions in a general German population [56]. In addition to previously reported T2D biomarkers, including sugar metabolites, ketone bodies and BCAA, metabolites resulting from perturbations of metabolic pathways linked to kidney dysfunction (3‐indoxyl sulfate), lipid metabolism (glycerophospholipids, free fatty acids) and bile acid metabolism were reported. Additional metabolomic investigations suggested that the catabolism of BCAAs was tightly intertwined with the levels of insulin resistance, whilst greater concentrations of BCAAs were detected in the obese and insulin resistance phenotype [57,58]. Several by‐products of BCAA catabolism, such as glutamate, α‐ketoglutarate, propionylcarnitine, α‐methylbutyryl and isovalerylcarnitines showed a very strong contribution to the metabolic signature for obesity and insulin resistance phenotype. The authors further tested their hypothesis by supplementing BCAAs in a diet induced obesity rat model. However, whilst having reduced food intake and weight gain, no improvement of the insulin resistance levels was detected. Very recently, blood plasma profiling was successfully employed to provide predictive markers for the development of diabetes in prospective human studies [59,60]. In a first report, five branched‐chain, aromatic amino acids were strongly associated with insulin resistance, namely isoleucine, leucine, valine, tyrosine and phenylalanine. The authors demonstrated that a combination of three amino acids (isoleucine, phenylalanine, tyrosine) could predict future diabetes (>5‐fold higher risk for individuals in top quartile) [60]. Together these key findings demonstrate a critical role of BCAA metabolism in the early onset of insulin resistance and T2D development. In a second report, the authors evaluated the specific inter‐relationships between dyslipidaemia and the development of insulin resistance [59]. Interestingly, this work reported how lipids of lower carbon number and double bond content were associated with an increased risk of T2D, unlike higher carbon number and double bond content lipids [59]. In particular, a combination of two triacylglycerols further improved diabetes prediction and could aid in clinical risk assessment. Several studies also investigated the interactions between lifestyle, diet and metabolic disorders associated with insulin resistance. In particular, Huffman et al. explored the impact of exercise training on insulin sensitivity in combination with monitoring of circulating concentrations of metabolic intermediates, hormones and inflammatory mediators. Improvement in insulin sensitivity was associated with reduced levels of fatty acid oxidation by‐products and increased concentrations in glycine and proline [61]. Moreover, metabolomics was also employed to decipher indicators of early onset of pre‐diabetes status. Zhao et al. investigated the blood plasma composition in normal and impaired glucose tolerance populations, and demonstrated that pre‐diabetes was associated with alterations in fatty acid, tryptophan, uric acid, bile acid and gut microbial metabolism. In parallel, a great amount of knowledge was also consolidated in the field of type 1 diabetes (T1D), with patients also showing a variety of metabolic abnormalities including hyperglycaemia, ketogenesis and muscle proteolysis [62]. Lanza et al. analyzed plasma from T1D humans during insulin treatment and acute insulin deprivation [62] and provided additional evidence on the disease aetiology including protein synthesis and breakdown, gluconeogenesis, ketogenesis, amino acid oxidation, mitochondrial bioenergetics and oxidative stress. There is increasing evidence that the specific metabolic disturbances preceding β‐cell autoimmunity in humans are of relevance for preventive medicine and potential prognosis of children who subsequently progress to type 1 diabetes [63–65]. In a series of studies, the specificity of the pre‐autoimmune metabolic changes was tested both in non‐obese pre‐diabetic mouse models and in prospective human cohorts [63–65]. Of particular interest is the observation that autoimmune diabetes is preceded by a state of increased metabolic demands from the islets resulting in elevated insulin secretion and suggest alternative metabolic related pathways as therapeutic targets to prevent diabetes.
Non‐alcoholic fatty liver disease (NAFLD) is increasingly considered as a main pathological determinant in various metabolic deregulations such as obesity, insulin resistance, hypertension, dyslipidaemia and cardiovascular disease (CVD) [66,67]. NAFLD is characterized by fatty acid infiltration in the liver in the absence of alcohol abuse [68]. NAFLD ranges from simple steatosis to non‐alcoholic steatohepatitis (NASH), the latest being marked by increased inflammation status [69,70]. In the absence of validated biomarkers of NAFLD as an alternative to liver biopsy, metabolomics and lipidomics are foreseen promising to deliver both a new set of minimally invasive clinical classifiers, i.e. biomarkers, and metabolic mechanistic insights into the disease aetiology and progression. Recently, Vinaixa et al. reported the use of metabolomics for quantitative profiling of liver extracts from LDLr−/− mice [71]. NMR‐based metabolomics was used to investigate the metabolic effects and implications of dietary cholesterol in the aetiology of progression from hepatic steatosis to NASH. Dietary cholesterol increased the hepatic concentrations of cholesterol, triglycerides and oleic acid but also decreased the polyunsaturated fatty acids (PUFAs) : monounsaturated fatty acids ratio as well as the relative amount of long chain PUFAs in the liver. Changes in hepatic concentrations of taurine, glutathione, methionine and carnitine were also observed. Likewise, Li et al. used a methionine and choline deficient diet to describe metabolic changes associated with different stages of NAFLD in male C57BL/6 mice [72]. Four potential biomarkers including serum glucose, lactate, glutamate/glutamine and taurine were selected and used to stratify NAFLD severity. In addition, using a parallel NAFLD animal model/human design, Barr et al. analyzed 42 serum samples collected from non‐diabetic, morbidly obese, biopsy‐proven NAFLD patients and 17 animals belonging to the glycine N‐methyltransferase knockout (GNMT‐KO) NAFLD mouse model [73]. MS‐based metabolomics revealed similarities between the GNMT‐KO and human NAFLD patients with relevant biochemical perturbations linked to liver dysfunction through reduced concentrations of creatine and increased concentrations of bile acids as well as eicosanoids. Metabolomics was also employed by Kalhan et al. [74] to provide potential metabolic steatosis markers in biopsy confirmed NASH subjects. While steatosis and NASH could not be distinguished, NASH metabolic signature was marked by altered concentrations of bile acids, glutathione, lipids and amino acids. More recently, Feldstein et al. used a targeted isotope dilution MS targeted technique to quantify 9‐ and 13‐HODEs and 9‐ and 13‐oxoODEs as circulating biomarkers of NASH [75].
It is very likely that nutritional interventions will be increasingly developed to address metabolic misbalances in organs like liver. A non‐targeted metabolomics approach was directed to discriminate changes in the urinary profile of subjects with metabolic syndrome following consumption of mixed nuts (30 g day−1) for 12 weeks compared with gender and age‐matched individuals given a control diet [76]. The tested diet displayed improvement of insulin resistance and trends towards improvement of inflammatory status associated with metabolic syndrome. Recently, Holmes et al. used metabolomics in the context of a large scale epidemiological study to identify metabolic signatures across and within selected human populations in relation to geography, diet‐related major risk factors and coronary heart disease/stroke rates [77]. Here the authors have shown that urinary metabolite excretion patterns differ between East Asian and Western populations, Japanese individuals living in Japan or in the USA and Chinese participants living in the northern and southern parts of China. Interestingly, urinary excretion of formate was shown to be inversely correlated with blood pressure. NMR‐based serum metabolomic studies had also shown in diabetic patients particular metabolic features associated with vascular complications and premature death [78]. Indeed metabolomics has been applied to a number of cardiovascular conditions providing benefits over conventional diagnostic approaches. For example, GC‐MS metabolomic analysis of serum derived from 52 patients with chronic heart failure and 57 controls, provided pseudouridine and 2‐oxoglutarate as valid diagnostics [79] of heart failure compared with the current gold standard biomarker, brain natriuretic peptide, with areas under the receiving operator characteristic curve of 0.96 (pseudouridine), 0.93 (2‐oxoglutarate) and 0.93 (brain natriuretic paptide).
Clinical applications for cancer diagnosis
Metabolomics is nowadays foreseen as a promising high throughput, automated approach in addition to functional genomics and proteomics for analyses of molecular changes in malignant tumours [80–83]. the metabolite profiling approach was, for instance, successfully employed to characterize molecular changes in ovarian tumour tissues [83]. Sixty‐six invasive ovarian carcinomas and nine borderline tumours of the ovary were analyzed by GC‐MS. A total of 51 metabolites, which encompassed glycerolipid, pyrimidine, purine, amino acid, propanoate and free fatty acid metabolism, were significantly different between borderline tumours and carcinomas, [83]. In addition, the potential of applying metabolomics to explore metabolic pathway modulation specific to organ‐confined disease or metastatic disease may lead to the identification of new early disease biomarkers. MS‐based metabolomic analysis of patients with prostate cancer based on tissue biopsies, urine and plasma samples was able to distinguish benign prostate, clinically localized prostate cancer and metastatic disease [80]. Sarcosine, an N‐methyl derivative of the amino acid glycine, was identified as a differential metabolite that was highly increased during prostate cancer progression to metastasis and can be detected non‐invasively in urine. Pasikant et al. displayed the potential and validity in the staging, grading and diagnostic capabilities of urinary metabolomics in bladder cancer tumours [84]. Here, 100% sensitivity in detecting bladder cancer was observed using urinary metabolomics vs. 33% sensitivity achieved by urinary cytology, the current standard for tumour detection and monitoring of recurrence or progression of bladder cancer. Using plasma free amino acid profiling, Miyag et al. described metabolomic applications the diagnosis of lung, gastric, colorectal, breast, and prostate cancer [85]. Cancer patients and controls could be discriminated using multivariate analysis where significant alterations in plasma free amino acid profiles were observed in the disease cancer stage. Interestingly, tryptophan was identified as a key amino acid associated with cancer progression. New breast cancer diagnostic measures have also been developed by HR‐MAS NMR spectroscopy [86]. This technique provides a means to generate metabolic profiles of intact tissues. HR‐MAS MR spectroscopic studies on breast tissue biopsies revealed elevated concentrations of taurine and choline‐containing compounds, especially phosphocholine in the cancer samples. Moreover, metabolic profiling allowed a clinical prediction with 69% sensitivity and 94% specificity in a validation cohort. NMR and MS metabolic profiles were also used to develop a specific prediction model for early detection of recurrent breast cancer [87], displaying capabilities of metabolomics in providing predictive biomarkers. Interestingly, 55% of patients could be correctly predicted to have recurrence 13 months before the recurrence was clinically diagnosed. Being independent of prior assumptions, metabolomic approaches allow the generation of hypotheses on how nutritional intervention might be beneficial to malignant cancers. NMR‐based metabolomics was used to determine the effects of a diet rich in whole grain rye products on the profile of metabolites in the plasma of prostate cancer patients [88]. Seventeen patients with prostate cancer received 485 g rye bran product or refined white wheat product in a randomized, controlled, crossover design during a period of 6 weeks with a 2 week washout period. Metabolomic analysis of plasma showed an increase in 3‐hydroxybutyric acid, acetone, betaine, N,N‐dimethylglycine and dimethyl sulfone after rye bran product. Plasma homocysteine concentration was lower (P= 0.017) and that of leptin tended to be lower (P= 0.07) after rye bran product intake compared with wheat product intake.
Clinical applications for neurological and psychiatric disorders
Diagnostic markers of clinical metabolomics can also find applications in socio‐psychological and neurodevelopment disorders. Yap et al. displayed, by the use of NMR spectroscopy, the biochemical signature of autistic individuals [89]. Urinary metabolic phenotypes of autistic individuals were marked by increased concentrations of N‐methyl‐2‐pyridone‐5‐carboxamide, N‐methyl nicotinic acid, N‐methyl nicotinamide, taurine and a lower concentration of glutamate. Abnormalities in gut microbiota metabolism were also suggested through lower concentrationsof urinary dimethylamine, hippurate and phenyacetylglutamine in autistic children.
Early detection, risk assessment and therapeutic monitoring of Alzheimer's disease was also studied with metabolomics [90]. Shotgun lipidomics indicated reductions of sphingomyelin and significant increases in two ceramide species (N16:0 and N21:0) in plasma of patients with Alzheimer's disease. A GC‐MS based metabolomic profiling approach was also used to detect potential biomarkers associated with schizophrenia and risperidone treatment [91]. Here 22 marker metabolites provided separation of schizophrenic patients from matched healthy controls, with citrate, palmitic acid, myoinositol and allantoin exhibiting the best combined classification performance. Moreover, 20 markers displayed complete separation between post‐treatment and pre‐treatment patients, with myo‐inositol, uric acid and tryptophan showing the maximum combined classification performance.
A general comprehensive metabolomics population‐based study in Finland [92] determined metabolic differences between persons included in three main psychotic disorders (schizophrenia, n= 45; other nonaffective psychosis (ONAP), n= 57; affective psychosis, n= 37) and controls matched by age, gender and regions. Here, global lipidomics displayed that, compared with healthy controls, persons with schizophrenia had significantly higher metabolite concentrations of six lipid clusters containing mainly saturated triglycerides. In addition, a combined GC metabolomics approach revealed, in persons with schizophrenia, two small molecule clusters containing, among other metabolites, branched chain amino acids, phenylalanine and tyrosine, proline, glutamic, lactic and pyruvic acids. Among these, serum glutamic acid was elevated in all psychoses (P= 0.002) compared with controls, while proline up‐regulation (P= 0.000023) was specific to schizophrenia.
Conclusion: Need for new predictive and mechanistic biomarkers
The increase of incidence of chronic diseases raises new challenges for global public health. Indeed, it has been estimated that by 2020 chronic disease in developing countries will account for almost three‐quarters of all death world‐wide with 75% of death due to stroke, and 70% of death due to diabetes. In such a context, there is a clear need to develop new predictive approaches for preventive medicine and prognostic strategies for personalized therapeutic management and monitoring (Figure 1). The advent of nutrigenomic sciences with a particular emphasis on metabolomics opens new research avenues for biomarker discovery. A large variety of such biomarkers, based on a concept of a metabolic pattern or signature, are increasingly being proposed for various diseases. In future, the advance of analytical technologies which evolve in a very competitive framework will enable new diagnostic assays with improved sensitivity and specificity over the current conventional biomarkers to be implemented in routine laboratories. Yet, despite these potentials, direct translation of metabolomics findings to prognostics screening and personalized diagnostic medicine is still at an early stage. Moreover, the clinical community is largely unfamiliar with the field of metabolomics, including the methodologies, technical challenges, and, most importantly, its clinical uses. In order for such to happen, advancement in linking metabolite data to known and validated clinically relevant indices will have to be seriously considered. The challenges in leveraging the potential of new biomarkers into clinical settings could be alleviated by collaborations between pharmaceutical agencies, diagnostic companies, and academic institutions, with the harnessing of skills from the different clinical, biomedical, diagnostic, and pharmacological areas. Only then, biomarker development and translation into diagnostics could be foreseen to strength disease prediction in asymptomatic conditions, stratification (degree of disease severity), and prognostics for personalized therapeutic solutions. The development of system biology approaches and the new generation of biomarker patterns will provide the opportunity to associate complex metabolic regulations to the aetiology of multifactorial diseases. This will subsequently lead to the development of system mechanistic hypotheses that could be targeted with new nutritional concepts.
Figure 1.
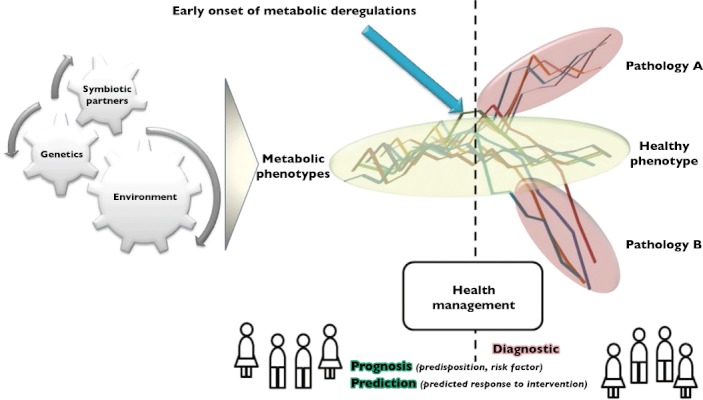
Biomarker applications in clinical settings. Clear opportunities are identified for improve health benefits and preventive medicine
Competing Interests
There are no competing interests to declare.
REFERENCES
- 1.Wishart DS, Tzur D, Knox C, Eisner R, Guo AC, Young N, Cheng D, Jewell K, Arndt D, Sawhney S, Fung C, Nikolai L, Lewis M, Coutouly MA, Forsythe I, Tang P, Shrivastava S, Jeroncic K, Stothard P, Amegbey G, Block D, Hau DD, Wagner J, Miniaci J, Clements M, Gebremedhin M, Guo N, Zhang Y, Duggan GE, Macinnis GD, Weljie AM, Dowlatabadi R, Bamforth F, Clive D, Greiner R, Li L, Marrie T, Sykes BD, Vogel HJ, Querengesser L. HMDB: the Human Metabolome Database. Nucleic Acids Res. 2007;35:D521–6. doi: 10.1093/nar/gkl923. [DOI] [PMC free article] [PubMed] [Google Scholar]
- 2.Nicholson JK, Lindon JC. Systems biology: metabonomics. Nature. 2008;455:1054–6. doi: 10.1038/4551054a. [DOI] [PubMed] [Google Scholar]
- 3.Nicholson JK, Wilson ID. High resolution proton magnetic resonance spectroscopy of biological fluids. Prog Nucl Magn Reson Spectrosc. 1989;21:449–501. [Google Scholar]
- 4.Nicholson JK, Foxall PJ, Spraul M, Farrant RD, Lindon JC. 750 MHZ 1H and 1H‐13C NMR spectroscopy of human blood plasma. Anal Chem. 1995;67:793–811. doi: 10.1021/ac00101a004. [DOI] [PubMed] [Google Scholar]
- 5.Beckonert O, Keun HC, Ebbels TM, Bundy J, Holmes E, Lindon JC, Nicholson JK. Metabolic profiling, metabolomic and metabonomic procedures for NMR spectroscopy of urine, plasma, serum and tissue extracts. Nat Protoc. 2007;2:2692–703. doi: 10.1038/nprot.2007.376. [DOI] [PubMed] [Google Scholar]
- 6.Beckonert O, Coen M, Keun HC, Wang Y, Ebbels TM, Holmes E, Lindon JC, Nicholson JK. High‐resolution magic‐angle‐spinning NMR spectroscopy for metabolic profiling of intact tissues. Nat Protoc. 2010;5:1019–32. doi: 10.1038/nprot.2010.45. [DOI] [PubMed] [Google Scholar]
- 7.Bruce SJ, Tavazzi I, Parisod V, Rezzi S, Kochhar S, Guy PA. Investigation of human blood plasma sample preparation for performing metabolomics using ultrahigh performance liquid chromatography/mass spectrometry. Anal Chem. 2009;81:3285–96. doi: 10.1021/ac8024569. [DOI] [PubMed] [Google Scholar]
- 8.Wilson ID, Plumb R, Granger J, Major H, Williams R, Lenz EM. HPLC‐MS‐based methods for the study of metabonomics. J Chromatogr B Analyt Technol Biomed Life Sci. 2005;817:67–76. doi: 10.1016/j.jchromb.2004.07.045. [DOI] [PubMed] [Google Scholar]
- 9.Ejsing CS, Sampaio JL, Surendranath V, Duchoslav E, Ekroos K, Klemm RW, Simons K, Shevchenko A. Global analysis of the yeast lipidome by quantitative shotgun mass spectrometry. Proc Natl Acad Sci U S A. 2009;106:2136–41. doi: 10.1073/pnas.0811700106. [DOI] [PMC free article] [PubMed] [Google Scholar]
- 10.Pietilainen KH, Sysi‐Aho M, Rissanen A, Seppanen‐Laakso T, Yki‐Jarvinen H, Kaprio J, Oresic M. Acquired obesity is associated with changes in the serum lipidomic profile independent of genetic effects – a monozygotic twin study. PLoS ONE. 2007;2:e218. doi: 10.1371/journal.pone.0000218. [DOI] [PMC free article] [PubMed] [Google Scholar]
- 11.Martin FP, Montoliu I, Kochhar S, Rezzi S. Chemometric strategy for modeling metabolic biological space along the gastrointestinal tract and assessing microbial influences. Anal Chem. 2010;82:9803–11. doi: 10.1021/ac102015n. [DOI] [PubMed] [Google Scholar]
- 12.Richards SE, Dumas ME, Fonville JM, Ebbels TMD, Holmes E, Nicholson JK. Intra‐ and inter‐omic fusion of metabolic profiling data in a systems biology framework. Chemometr Intelligent Lab Syst. 2010;104:121–31. [Google Scholar]
- 13.Trygg J, Holmes E, Lundstedt T. Chemometrics in metabonomics. J Proteome Res. 2007;6:469–79. doi: 10.1021/pr060594q. [DOI] [PubMed] [Google Scholar]
- 14.Solanky KS, Bailey NJ, Beckwith‐Hall BM, Davis A, Bingham S, Holmes E, Nicholson JK, Cassidy A. Application of biofluid 1H nuclear magnetic resonance‐based metabonomic techniques for the analysis of the biochemical effects of dietary isoflavones on human plasma profile. Anal Biochem. 2003;323:197–204. doi: 10.1016/j.ab.2003.08.028. [DOI] [PubMed] [Google Scholar]
- 15.Rezzi S, Ramadan Z, Martin FP, Fay LB, van Bladeren P, Lindon JC, Nicholson JK, Kochhar S. Human metabolic phenotypes link directly to specific dietary preferences in healthy individuals. J Proteome Res. 2007;6:4469–77. doi: 10.1021/pr070431h. [DOI] [PubMed] [Google Scholar]
- 16.Stella C, Beckwith‐Hall B, Cloarec O, Holmes E, Lindon JC, Powell J, van der OF, Bingham S, Cross AJ, Nicholson JK. Susceptibility of human metabolic phenotypes to dietary modulation. J Proteome Res. 2006;5:2780–8. doi: 10.1021/pr060265y. [DOI] [PubMed] [Google Scholar]
- 17.Rezzi S, Martin FP, Shanmuganayagam D, Colman RJ, Nicholson JK, Weindruch R. Metabolic shifts due to long‐term caloric restriction revealed in nonhuman primates. Exp Gerontol. 2009;44:356–62. doi: 10.1016/j.exger.2009.02.008. [DOI] [PMC free article] [PubMed] [Google Scholar]
- 18.Heinzmann SS, Brown IJ, Chan Q, Bictash M, Dumas ME, Kochhar S, Stamler J, Holmes E, Elliott P, Nicholson JK. Metabolic profiling strategy for discovery of nutritional biomarkers: proline betaine as a marker of citrus consumption. Am J Clin Nutr. 2010;92:436–43. doi: 10.3945/ajcn.2010.29672. [DOI] [PMC free article] [PubMed] [Google Scholar]
- 19.Martin FP, Sprenger N, Yap IK, Wang Y, Bibiloni R, Rochat F, Rezzi S, Cherbut C, Kochhar S, Lindon JC, Holmes E, Nicholson JK. Panorganismal gut microbiome‐host metabolic crosstalk. J Proteome Res. 2009;8:2090–105. doi: 10.1021/pr801068x. [DOI] [PubMed] [Google Scholar]
- 20.Claus SP, Ellero SL, Berger B, Krause L, Bruttin A, Molina J, Paris A, Want EJ, de Waziers I, Cloarec O, Richards SE, Wang Y, Dumas ME, Ross A, Rezzi S, Kochhar S, van Bladeren P, Lindon JC, Holmes E, Nicholson JK. Colonization‐induced host‐gut microbial metabolic interaction. MBio. 2011;2:e00271–10. doi: 10.1128/mBio.00271-10. [DOI] [PMC free article] [PubMed] [Google Scholar]
- 21.Merrifield CA, Lewis M, Claus SP, Beckonert OP, Dumas ME, Duncker S, Kochhar S, Rezzi S, Lindon JC, Bailey M, Holmes E, Nicholson JK. A metabolic system‐wide characterisation of the pig: a model for human physiology. Mol Biosyst. 2011;7:2577–88. doi: 10.1039/c1mb05023k. [DOI] [PubMed] [Google Scholar]
- 22.Wikoff WR, Anfora AT, Liu J, Schultz PG, Lesley SA, Peters EC, Siuzdak G. Metabolomics analysis reveals large effects of gut microflora on mammalian blood metabolites. Proc Natl Acad Sci U S A. 2009;106:3698–703. doi: 10.1073/pnas.0812874106. [DOI] [PMC free article] [PubMed] [Google Scholar]
- 23.Martin FP, Wang Y, Yap IK, Sprenger N, Lindon JC, Rezzi S, Kochhar S, Holmes E, Nicholson JK. Topographical variation in murine intestinal metabolic profiles in relation to microbiome speciation and functional ecological activity. J Proteome Res. 2009;8:3464–74. doi: 10.1021/pr900099x. [DOI] [PubMed] [Google Scholar]
- 24.Martin FP, Dumas ME, Wang Y, Legido‐Quigley C, Yap IK, Tang H, Zirah S, Murphy GM, Cloarec O, Lindon JC, Sprenger N, Fay LB, Kochhar S, van Bladeren P, Holmes E, Nicholson JK. A top‐down systems biology view of microbiome‐mammalian metabolic interactions in a mouse model. Mol Syst Biol. 2007;3:112–27. doi: 10.1038/msb4100153. [DOI] [PMC free article] [PubMed] [Google Scholar]
- 25.Nicholson JK, Holmes E, Wilson ID. Gut microorganisms, mammalian metabolism and personalized health care. Nat Rev Microbiol. 2005;3:431–8. doi: 10.1038/nrmicro1152. [DOI] [PubMed] [Google Scholar]
- 26.Hooper LV, Midtvedt T, Gordon JI. How host‐microbial interactions shape the nutrient environment of the mammalian intestine. Annu Rev Nutr. 2002;22:283–307. doi: 10.1146/annurev.nutr.22.011602.092259. [DOI] [PubMed] [Google Scholar]
- 27.Guarner F, Malagelada JR. Gut flora in health and disease. Lancet. 2003;361:512–9. doi: 10.1016/S0140-6736(03)12489-0. [DOI] [PubMed] [Google Scholar]
- 28.Madden JA, Hunter JO. A review of the role of the gut microflora in irritable bowel syndrome and the effects of probiotics. Br J Nutr. 2002;88(1):S67–72. doi: 10.1079/BJN2002631. [DOI] [PubMed] [Google Scholar]
- 29.Bickston SJ, Comerford LW, Cominelli F. Future therapies for inflammatory bowel disease. Curr Gastroenterol Rep. 2003;5:518–23. doi: 10.1007/s11894-003-0043-5. [DOI] [PubMed] [Google Scholar]
- 30.Shanahan F. Inflammatory bowel disease: immunodiagnostics, immunotherapeutics, and ecotherapeutics. Gastroenterology. 2001;120:622–35. doi: 10.1053/gast.2001.22122. [DOI] [PubMed] [Google Scholar]
- 31.Lin HM, Helsby NA, Rowan DD, Ferguson LR. Using metabolomic analysis to understand inflammatory bowel diseases. Inflamm Bowel Dis. 2011;17:1021–9. doi: 10.1002/ibd.21426. [DOI] [PubMed] [Google Scholar]
- 32.Winterkamp S, Weidenhiller M, Otte P, Stolper J, Schwab D, Hahn EG, Raithel M. Urinary excretion of N‐methylhistamine as a marker of disease activity in inflammatory bowel disease. Am J Gastroenterol. 2002;97:3071–7. doi: 10.1111/j.1572-0241.2002.07028.x. [DOI] [PubMed] [Google Scholar]
- 33.Bjerrum JT, Nielsen OH, Hao F, Tang H, Nicholson JK, Wang Y, Olsen J. Metabonomics in ulcerative colitis: diagnostics, biomarker identification, and insight into the pathophysiology. J Proteome Res. 2010;9:954–62. doi: 10.1021/pr9008223. [DOI] [PubMed] [Google Scholar]
- 34.Le GG, Noor SO, Ridgway K, Scovell L, Jamieson C, Johnson IT, Colquhoun IJ, Kemsley EK, Narbad A. Metabolomics of fecal extracts detects altered metabolic activity of gut microbiota in ulcerative colitis and irritable bowel syndrome. J Proteome Res. 2011;10:4208–18. doi: 10.1021/pr2003598. [DOI] [PubMed] [Google Scholar]
- 35.Martin FP, Rezzi S, Philippe D, Tornier L, Messlik A, Holzlwimmer G, Baur P, Quintanilla‐Fend L, Loh G, Blaut M, Blum S, Kochhar S, Haller D. Metabolic assessment of gradual development of moderate experimental colitis in IL‐10 deficient mice. J Proteome Res. 2009;8:2376–87. doi: 10.1021/pr801006e. [DOI] [PubMed] [Google Scholar]
- 36.Murdoch TB, Fu H, Macfarlane S, Sydora BC, Fedorak RN, Slupsky CM. Urinary metabolic profiles of inflammatory bowel disease in interleukin‐10 gene‐deficient mice. Anal Chem. 2008;80:5524–31. doi: 10.1021/ac8005236. [DOI] [PubMed] [Google Scholar]
- 37.Williams HR, Cox IJ, Walker DG, North BV, Patel VM, Marshall SE, Jewell DP, Ghosh S, Thomas HJ, Teare JP, Jakobovits S, Zeki S, Welsh KI, Taylor‐Robinson SD, Orchard TR. Characterization of inflammatory bowel disease with urinary metabolic profiling. Am J Gastroenterol. 2009;104:1435–44. doi: 10.1038/ajg.2009.175. [DOI] [PubMed] [Google Scholar]
- 38.Marchesi JR, Holmes E, Khan F, Kochhar S, Scanlan P, Shanahan F, Wilson ID, Wang Y. Rapid and noninvasive metabonomic characterization of inflammatory bowel disease. J Proteome Res. 2007;6:546–51. doi: 10.1021/pr060470d. [DOI] [PubMed] [Google Scholar]
- 39.Jansson J, Willing B, Lucio M, Fekete A, Dicksved J, Halfvarson J, Tysk C, Schmitt‐Kopplin P. Metabolomics reveals metabolic biomarkers of Crohn's disease. PLoS ONE. 2009;4:e6386. doi: 10.1371/journal.pone.0006386. [DOI] [PMC free article] [PubMed] [Google Scholar]
- 40.Schicho R, Nazyrova A, Shaykhutdinov R, Duggan G, Vogel HJ, Storr M. Quantitative metabolomic profiling of serum and urine in DSS‐induced ulcerative colitis of mice by (1)H NMR spectroscopy. J Proteome Res. 2010;9:6265–73. doi: 10.1021/pr100547y. [DOI] [PubMed] [Google Scholar]
- 41.Otter D, Cao M, Lin HM, Fraser K, Edmunds S, Lane G, Rowan D. Identification of urinary biomarkers of colon inflammation in IL10−/− mice using Short‐Column LCMS metabolomics. J Biomed Biotechnol. 2011:974701–713. doi: 10.1155/2011/974701. [DOI] [PMC free article] [PubMed] [Google Scholar]
- 42.Lin HM, Barnett MP, Roy NC, Joyce NI, Zhu S, Armstrong K, Helsby NA, Ferguson LR, Rowan DD. Metabolomic analysis identifies inflammatory and noninflammatory metabolic effects of genetic modification in a mouse model of Crohn's disease. J Proteome Res. 2010;9:1965–75. doi: 10.1021/pr901130s. [DOI] [PubMed] [Google Scholar]
- 43.Sharma U, Singh RR, Ahuja V, Jagannathan NR, Makharia GK. Similarity in the metabolic profile in macroscopically involved and un‐involved colonic mucosa in patients with inflammatory bowel disease: an in vitro proton ((1)H) MR spectroscopy study. Magn Reson Imaging. 2010;28:1022–9. doi: 10.1016/j.mri.2010.03.039. [DOI] [PubMed] [Google Scholar]
- 44.Balasubramanian K, Kumar S, Singh RR, Sharma U, Ahuja V, Makharia GK, Jagannathan NR. Metabolism of the colonic mucosa in patients with inflammatory bowel diseases: an in vitro proton magnetic resonance spectroscopy study. Magn Reson Imaging. 2009;27:79–86. doi: 10.1016/j.mri.2008.05.014. [DOI] [PubMed] [Google Scholar]
- 45.Baur P, Martin FP, Gruber L, Bosco N, Brahmbhatt V, Collino S, Guy P, Montoliu I, Rozman J, Klingenspor M, Tavazzi I, Thorimbert A, Rezzi S, Kochhar S, Benyacoub J, Kollias G, Haller D. Metabolic phenotyping of the Crohn's disease‐like IBD etiopathology in the TNF(DeltaARE/WT) Mouse Model. J Proteome Res. 2011:5523–35. doi: 10.1021/pr2007973. [DOI] [PubMed] [Google Scholar]
- 46.Loftus EV., Jr Clinical epidemiology of inflammatory bowel disease: incidence, prevalence, and environmental influences. Gastroenterology. 2004;126:1504–17. doi: 10.1053/j.gastro.2004.01.063. [DOI] [PubMed] [Google Scholar]
- 47.Barbara G, De GR, Stanghellini V, Cremon C, Corinaldesi R. A role for inflammation in irritable bowel syndrome? Gut. 2002;51(1):i41–4. doi: 10.1136/gut.51.suppl_1.i41. [DOI] [PMC free article] [PubMed] [Google Scholar]
- 48.Rodriguez LA, Ruigomez A. Increased risk of irritable bowel syndrome after bacterial gastroenteritis: cohort study. BMJ. 1999;318:565–6. doi: 10.1136/bmj.318.7183.565. [DOI] [PMC free article] [PubMed] [Google Scholar]
- 49.Martin FP, Verdu EF, Wang Y, Dumas ME, Yap IK, Cloarec O, Bergonzelli GE, Corthesy‐Theulaz I, Kochhar S, Holmes E, Lindon JC, Collins SM, Nicholson JK. Transgenomic metabolic interactions in a mouse disease model: interactions of trichinella spiralis infection with dietary lactobacillus paracasei supplementation. J Proteome Res. 2006;5:2185–93. doi: 10.1021/pr060157b. [DOI] [PubMed] [Google Scholar]
- 50.Rezzi S, Martin FP, Alonso C, Guilarte M, Vicario M, Ramos L, Martinez C, Lobo B, Saperas E, Malagelada JR, Santos J, Kochhar S. Metabotyping of biofluids reveals stress‐based differences in gut permeability in healthy individuals. J Proteome Res. 2009;8:4799–809. doi: 10.1021/pr900525w. [DOI] [PubMed] [Google Scholar]
- 51.Bertini I, Calabro A, De Carli V, Luchinat C, Nepi S, Porfirio B, Renzi D, Saccenti E, Tenori L. The metabonomic signature of celiac disease. J Proteome Res. 2009;8:170–7. doi: 10.1021/pr800548z. [DOI] [PubMed] [Google Scholar]
- 52.Tjellstrom B, Stenhammar L, Hogberg L, Falth‐Magnusson K, Magnusson KE, Midtvedt T, Sundqvist T, Norin E. Gut microflora associated characteristics in children with celiac disease. Am J Gastroenterol. 2005;100:2784–8. doi: 10.1111/j.1572-0241.2005.00313.x. [DOI] [PubMed] [Google Scholar]
- 53.Grundy SM, Cleeman JI, Daniels SR, Donato KA, Eckel RH, Franklin BA, Gordon DJ, Krauss RM, Savage PJ, Smith SC, Jr, Spertus JA, Fernando C. Diagnosis and management of the metabolic syndrome: an American Heart Association/National Heart, Lung, and Blood Institute scientific statement: executive Summary. Crit Pathw Cardiol. 2005;4:198–203. doi: 10.1097/00132577-200512000-00018. [DOI] [PubMed] [Google Scholar]
- 54.Wirfalt E, Hedblad B, Gullberg B, Mattisson I, Andren C, Rosander U, Janzon L, Berglund G. Food patterns and components of the metabolic syndrome in men and women: a cross‐sectional study within the Malmo Diet and Cancer cohort. Am J Epidemiol. 2001;154:1150–9. doi: 10.1093/aje/154.12.1150. [DOI] [PubMed] [Google Scholar]
- 55.Newgard CB, An J, Bain JR, Muehlbauer MJ, Stevens RD, Lien LF, Haqq AM, Shah SH, Arlotto M, Slentz CA, Rochon J, Gallup D, Ilkayeva O, Wenner BR, Yancy WS, Jr, Eisenson H, Musante G, Surwit RS, Millington DS, Butler MD, Svetkey LP. A branched‐chain amino acid‐related metabolic signature that differentiates obese and lean humans and contributes to insulin resistance. Cell Metab. 2009;9:311–26. doi: 10.1016/j.cmet.2009.02.002. [DOI] [PMC free article] [PubMed] [Google Scholar]
- 56.Suhre K, Meisinger C, Doring A, Altmaier E, Belcredi P, Gieger C, Chang D, Milburn MV, Gall WE, Weinberger KM, Mewes HW, Hrabe de AM, Wichmann HE, Kronenberg F, Adamski J, Illig T. Metabolic footprint of diabetes: a multiplatform metabolomics study in an epidemiological setting. PLoS ONE. 2010;5:e13953. doi: 10.1371/journal.pone.0013953. [DOI] [PMC free article] [PubMed] [Google Scholar]
- 57.Huffman KM, Shah SH, Stevens RD, Bain JR, Muehlbauer M, Slentz CA, Tanner CJ, Kuchibhatla M, Houmard JA, Newgard CB, Kraus WE. Relationships between circulating metabolic intermediates and insulin action in overweight to obese, inactive men and women. Diabetes Care. 2009;32:1678–83. doi: 10.2337/dc08-2075. [DOI] [PMC free article] [PubMed] [Google Scholar]
- 58.Fiehn O, Garvey WT, Newman JW, Lok KH, Hoppel CL, Adams SH. Plasma metabolomic profiles reflective of glucose homeostasis in non‐diabetic and type 2 diabetic obese African‐American women. PLoS ONE. 2010;5:e15234. doi: 10.1371/journal.pone.0015234. [DOI] [PMC free article] [PubMed] [Google Scholar]
- 59.Rhee EP, Cheng S, Larson MG, Walford GA, Lewis GD, McCabe E, Yang E, Farrell L, Fox CS, O'Donnell CJ, Carr SA, Vasan RS, Florez JC, Clish CB, Wang TJ, Gerszten RE. Lipid profiling identifies a triacylglycerol signature of insulin resistance and improves diabetes prediction in humans. J Clin Invest. 2011;121:1402–11. doi: 10.1172/JCI44442. [DOI] [PMC free article] [PubMed] [Google Scholar]
- 60.Wang TJ, Larson MG, Vasan RS, Cheng S, Rhee EP, McCabe E, Lewis GD, Fox CS, Jacques PF, Fernandez C, O'Donnell CJ, Carr SA, Mootha VK, Florez JC, Souza A, Melander O, Clish CB, Gerszten RE. Metabolite profiles and the risk of developing diabetes. Nat Med. 2011;17:448–53. doi: 10.1038/nm.2307. [DOI] [PMC free article] [PubMed] [Google Scholar]
- 61.Huffman KM, Slentz CA, Bateman LA, Thompson D, Muehlbauer MJ, Bain JR, Stevens RD, Wenner BR, Kraus VB, Newgard CB, Kraus WE. Exercise‐induced changes in metabolic intermediates, hormones, and inflammatory markers associated with improvements in insulin sensitivity. Diabetes Care. 2011;34:174–6. doi: 10.2337/dc10-0709. [DOI] [PMC free article] [PubMed] [Google Scholar]
- 62.Lanza IR, Zhang S, Ward LE, Karakelides H, Raftery D, Nair KS. Quantitative metabolomics by H‐NMR and LC‐MS/MS confirms altered metabolic pathways in diabetes. PLoS ONE. 2010;5:e10538. doi: 10.1371/journal.pone.0010538. [DOI] [PMC free article] [PubMed] [Google Scholar]
- 63.Sysi‐Aho M, Ermolov A, Gopalacharyulu PV, Tripathi A, Seppanen‐Laakso T, Maukonen J, Mattila I, Ruohonen ST, Vahatalo L, Yetukuri L, Harkonen T, Lindfors E, Nikkila J, Ilonen J, Simell O, Saarela M, Knip M, Kaski S, Savontaus E, Oresic M. Metabolic regulation in progression to autoimmune diabetes. PLoS Comput Biol. 2011;7:e1002257. doi: 10.1371/journal.pcbi.1002257. [DOI] [PMC free article] [PubMed] [Google Scholar]
- 64.Nikkila J, Sysi‐Aho M, Ermolov A, Seppanen‐Laakso T, Simell O, Kaski S, Oresic M. Gender‐dependent progression of systemic metabolic states in early childhood. Mol Syst Biol. 2008;4:197. doi: 10.1038/msb.2008.34. [DOI] [PMC free article] [PubMed] [Google Scholar]
- 65.Oresic M, Simell S, Sysi‐Aho M, Nanto‐Salonen K, Seppanen‐Laakso T, Parikka V, Katajamaa M, Hekkala A, Mattila I, Keskinen P, Yetukuri L, Reinikainen A, Lahde J, Suortti T, Hakalax J, Simell T, Hyoty H, Veijola R, Ilonen J, Lahesmaa R, Knip M, Simell O. Dysregulation of lipid and amino acid metabolism precedes islet autoimmunity in children who later progress to type 1 diabetes. J Exp Med. 2008;205:2975–84. doi: 10.1084/jem.20081800. [DOI] [PMC free article] [PubMed] [Google Scholar]
- 66.Fabbrini E, Sullivan S, Klein S. Obesity and nonalcoholic fatty liver disease: biochemical, metabolic, and clinical implications. Hepatology. 2010;51:679–89. doi: 10.1002/hep.23280. [DOI] [PMC free article] [PubMed] [Google Scholar]
- 67.Johnson NA, Walton DW, Sachinwalla T, Thompson CH, Smith K, Ruell PA, Stannard SR, George J. Noninvasive assessment of hepatic lipid composition: advancing understanding and management of fatty liver disorders. Hepatology. 2008;47:1513–23. doi: 10.1002/hep.22220. [DOI] [PubMed] [Google Scholar]
- 68.Tiniakos DG, Vos MB, Brunt EM. Nonalcoholic fatty liver disease: pathology and pathogenesis. Annu Rev Pathol. 2010;5:145–71. doi: 10.1146/annurev-pathol-121808-102132. [DOI] [PubMed] [Google Scholar]
- 69.James OF, Day CP. Non‐alcoholic steatohepatitis (NASH): a disease of emerging identity and importance. J Hepatol. 1998;29:495–501. doi: 10.1016/s0168-8278(98)80073-1. [DOI] [PubMed] [Google Scholar]
- 70.Day CP, James OF. Steatohepatitis: a tale of two ‘hits’? Gastroenterology. 1998;114:842–5. doi: 10.1016/s0016-5085(98)70599-2. [DOI] [PubMed] [Google Scholar]
- 71.Rull A, Vinaixa M, Angel RM, Beltran R, Brezmes J, Canellas N, Correig X, Joven J. Metabolic phenotyping of genetically modified mice: an NMR metabonomic approach. Biochimie. 2009;91:1053–7. doi: 10.1016/j.biochi.2009.04.019. [DOI] [PubMed] [Google Scholar]
- 72.Li H, Wang L, Yan X, Liu Q, Yu C, Wei H, Li Y, Zhang X, He F, Jiang Y. A proton nuclear magnetic resonance metabonomics approach for biomarker discovery in nonalcoholic fatty liver disease. J Proteome Res. 2011;10:2797–806. doi: 10.1021/pr200047c. [DOI] [PubMed] [Google Scholar]
- 73.Barr J, Vazquez‐Chantada M, Alonso C, Perez‐Cormenzana M, Mayo R, Galan A, Caballeria J, Martin‐Duce A, Tran A, Wagner C, Luka Z, Lu SC, Castro A, Le Marchand‐Brustel Y, Martinez‐Chantar ML, Veyrie N, Clement K, Tordjman J, Gual P, Mato JM. Liquid chromatography‐mass spectrometry‐based parallel metabolic profiling of human and mouse model serum reveals putative biomarkers associated with the progression of nonalcoholic fatty liver disease. J Proteome Res. 2010;9:4501–12. doi: 10.1021/pr1002593. [DOI] [PMC free article] [PubMed] [Google Scholar]
- 74.Kalhan SC, Guo L, Edmison J, Dasarathy S, McCullough AJ, Hanson RW, Milburn M. Plasma metabolomic profile in nonalcoholic fatty liver disease. Metabolism. 2011;60:404–13. doi: 10.1016/j.metabol.2010.03.006. [DOI] [PMC free article] [PubMed] [Google Scholar]
- 75.Feldstein AE, Lopez R, Tamimi TA, Yerian L, Chung YM, Berk M, Zhang R, McIntyre TM, Hazen SL. Mass spectrometric profiling of oxidized lipid products in human nonalcoholic fatty liver disease and nonalcoholic steatohepatitis. J Lipid Res. 2010;51:3046–54. doi: 10.1194/jlr.M007096. [DOI] [PMC free article] [PubMed] [Google Scholar]
- 76.Tulipani S, Llorach R, Jauregui O, Lopez‐Uriarte P, Garcia‐Aloy M, Bullo M, Salas‐Salvado J, Andres‐Lacueva C. Metabolomics Unveils Urinary Changes in Subjects with Metabolic Syndrome following 12‐Week Nut Consumption. J Proteome Res. 2011;10:5047–58. doi: 10.1021/pr200514h. [DOI] [PubMed] [Google Scholar]
- 77.Yap IK, Brown IJ, Chan Q, Wijeyesekera A, Garcia‐Perez I, Bictash M, Loo RL, Chadeau‐Hyam M, Ebbels T, De IM, Maibaum E, Zhao L, Kesteloot H, Daviglus ML, Stamler J, Nicholson JK, Elliott P, Holmes E. Metabolome‐wide association study identifies multiple biomarkers that discriminate north and south Chinese populations at differing risks of cardiovascular disease: INTERMAP study. J Proteome Res. 2010;9:6647–54. doi: 10.1021/pr100798r. [DOI] [PMC free article] [PubMed] [Google Scholar]
- 78.Makinen VP, Soininen P, Forsblom C, Parkkonen M, Ingman P, Kaski K, Groop PH, la‐Korpela M. 1H NMR metabonomics approach to the disease continuum of diabetic complications and premature death. Mol Syst Biol. 2008;4:167. doi: 10.1038/msb4100205. [DOI] [PMC free article] [PubMed] [Google Scholar]
- 79.Kell DB. Metabolomic biomarkers: search, discovery and validation. Expert Rev Mol Diagn. 2007;7:329–33. doi: 10.1586/14737159.7.4.329. [DOI] [PubMed] [Google Scholar]
- 80.Sreekumar A, Poisson LM, Rajendiran TM, Khan AP, Cao Q, Yu J, Laxman B, Mehra R, Lonigro RJ, Li Y, Nyati MK, Ahsan A, Kalyana‐Sundaram S, Han B, Cao X, Byun J, Omenn GS, Ghosh D, Pennathur S, Alexander DC, Berger A, Shuster JR, Wei JT, Varambally S, Beecher C, Chinnaiyan AM. Metabolomic profiles delineate potential role for sarcosine in prostate cancer progression. Nature. 2009;457:910–4. doi: 10.1038/nature07762. [DOI] [PMC free article] [PubMed] [Google Scholar] [Research Misconduct Found]
- 81.Sawyers CL. The cancer biomarker problem. Nature. 2008;452:548–52. doi: 10.1038/nature06913. [DOI] [PubMed] [Google Scholar]
- 82.Kind T, Tolstikov V, Fiehn O, Weiss RH. A comprehensive urinary metabolomic approach for identifying kidney cancerr. Anal Biochem. 2007;363:185–95. doi: 10.1016/j.ab.2007.01.028. [DOI] [PubMed] [Google Scholar]
- 83.Denkert C, Budczies J, Kind T, Weichert W, Tablack P, Sehouli J, Niesporek S, Konsgen D, Dietel M, Fiehn O. Mass spectrometry‐based metabolic profiling reveals different metabolite patterns in invasive ovarian carcinomas and ovarian borderline tumors. Cancer Res. 2006;66:10795–804. doi: 10.1158/0008-5472.CAN-06-0755. [DOI] [PubMed] [Google Scholar]
- 84.Pasikanti KK, Esuvaranathan K, Ho PC, Mahendran R, Kamaraj R, Wu QH, Chiong E, Chan EC. Noninvasive urinary metabonomic diagnosis of human bladder cancer. J Proteome Res. 2010;9:2988–95. doi: 10.1021/pr901173v. [DOI] [PubMed] [Google Scholar]
- 85.Miyagi Y, Higashiyama M, Gochi A, Akaike M, Ishikawa T, Miura T, Saruki N, Bando E, Kimura H, Imamura F, Moriyama M, Ikeda I, Chiba A, Oshita F, Imaizumi A, Yamamoto H, Miyano H, Horimoto K, Tochikubo O, Mitsushima T, Yamakado M, Okamoto N. Plasma free amino acid profiling of five types of cancer patients and its application for early detection. PLoS ONE. 2011;6:e24143. doi: 10.1371/journal.pone.0024143. [DOI] [PMC free article] [PubMed] [Google Scholar]
- 86.Li M, Song Y, Cho N, Chang JM, Koo HR, Yi A, Kim H, Park S, Moon WK. An HR‐MAS MR metabolomics study on breast tissues obtained with core needle biopsy. PLoS ONE. 2011;6:e25563. doi: 10.1371/journal.pone.0025563. [DOI] [PMC free article] [PubMed] [Google Scholar]
- 87.Gu H, Pan Z, Xi B, Asiago V, Musselman B, Raftery D. Principal component directed partial least squares analysis for combining nuclear magnetic resonance and mass spectrometry data in metabolomics: application to the detection of breast cancer. Anal Chim Acta. 2011;686:57–63. doi: 10.1016/j.aca.2010.11.040. [DOI] [PMC free article] [PubMed] [Google Scholar]
- 88.Moazzami AA, Zhang JX, Kamal‐Eldin A, Aman P, Hallmans G, Johansson JE, Andersson SO. Nuclear magnetic resonance‐based metabolomics enable detection of the effects of a whole grain rye and rye bran diet on the metabolic profile of plasma in prostate cancer patients. J Nutr. 2011;141:2126–32. doi: 10.3945/jn.111.148239. [DOI] [PubMed] [Google Scholar]
- 89.Yap IK, Angley M, Veselkov KA, Holmes E, Lindon JC, Nicholson JK. Urinary metabolic phenotyping differentiates children with autism from their unaffected siblings and age‐matched controls. J Proteome Res. 2010;9:2996–3004. doi: 10.1021/pr901188e. [DOI] [PubMed] [Google Scholar]
- 90.Han X, Rozen S, Boyle SH, Hellegers C, Cheng H, Burke JR, Welsh‐Bohmer KA, Doraiswamy PM, Kaddurah‐Daouk R. Metabolomics in early Alzheimer's disease: identification of altered plasma sphingolipidome using shotgun lipidomics. PLoS ONE. 2011;6:e21643. doi: 10.1371/journal.pone.0021643. [DOI] [PMC free article] [PubMed] [Google Scholar]
- 91.Xuan J, Pan G, Qiu Y, Yang L, Su M, Liu Y, Chen J, Feng G, Fang Y, Jia W, Xing Q, He L. Metabolomic profiling to identify potential serum biomarkers for schizophrenia and risperidone action. J Proteome Res. 2011;10:5433–43. doi: 10.1021/pr2006796. [DOI] [PubMed] [Google Scholar]
- 92.Oresic M, Tang J, Seppanen‐Laakso T, Mattila I, Saarni SE, Saarni SI, Lonnqvist J, Sysi‐Aho M, Hyotylainen T, Perala J, Suvisaari J. Metabolome in schizophrenia and other psychotic disorders: a general population‐based study. Genome Med. 2011;3:19. doi: 10.1186/gm233. [DOI] [PMC free article] [PubMed] [Google Scholar]