

Abstract
Objectives
To determine if the ratio of triglycerides to high-density lipoprotein cholesterol (TG/HDL) and non–HDL cholesterol concentration could identify youth with small dense low-density lipoprotein (LDL).
Study design
One hundred forty-one (75 black and 66 white) overweight adolescents (9 to <18 years) had a fasting measurement of plasma lipids and LDL particle concentrations and size. Receiver operating characteristic curves were used to indicate the ability of different TG/HDL ratios and non–HDL cholesterol concentrations to identify overweight youth with atherogenic LDL concentration and size.
Results
Youth with a TG/HDL ratio of ≥3 vs <3 had higher concentrations of small dense LDL (1279.5 ± 60.1 vs 841.8 ± 24.2 nmol/L, P < .001) and smaller LDL particle size (20.3 ± 0.1 vs 21.2 ± 0.1 nm, P < .001). In receiver operating characteristic analyses a TG/HDL cut-point of 3 best predicted LDL concentration in white youth, and 2.5 in black youth. Non-HDL cholesterol cut-point of 120 mg/dL and 145 mg/dL predicted LDL particle concentration in white and in black youth, respectively. TG/HDL ratio with body mass index or waist circumference explained 71% and 79% of the variance, respectively, in total small LDL.
Conclusions
TG/HDL ratio and non-HDL cholesterol can identify overweight youth with atherogenic LDL particles. These easily obtained clinical lipid markers, in combination with body mass index and waist circumference, could be cost effective, in observational or interventional studies, for screening and follow-up of youth at heightened risk for atherogenic LDL.
Pediatric obesity is associated with dyslipidemia,1,2 including adverse lipoprotein particle size and subclass concentration.3,4 Methods of assessing elevated atherogenic lipoproteins is important as these particles, in particular, small dense low-density lipoprotein (LDL), are predictive of adult coronary heart disease.5,6
Our group previously showed that the ratio of fasting triglycerides to high-density lipoprotein (TG/HDL) cholesterol can predict insulin resistance in youth.7 Such a measurement is easily obtained as part of a traditional lipid panel and is available to health care providers. Whether the same marker can be used to identify the presence of small dense LDL in obese youth3,8 is uncertain but seems plausible. In obese 13- to 16-year-old adolescents, TG and HDL cholesterol were found to explain 32% and 16% of the individual variation in LDL particle size, respectively.9 More recently, TG/HDL ratio was shown to be negatively related to LDL particle size and large LDL concentration in youth and positively related to small LDL concentration in adulthood.10 Thus, TG/HDL ratio could provide a method of early identification of youth at risk for atherogenic LDL particles in later life.
An alternative marker to TG/HDL ratio, easily derived from a lipid panel, is non-HDL cholesterol.11 It is calculated by subtracting HDL cholesterol from total cholesterol and reflects the concentration of many atherogenic lipoproteins, including LDL cholesterol.11 Non-HDL cholesterol measured in childhood has been found to persist into adulthood and predict adult dyslipidemia12 and adult subclinical atherosclerosis.13 Whether non-HDL cholesterol can be used to identify atherogenic LDL particles in adolescents, however, has not been shown. The purpose of the present study, therefore, was to investigate if TG/HDL ratio and non-HDL cholesterol concentration could be used as markers for LDL particle size and concentration in overweight youth.
Methods
Participants were 141 overweight (body mass index [BMI] ≥85th percentile for age and sex), otherwise healthy youth (age range, 9 to <18 years, 75 black and 66 white; 60 boys and 81 girls), recruited through advertisement. Some participants were reported previously as part of an ongoing study.8,14 Procedures took place after institutional review board approval, parental written informed consent, and participant assent were received. Participants were screened by medical history, physical examination, and hematologic and biochemical tests.
Body composition was assessed using dual energy x-ray absorptiometry.14 Abdominal subcutaneous and visceral adipose tissues were determined at L4-5 by computed tomography scan.14 Blood samples were collected from all children after an overnight fast for analysis of lipids and lipoproteins. Plasma lipid concentrations (total, HDL, and LDL cholesterol and total and very low-density lipoprotein TG) were determined using the standards of the Centers for Disease Control and Prevention as described.8 Non-HDL cholesterol concentration was calculated by subtracting HDL cholesterol concentration from total cholesterol concentration.11 LDL particle concentration and size were determined using nuclear magnetic resonance spectroscopy (LipoScience Inc, Raleigh, North Carolina).15 Using this method, the quantity of each LDL subclass is reported in particle concentration units (nanomoles of particles per liter). Total LDL is separated into 4 subclass categories: intermediate-density lipoprotein (IDL; 23-27 nm); large LDL (21.2-23 nm); medium-small LDL (19.8-21.2 nm); and very small LDL (18-19.8 nm).
Statistical Analyses
Statistics were performed using SPSS 18.0 (SPSS Inc, Chicago, Illinois). Receiver operating characteristic (ROC) curves were plotted and the area under the ROC curve was used as an indicator of the ability of different TG/HDL ratios (1.5, 2.0, 2.5, 3.0, 3.5, and 4.0) to identify overweight youth with the highest small dense LDL particle concentrations and smallest LDL particle size. Individual ROC curves were also constructed for males and females, and black and white overweight youth. Similarly ROC curves were constructed for non-HDL cholesterol at cut-off concentrations of 120 mg/dL and 145 mg/dL. These concentrations were chosen as they are suggested to reflect acceptable and high non-HDL cholesterol in children12 and equate to the 70th and 90th percentile of non-HDL cholesterol, respectively, for 12- to 19-year-old youth examined in the National Health and Nutrition Examination Survey between 1999 and 2004.11 Two-way ANOVA was used to identify differences in body composition, lipids, and lipoproteins at the identified TG/HDL ratios between black and white youth. Categorical variables (sex, race, Tanner stage) were compared using χ2 tests. Pearson correlation analysis was used to examine the relationships between LDL particle concentrations and size and TG/HDL ratio and body composition. Multiple regression analyses were used to identify the independent contribution of age, sex, race, Tanner stage, BMI, and TG/HDL ratio to total small LDL particle concentrations and LDL particle size. In further multiple regressions analyses, BMI, was substituted for BMI percentile, percentage body fat, fat mass, waist circumference, or visceral fat. Data are presented as mean ± SE. Significance was set at P < .05.
Results
For the group as a whole, the greatest area under the ROC curve as a marker of total and total small, medium small, and very small LDL particle concentrations was a TG/HDL cut-point of 3 (Figure 1, A). The same cut-point had the smallest area under the ROC curve for LDL particle size. Analyzed separately, the greatest area under the ROC curve for small LDL concentration for whites remained a cut-point of 3.0 (Figure 1, B), whereas for blacks it was a TG/HDL ratio cut-point of 2.5 (Figure 1, C). For males a TG/HDL ratio cut-point of 2.5 and for females a cut-point of 3.0 was the best marker for small LDL concentration (data not shown).
Figure 1.
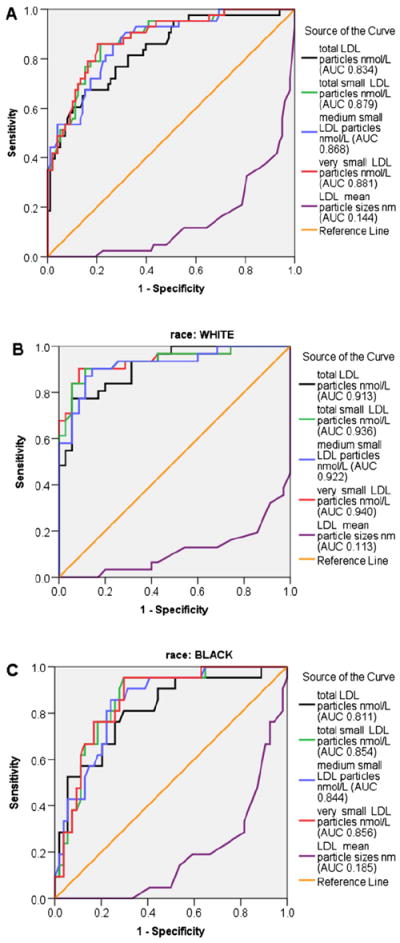
ROC curves for total, total small, medium small, and very small LDL particle concentrations and LDL particle size A, at a TG/HDL ratio and B, cut-point of 3 in all overweight and white overweight youth, and C, cut-point of 2.5 in black overweight youth. AUC, area under the curve.
For the group as a whole, the area under the ROC curve showed little difference between the 2 cut-points of 120 mg/dL and 145 mg/dL for medium small (area under ROC curve: 0.795 vs 0.787, respectively) or very small (area under ROC curve: 0.810 vs 0.814, respectively) LDL particles. Analyzed by race, a cut-point of 120 mg/dL had the largest area under the curve for white youth, but for blacks, 145 mg/dL was larger (Figure 2). Analyzed by sex, cut-point of 120 mg/dL had a greater area under the curve for females for medium small (0.828) and very small LDL (0.837). For males, a cut-point of 145 mg/dL was the best marker for medium small (0.797) and very small LDL (0.828).
Figure 2.
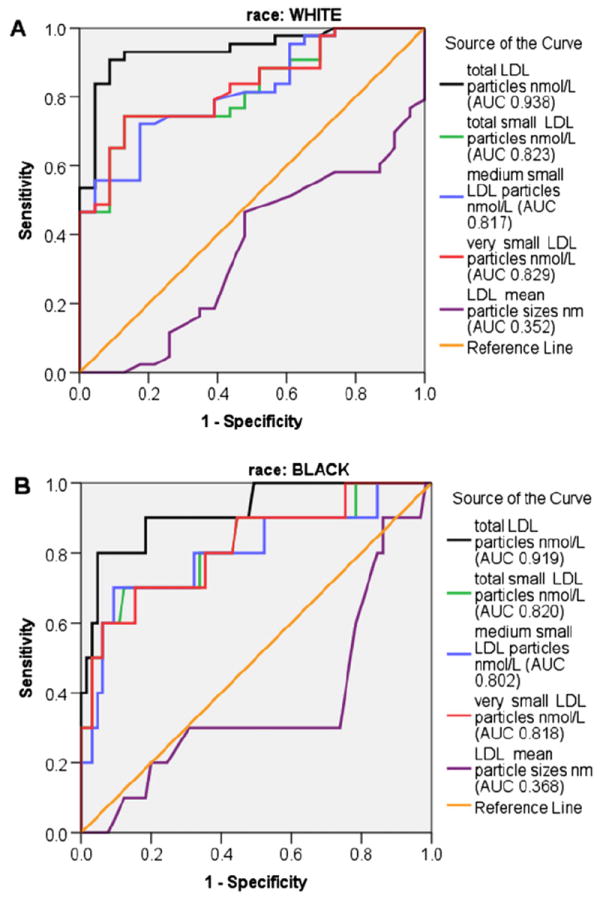
ROC curves for total, total small, medium small, and very small LDL particle concentrations, and LDL particle size, at a non-HDL cholesterol cut-point of A, 120 mg/dL for overweight white youth and B, 145 mg/dL for overweight black youth.
The Table presents the characteristics of all participants grouped according to TG/HDL ratio of <3 vs ≥3 and race. Significantly higher BMI, BMI percentile, waist circumference, fat mass, and absolute and percentage visceral and subcutaneous abdominal fat mass were observed in participants with a TG/HDL ratio of ≥3 compared with those with a ratio of <3. Youth with a TG/HDL ratio of ≥3 had higher concentrations of total cholesterol, TG, non-HDL cholesterol, and very low-density lipoprotein TG and lower concentrations of HDL cholesterol than those whose TG/HDL ratio was <3. There was a significant race difference between the 2 groups, with more black children with a TG/HDL ratio of <3 than ≥3. There was a significant main effect of race for visceral adiposity, total cholesterol, TG, LDL cholesterol, and non-HDL cholesterol. Black youth grouped according to a TG/HDL ratio of <2.5 vs ≥2.5 had lower visceral fat (43.3 ± 3.2 cm2 vs 69.1 ± 10.4 cm2, P =.027). There were no TG/HDL ratio by race interactions for any variables presented in the Table.
Table.
Participant characteristics by TG/HDL ratio and race
| TG/HDL <3
|
TG/HDL ≥3
|
Significant main effects in 2-way ANOVA | |||
|---|---|---|---|---|---|
| Black | White | Black | White | ||
| n | 63 | 35 | 12 | 31 | Race, P < .001* |
| Male/female | 23/40 | 15/20 | 6/6 | 16/15 | None* |
| Age, y | 13.5 ± 0.2 | 13.1 ± 0.3 | 13.3 ± 0.6 | 14.0 ± 0.4 | None |
| Tanner stage | |||||
| II-III | 21 | 16 | 3 | 14 | None* |
| IV-V | 42 | 19 | 9 | 17 | None* |
| BMI, kg/m2 | 31.9 ± 0.8 | 31.2 ± 1.2 | 35.9 ± 2.0 | 34.4 ± 1.2 | TG/HDL, P =.008 |
| BMI percentile | 96.5 ± 0.5 | 95.9 ± 0.7 | 98.3 ± 0.6 | 98.0 ± 0.4 | TG/HDL, P =.006 |
| Waist circumference, cm | 92.5 ± 2.0 | 92.4 ± 3.1 | 101.6 ± 4.4 | 106.7 ± 3.8 | TG/HDL, P =.001 |
| Fat mass, kg | 32.6 ± 1.6 | 30.4 ± 2.1 | 37.0 ± 4.1 | 37.4 ± 2.3 | TG/HDL, P =.026 |
| Percentage body fat | 39.5 ± 1.0 | 39.3 ± 1.5 | 39.8 ± 3.7 | 41.9 ± 1.1 | None |
| Visceral fat, cm2 | 46.4 ± 3.3† | 61.9 ± 5.7 | 72.4 ± 6.6 | 86.8 ± 6.6 | TG/HDL, P < .001; race, P =.031 |
| Subcutaneous fat, cm2 | 403.5 ± 24.8 | 412.2 ± 34.4 | 448.5 ± 69.5 | 507.6 ± 35.5 | None |
| Percentage visceral fat | 11.0 ± 0.6† | 13.6 ± 0.8 | 14.1 ± 1.7 | 15.2 ± 0.9 | TG/HDL, P =.022 |
| Percentage subcutaneous fat | 88.9 ± 0.6† | 86.4 ± 0.8 | 85.8 ± 1.7 | 84.8 ± 0.9 | TG/HDL, P =.024 |
| Total cholesterol, mg/dL | 150.9 ± 3.9 | 160.5 ± 5.0 | 163.8 ± 11.5† | 187.5 ± 5.4 | TG/HDL, P =.002; race, P =.009 |
| TG, mg/dL | 74.4 ± 3.0† | 84.4 ± 3.2 | 170.1 ± 22.6 | 190.3 ± 14.5 | TG/HDL, P < .001; race, P =.057 |
| HDL cholesterol, mg/dL | 44.5 ± 1.1 | 45.1 ± 0.9 | 34.7 ± 2.5 | 35.2 ± 1.0 | TG/HDL, P < .001 |
| LDL cholesterol, mg/dL | 92.2 ± 3.6 | 98.5 ± 4.9 | 95.8 ± 10.9 | 114.2 ± 4.8 | Race, P =.035 |
| Non-HDL cholesterol, mg/dL | 106.4 ± 3.9 | 115.4 ± 5.0 | 129.1 ± 10.1† | 152.2 ± 5.3 | TG/HDL, P < .001; race, P =.009 |
| VLDL TG, mg/dL | 14.8 ± 0.6† | 16.9 ± 0.7 | 33.6 ± 4.6 | 38.1 ± 2.9 | TG/HDL, P < .001 |
VLDL, very low-density lipoprotein.
Values are mean ± SE.
χ2.
Significantly different using independent t test from white children within same TG/HDL ratio, P < .05.
Figure 3 presents the LDL subclass concentrations and particle size by TG/HDL ratio of <3 vs ≥3 and by race. Children with a TG/HDL ratio of ≥3 had significantly higher concentrations of total LDL, medium small, and very small LDL, and IDL particles (72.2 ± 8.3 vs 28.9 ± 3.1 nmol/L, P < .001) and lower concentrations of large LDL particles with smaller LDL particle size than youth with a TG/HDL ratio of <3 (Figure 3). There was a tendency for total LDL to be higher in white children (P =.072). No significant interactions were found for LDL particles grouped by TG/HDL ratio and race; however, total LDL, IDL (interaction P =.060), and medium small LDL tended to be greater in white than in black children with a TG/HDL ratio of ≥3.
Figure 3.
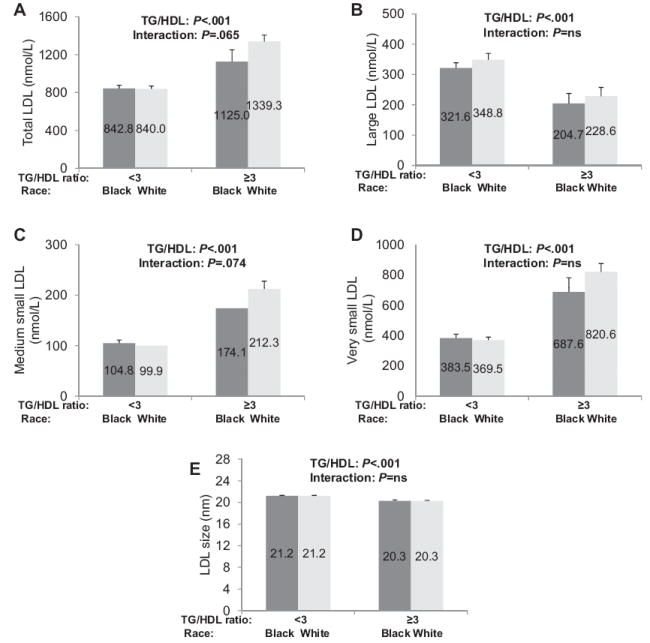
Concentrations of A, total, B, large, C, medium small, and D, very small LDL, and E, LDL particle size in black and white youth with a TG/HDL ratio <3 and ≥3. Differences compared using 2-way ANOVA. NS, not significant.
Total small LDL concentrations were significantly correlated with BMI (r = 0.337, P < .0001), BMI percentile (r = 0.386, P < .0001), percentage body fat (r = 0.328, P < .0001), fat mass (r = 0.405, P < .0001), waist circumference (r = 0.436, P < .0001), visceral fat (r = 0.529, P < .0001), and TG/HDL ratio (r = 0.668, P < .0001) but not age or Tanner stage. Similar correlations were seen for medium and very small LDL particles, while for LDL particle size, significant negative correlations were observed.
In multiple regression analysis with total small LDL as the dependent variable and age, sex, race, Tanner stage, BMI, and TG/HDL ratio as the independent variables, TG/HDL ratio (partial r = 0.658, P < .001) and BMI (partial r = 0.305, P < .001) explained 71% of the variance in total small LDL concentration. These contributions remained similar when BMI was substituted by BMI percentile, percentage body fat, or fat mass. When BMI was substituted by waist circumference, together with TG/HDL ratio they explained 79% of the variance in small LDL (TG/HDL ratio partial r = 0.733, P < .001; waist circumference partial r = 0.359, P < .001). When visceral fat replaced waist circumference, 74% of the variance in small LDL was explained by TG/HDL ratio (partial r = 0.603, P < .001) and visceral fat (partial r = 0.433, P < .001). In multiple regression analyses with LDL particle size as the dependent variable, BMI (partial r = −0.320, P < .001) and TG/HDL ratio (partial r = −0.621, P < .001), or waist circumference (partial r = −0.335, P =.001) and TG/HDL ratio (partial r = −0.594, P < .001), both explained ~68% of the variance in LDL particle size.
Discussion
Both TG and HDL cholesterol have been suggested to be useful markers for LDL particle size in overweight youth.9 In 80 obese, black or white 13- to 16-year-olds, TG and HDL cholesterol were found to explain 32% and 16% of the individual variation in LDL particle size, respectively.9 Our data support these findings because TG/HDL was the single strongest marker of small dense LDL. Moreover, used in combination with a simple marker of adiposity such as BMI or waist circumference, TG/HDL ratio explained >70% of the variance in small LDL particle concentration and LDL particle size in overweight youth. These data are important as cardiovascular risk factors persist over time from childhood to adulthood,16 and small dense LDL are predictive of coronary heart disease in adults.5,6 One recent study found that TG/HDL cholesterol ratio measured in late adolescence (17 years) was negatively related to LDL particle size and large LDL concentration and positively related to small LDL concentration in 770 Israelis followed into adulthood over an average period of 13 years.10 The same study demonstrated that youth with a TG/HDL cholesterol ratio in the highest quintile (>2.54) had a sharply increased OR of being in the upper quartile of small LDL concentration in adulthood (OR = 7.5).10 The present study extends these data by targeting overweight youth rather than normal weight youth, across the entire pubertal range, and by including black children. Collectively, these data suggest that TG/HDL ratio is a useful marker of elevated small LDL and heightened cardiovascular risk profile early in overweight youth.
We have previously demonstrated that fasting TG/HDL cholesterol ratio can predict insulin resistance in youth7 and also found a strong relationship between insulin resistance and LDL particle size and small dense LDL concentrations in both black and white youth.8 However, the clinical importance of small dense LDL concentrations for atherosclerotic risk in obese, insulin-resistant youth may be the contribution it makes to total LDL particles. In the present study, total LDL concentrations were greater in youth with a TG/HDL ratio of ≥3 and 77% of total LDL particles were small in the children with TG/HDL ratio of ≥3 compared with only 57% in youth whose TG/HDL ratio of <3. Possibly, therefore, small LDL particles are a marker for the atherosclerotic risk represented by total LDL particles in obese youth. Studies in adults have found that total LDL particle number has a strong association with coronary artery calcification17 and total LDL particle concentration displays a stronger predictive value for cardiovascular risk than LDL particle size.18
For white children, the greatest area under the ROC curve was found at a TG/HDL cut-point of 3, whereas for black children it was 2.5. Cross-sectional studies have demonstrated favorable traditional lipid profiles, characterized by lower TG, in black compared with white children,19,20 and we8 and others21 previously demonstrated that black children have larger LDL particle size than their white counterparts—an effect mediated by race differences in visceral adiposity.8 The finding in the present study that a lower TG/HDL ratio discriminates the presence of elevated small LDL particles is, therefore, not surprising given the favorable concentrations in black youth. Higher HDL cholesterol concentrations22 may explain why a lower TG/HDL cholesterol ratio was a better indicator of LDL particles in the girls in the present study.
Non-HDL cholesterol has emerged as an important lipid marker that reflects the concentration of many atherogenic lipoproteins, including LDL cholesterol.11 Retrospective analysis of non-HDL cholesterol measured in participants from the Bogalusa Heart Study demonstrates that non-HDL cholesterol levels measured in childhood persist into adulthood12 and predict adult subclinical atherosclerosis13 and adult dyslipidemia.12 Importantly, individuals in the top quartile of non-HDL cholesterol as a child were 4.5 times more likely to develop adult dyslipidemia independently of baseline BMI and change in BMI after 27 years of follow-up.12 Data from the present study build on these findings by demonstrating that non-HDL cholesterol predicts not just total LDL cholesterol but also LDL particle concentration and size. A non-HDL cholesterol cut-point of <120 mg/dL has been suggested to be acceptable in children.11,12,23 In the present study, this cut-point reflected increased LDL particle concentration and size in the white youth and highlights the increased risk of dyslipidemia that falls below traditional cut-points for high cholesterol. According to recent national clinical practice guidelines,23 53% of white youth in this cohort had borderline (35%) or high (18%) cholesterol, whereas 65% had non-HDL cholesterol greater than the recommended <120 mg/dL and 35% were classified in the high range of ≥145 mg/dL. Interestingly, we found a higher non-HDL cholesterol cut-point of <145 mg/dL was more appropriate in the black children. This may reflect the overall lower LDL cholesterol concentrations of the black children and the tendency for lower total LDL particles.
In the current study, the presence of elevated small dense LDL concentration and smaller LDL particle size was related to both TG/HDL ratio and adiposity. Dyslipidemia associated with adiposity is shown in a number of studies in youth,1,2 and the present data are supportive that adiposity is a driving force in adverse lipid profiles in youth. Our data also support our previous findings that abdominal adiposity along with whole-body adiposity plays an important role in determining lipid profiles in both black and white children.3,20 Waist circumference and visceral adiposity explained a similar amount of variation in small LDL concentration and LDL size as BMI, BMI percentile, percentage body fat, or fat mass. Our data are consistent with those from the Bogalusa Heart Study, where waist circumference showed the strongest association with pediatric lipid profiles in 2996 children and adolescents compared with a number of other measures of general and regional adiposity.24 We have also demonstrated that the inclusion of waist circumference to BMI significantly improves the prediction of the lipid component of the metabolic syndrome in overweight children.20 Moreover, we found LDL particle size and concentrations differed significantly between children above and below the 90th percentile for waist circumference.3 Thus, the present study suggests that waist circumference, as well as BMI, when combined with TG/HDL cholesterol ratio is a useful predictor of small dense LDL.
Acknowledgments
Supported by National Institute of Child Health and Human Development (grants R01 HD-27503 and K24 HD-01357 to S.A.), Richard L. Day Endowed Chair (to S.A.), and Clinical and Translational Science Aware (UL1 RR024153 [previously M01-RR-00084]).
We express our gratitude to all the children and their parents who participated in this study, without whom science could not be advanced. We are grateful to the nursing staff of the Pediatric Clinical and Translational Research Center for their outstanding care of the participants and meticulous attention to the research, to Nancy Guerra (Children’s Hospital of Pittsburgh of UPMC) for her assistance with data collection and screening, and to Resa Stauffer (Children’s Hospital of Pittsburgh of UPMC) for her laboratory analytical contributions.
Glossary
- BMI
Body mass index
- HDL
High-density lipoprotein
- IDL
Intermediate-density lipoprotein
- LDL
Low-density lipoprotein
- ROC
Receiver operating characteristic
- TG
Triglycerides
Footnotes
The authors declare no conflicts of interest.
References
- 1.Freedman DS, Katzmarzyk PT, Dietz WH, Srinivasan SR, Berenson GS. Relation of body mass index and skinfold thicknesses to cardiovascular disease risk factors in children: the Bogalusa Heart Study. Am J Clin Nutr. 2009;90:210–6. doi: 10.3945/ajcn.2009.27525. [DOI] [PMC free article] [PubMed] [Google Scholar]
- 2.Lamb MM, Ogden CL, Carroll MD, Lacher DA, Flegal KM. Association of body fat percentage with lipid concentrations in children and adolescents: United States, 1999-2004. Am J Clin Nutr. 2011;94:877–83. doi: 10.3945/ajcn.111.015776. [DOI] [PubMed] [Google Scholar]
- 3.Burns SF, Arslanian SA. Waist circumference, atherogenic lipoproteins, and vascular smooth muscle biomarkers in children. J Clin Endocrinol Metab. 2009;94:4914–22. doi: 10.1210/jc.2009-1301. [DOI] [PMC free article] [PubMed] [Google Scholar]
- 4.Pérez-Méndez O, Torres-Tamayo M, Posadas-Romero C, Vidaure Garcés V, Carreón-Torres E, Mendoza-Pérez E, et al. Abnormal HDL subclasses distribution in overweight children with insulin resistance or type 2 diabetes mellitus. Clin Chim Acta. 2007;376:17–22. doi: 10.1016/j.cca.2006.07.003. [DOI] [PubMed] [Google Scholar]
- 5.Lamarche B, Tchernof A, Moorjani S, Cantin B, Dagenais GR, Lupien PJ, et al. Small, dense low-density lipoprotein particles as a predictor of the risk of ischemic heart disease in men. Prospective results from the Québec Cardiovascular Study. Circulation. 1997;95:69–75. doi: 10.1161/01.cir.95.1.69. [DOI] [PubMed] [Google Scholar]
- 6.Stampfer MJ, Krauss RM, Ma J, Blanche PJ, Holl LG, Sacks FM, et al. A prospective study of triglyceride level, low-density lipoprotein particle diameter, and risk of myocardial infarction. JAMA. 1996;276:882–8. [PubMed] [Google Scholar]
- 7.Hannon TS, Bacha F, Lee SJ, Janosky J, Arslanian SA. Use of markers of dyslipidemia to identify overweight youth with insulin resistance. Pediatr Diabetes. 2006;7:260–6. doi: 10.1111/j.1399-5448.2006.00199.x. [DOI] [PubMed] [Google Scholar]
- 8.Burns SF, Lee SJ, Arslanian SA. In vivo insulin sensitivity and lipoprotein particle size and concentration in black and white children. Diabetes Care. 2009;32:2087–93. doi: 10.2337/dc09-0380. [DOI] [PMC free article] [PubMed] [Google Scholar]
- 9.Kang HS, Gutin B, Barbeau P, Litaker MS, Allison J, Le NA. Low-density lipoprotein particle size, central obesity, cardiovascular fitness, and insulin resistance syndrome markers in obese youths. Int J Obes Relat Metab Disord. 2002;26:1030–5. doi: 10.1038/sj.ijo.0802045. [DOI] [PubMed] [Google Scholar]
- 10.Weiss R, Otvos JD, Sinnreich R, Miserez AR, Kark JD. The triglyceride to high-density lipoprotein-cholesterol ratio in adolescence and subsequent weight gain predict nuclear magnetic resonance-measured lipoprotein subclasses in adulthood. J Pediatr. 2011;158:44–50. doi: 10.1016/j.jpeds.2010.07.002. [DOI] [PubMed] [Google Scholar]
- 11.Li C, Ford ES, McBride PE, Kwiterovich PO, McCrindle BW, Gidding SS. Non-high-density lipoprotein cholesterol concentration is associated with the metabolic syndrome among US youth aged 12-19 years. J Pediatr. 2011;158:201–7. doi: 10.1016/j.jpeds.2010.07.050. [DOI] [PubMed] [Google Scholar]
- 12.Srinivasan SR, Frontini MG, Xu J, Berenson GS. Utility of childhood non-high-density lipoprotein cholesterol levels in predicting adult dyslipidemia and other cardiovascular risks: the Bogalusa Heart Study. Pediatrics. 2006;118:201–6. doi: 10.1542/peds.2005-1856. [DOI] [PubMed] [Google Scholar]
- 13.Frontini MG, Srinivasan SR, Xu J, Tang R, Bond MG, Berenson GS. Usefulness of childhood non-high density lipoprotein cholesterol levels versus other lipoprotein measures in predicting adult subclinical atherosclerosis: the Bogalusa Heart Study. Pediatrics. 2008;121:924–9. doi: 10.1542/peds.2007-1472. [DOI] [PubMed] [Google Scholar]
- 14.Arslanian SA, Saad R, Lewy V, Danadian K, Janosky J. Hyperinsulinemia in African-American children: Decreased insulin clearance and increased insulin secretion and its relationship to insulin sensitivity. Diabetes. 2002;51:3014–9. doi: 10.2337/diabetes.51.10.3014. [DOI] [PubMed] [Google Scholar]
- 15.Otvos JD, Jeyarajah EJ, Bennett DW, Krauss RM. Development of a proton nuclear magnetic resonance spectroscopic method for determining plasma lipoprotein concentrations and subspecies distributions from a single, rapid measurement. Clin Chem. 1992;38:1632–8. [PubMed] [Google Scholar]
- 16.Bao W, Srinivasan SR, Wattigney WA, Berenson GS. Persistence of multiple cardiovascular risk clustering related to syndrome X from childhood to young adulthood. The Bogalusa Heart Study. Arch Intern Med. 1994;154:1842–7. [PubMed] [Google Scholar]
- 17.Prado KB, Shugg S, Backstrand JR. Low-density lipoprotein particle number predicts coronary artery calcification in asymptomatic adults at intermediate risk of cardiovascular disease. J Clin Lipidol. 2011;5:408–13. doi: 10.1016/j.jacl.2011.07.001. [DOI] [PubMed] [Google Scholar]
- 18.Blake GJ, Otvos JD, Rifai N, Ridker PM. Low-density lipoprotein particle concentration and size as determined by nuclear magnetic resonance spectroscopy as predictors of cardiovascular disease in women. Circulation. 2002;106:1930–7. doi: 10.1161/01.cir.0000033222.75187.b9. [DOI] [PubMed] [Google Scholar]
- 19.Bacha F, Saad R, Gungor N, Janosky J, Arslanian SA. Obesity, regional fat distribution, and syndrome X in obese black versus white adolescents: race differential in diabetogenic and atherogenic risk factors. J Clin Endocrinol Metab. 2003;88:2534–40. doi: 10.1210/jc.2002-021267. [DOI] [PubMed] [Google Scholar]
- 20.Lee S, Bacha F, Arslanian SA. Waist circumference, blood pressure, and lipid components of the metabolic syndrome. J Pediatr. 2006;149:809–16. doi: 10.1016/j.jpeds.2006.08.075. [DOI] [PubMed] [Google Scholar]
- 21.Freedman DS, Bowman BA, Otvos JD, Srinivasan SR, Berenson GS. Levels and correlates of LDL and VLDL particle sizes among children: the Bogalusa Heart Study. Atherosclerosis. 2000;152:441–9. doi: 10.1016/s0021-9150(99)00495-5. [DOI] [PubMed] [Google Scholar]
- 22.Srinivasan SR, Segrest JP, Elkasabany AM, Berenson GS. Distribution and correlates of lipoproteins and their subclasses in black and white young adults. The Bogalusa Heart Study. Atherosclerosis. 2001;159:391–7. doi: 10.1016/s0021-9150(01)00514-7. [DOI] [PubMed] [Google Scholar]
- 23.US Department of Health and Human Services, National Heart, Lung, and Blood Institute. Expert Panel on Integrated Guidelines for Cardiovascular Health and Risk Reduction in Children and Adolescents. [April 10, 2012]; http://www.nhlbi.nih.gov/guidelines/cvd_ped/index.htm.
- 24.Freedman DS, Serdula MK, Srinivasan SR, Berenson GS. Relation of circumferences and skinfold thicknesses to lipid and insulin concentrations in children and adolescents: the Bogalusa Heart Study. Am J Clin Nutr. 1999;69:308–17. doi: 10.1093/ajcn/69.2.308. [DOI] [PubMed] [Google Scholar]