

Abstract
Purpose
The most common genetic lesions in pancreatic ductal adenocarcinoma (PDAC) have been identified. However, significant gaps still exist in our understanding of how such genetic alterations act in concert to induce PDAC development. In this study, we investigated the mechanism of tumorigenic transformation in the immortalized human pancreatic ductal epithelial (HPDE) cell line by sequentially introducing PDAC signature alterations into this cell line.
Experimental Design
The phenotype for stable expression of mutant K-ras, Her2, p16/p14shRNA, and Smad4shRNA in HPDE cells was examined by assays for cell proliferation, migration, invasion; soft agar; and orthotopic tumorigenesis. The mechanisms of tumorigenic transformation were further explored by gene expression profiling and pathway analyses.
Results
The transformed cells exhibited enhanced proliferation, migration, and invasion; displayed anchorage-independent growth in soft agar; and grew orthotopic tumors with some histopathological features of PDAC. We found that Smad4 played key roles in the tumorigenic transformation of HPDE cells. We further found that MDM2 and Bmi-1 were overexpressed in the tumorigenic HPDE cells and that Bmi-1 overexpression was regulated by Smad4. Ingenuity Pathway Analysis software analysis of microarray data revealed that dysregulation of integrin-linked kinase (ILK) signaling and the cell cycle were the most significant changes involved in tumorigenic transformation. Altogether, this cell culture model closely recapitulated human pancreatic carcinogenesis from gene lesions, activation of specific signaling pathways, and some histopathological features.
Conclusion
The combination of activated K-ras and Her2 with inactivated p16/p14 and Smad4 was sufficient and essential to transform HPDE cells, thus revealing the potential tumorigenic mechanism.
Keywords: human pancreatic ductal adenocarcinoma, tumorigenic transformation, human pancreatic ductal epithelial cell line, Smad4
Introduction
The development of PDAC is a multistep process resulting from accumulation of genetic lesions in normal cells. The most common genetic alteration in PDAC, and one of the earliest identified, is the K-ras mutation (90%), which plays a critical initiating role in this disease (1-4). Her2 overexpression (70%) is frequently found in well-differentiated PDAC as well as in early-stage precancerous lesions and correlates with shorter survival and worse prognosis (5, 6). Inactivation of p16 in PDAC occurs through homozygous deletion (40%), an intragenic mutation coupled with loss of the second allele (40%), and promoter hypermethylation (15%), resulting in increased phosphorylation of the Rb and cell cycle progression through the G1 phase into the S phase (7, 8). p53 inactivation (50%-75%) and p14 deletion (40%) are also frequently found (9, 10). Deletion of p14 and p53 mutation coexist in ~40% of PDAC cases (1, 8). Inactivation of Smad4 has been found in approximately 55% of PDAC cases (10) and is detected only in later-stage pancreatic intraepithelial neoplasia (PanINs) and PDAC, indicating that loss of Smad4 is a late genetic event in PDAC (11). Studies based on PDAC mouse models have revealed the role of several of the most common genetic mutations in PDAC, including Smad4 inactivation, as key steps in the progression of PDAC (12-15). However, the role of, and the mechanisms associated with, activation of K-ras and Her2 and inactivation of p16/p14 and Smad4 in human pancreatic carcinogenesis are still not well understood.
The cell culture model remains an important complement to the mouse model and is an important tool in the study of human cancer, but few human pancreatic cell culture transformation models have been reported to date (16). Tsao’s group first demonstrated that expression of mutant K-RasG12V in the human papilloma virus (HPV)-16 E6E7 immortalized human pancreatic ductal epithelial (HPDE) cell line induced only weak tumorigenesis in the orthotopic mouse model, with poorly differentiated tumor formation in 2 of 5 SCID mice (17). The study in our laboratory showed that mutant K-ras alone failed to induce tumor growth in NOD/SCID mice (J. Niu, unpublished data), suggesting that K-ras alone may not be sufficient for the development of PDAC and that additional genetic alterations are required to induce fully malignant transformation of the HPDE cell line. Another recent study described a complete malignant transformation cell model using an hTERT-immortalized normal human pancreatic ductal nestin–expressing cell line through sequential introduction of a combination of E6E7, K-rasG12D, and the SV40 small t (st) antigen into this cell line (18). These cells become transformed as they formed colonies in soft agar and developed into subcutaneous tumors in nude mice. However, in this model, the frequently found mutations in human PDAC were not utilized to cooperate with K-ras to induce tumorigenic transformation.
In this study, we investigated the mechanisms of tumorigenic transformation by sequential introduction of activated K-ras and Her2 and p16/p14 and Smad4shRNA to the HPV E6E7 oncoprotein–immortalized HPDE cells. Analysis of gene expression showed that activation of several signaling pathways, such as integrin-linked kinase (ILK), cell cycle, and Smad4-regulated expression of Bmi-1, is significantly involved in tumorigenic transformation.
Materials and Methods
Cell lines and cell culture
The human pancreatic ductal epithelial cell line HPDE/E6E7 was obtained from Dr. Ming-Sound Tsao (Ontario Cancer Institute at Princess Margaret Hospital, University Health Network, and Toronto, ON, Canada). HPDE/E6E7 cells were cultured at 37°C in 5% CO2 in keratinocyte serum-free medium (Invitrogen Life Technologies, Inc., Carlsbad, CA) supplemented with 50 μg/mL bovine pituitary extract (Invitrogen) and 5.0 ng/mL recombinant human EGF (Invitrogen). K-ras–expressing HPDE cell lines were cultured in a 1:1 mixture of complete keratinocyte serum-free medium and complete Dulbecco’s modified Eagle medium (Hyclone Laboratories Inc., Logan, UT) with 5% fetal bovine serum. The 293T cell line and human pancreatic cancer cell lines were grown in Dulbecco’s modified Eagle medium supplemented with 10% fetal bovine serum at 37°C in 5% CO2.
Plasmid construction, transfection, retroviral or lentiviral production, infection, and establishment of stable cell lines
Detailed methods can be found in the Supplementary Materials and Methods.
Western blot analysis
Cells were lysed in radioimmunoprecipitation assay protein lysis buffer (RIPA). A total of 50 μg of protein extracts were analyzed by western blot as described previously (19).
Ras activity assay
The activity of the Ras protein was assayed by using the Ras assay reagent (Upstate Biotechnology Inc., Lake Placid, NY) according to the manufacturer’s instructions and were performed as described previously (19).
Histological and immunohistochemical analysis
Hematoxylin and eosin (H&E) and immunohistochemical analyses were performed according to standard procedures. The H&E and immunohistochemical slides from mouse xenografts were reviewed by a pathologist (H.W.), who classified the tumor type and characterized the histological features. A representative field was photographed and shown with use of an Olympus BX-51TF microscope.
Microarray analysis and Ingenuity Pathway Analysis signaling pathway analyses
DNA microarray experiments and statistical analyses were performed by the Cancer Genomics Core Laboratory at the University of Texas MD Anderson Cancer Center with the Whole Human Genome Oligo Microarray from Agilent Technologies (Santa Clara, CA) according to the manufacturer’s instructions. The changes of signaling pathways and biological functions were analyzed with use of Ingenuity Pathway Analysis (IPA) software (Ingenuity® Systems, www.ingenuity.com) (Ingenuity System Inc, Redwood City, CA). Both core analysis and comparison analysis were performed. The significance of the biological functions and the canonical pathways was tested by the Fisher exact test on the basis of the number of genes analyzed that mapped to a biological function and pathway in the IPA knowledge base. The results were shown by the –log (P value) of each pathway or biological function mapped to a pathway or biological function, respectively, in the IPA knowledge base.
Statistical analyses
All statistical analyses were performed with use of SPSS or Excel software. The significance of the data was determined by the Student t test and Fisher exact test. P < 0.05 was considered significant. For error bars in all experiments, standard deviation (s.d.) was calculated from three independent experiments, and values represent mean ± s.d.
Results
Stable expression of mutant K-ras, Her2, p16/p14shRNA, and Smad4shRNA in E6E7 immortalized in the HPDE cell line
We sequentially introduced five of the most commonly identified genetic alterations in PDAC—activated K-ras and Her2 and inactivated p16 or p16/p14 and Smad4—by shRNA knockdown in HPDE cells via retroviral or lentiviral transduction based on the use of various drugs or green fluorescent protein (GFP) fluorescence-activated cell sorting to purify the antibiotic-resistant or GFP-positive cell population (Fig. 1A). The expression of K-ras4AG12V and K-ras4BG12V in HPDE cell lines induced increased Ras activity 1.8- to 2.2-fold and increased the RasG12V level compared with vector control cells in the Ras activity assay and Western blotting (Fig. 1B), suggesting a near endogenous level of K-ras expression in our HPDE cell culture–based model. However, the expression level of mutant K-ras in HPDE cells was lower compared with that in a panel of human PDAC cell lines (Supplementary Fig. S1A). Stable expression of Her2, p16/p14shRNA, and Smad4shRNA in HPDE/K-ras (HPDE/K-ras4BG12V) cells was confirmed by Western blotting, which also was used to demonstrate overexpression of Her2 in transduced HPDE cells, at levels similar to those in several human PDAC cell lines (Supplementary Fig. S1B), as well as decreased expression of p16, p14, and Smad4 in these transduced cells (Fig. 1C). The reduction of p53 by HPV E6 oncoprotein-mediated degradation could not be determined since HPDE was established as a cell line by expression on E6E7 oncoproteins. The function of p53 was compromised in HPDE, as evidenced by its failure to induce p21WAF1 expression after γ-irradiation (Supplementary Fig. S1C). The results suggested that p53 was inactivated, and this conclusion was consistent with that of Tsao’s group, who found that p53 is not functional in the HPDE/E6E7 cell line (17). We thus successfully established stable cell lines with expression of mutant K-ras and Her2 and knockdown of p16INK4A/p14ARF and Smad4 tumor suppressor genes in immortalized HPDE cells.
Fig. 1.
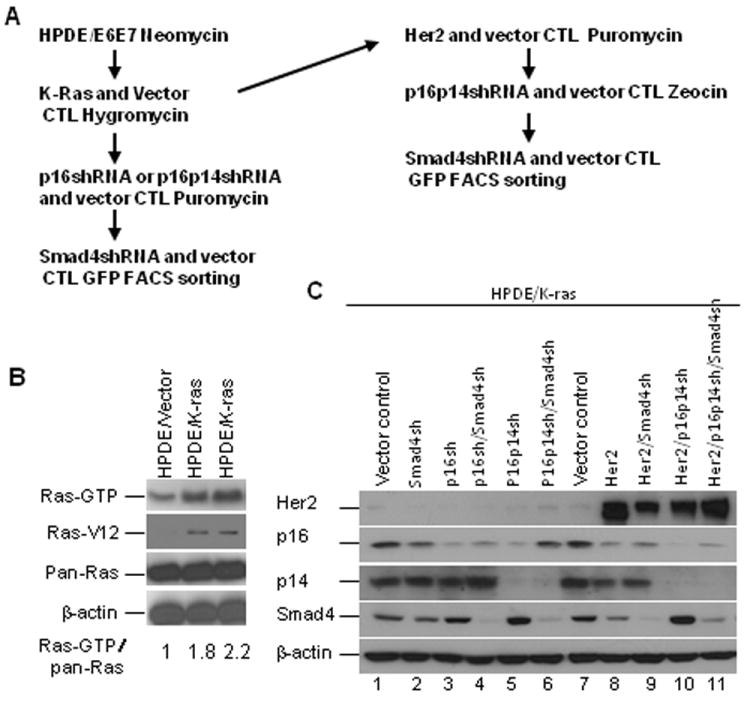
Stable expression of K-rasG12V, Her2, p16/p14shRNA, and Smad4shRNA in E6E7 immortalized human pancreatic ductal epithelial (HPDE) cells. A, The strategy for introducing genetic alterations into HPDE cell lines. B, Stable expression of K-Ras4A and 4BG12V in the HPDE cell lines. Stable K-rasG12V expression in the HPDE cells was identified by the Ras activity assay and the expression levels of RasG12V and total Ras by western blot. C, Stable expression of the p16shRNA, p16/p14shRNA, Her2, and Smad4shRNA in HPDE/K-ras cell lines. The stable cell lines were identified by western blot of the expression of Her2, p16, p14, and Smad4.
Activation of K-ras and Her2 and inactivation of p16/p14 and Smad4 tumor suppressor genes induced increased cell migration and invasion
To determine whether activation of K-ras and Her2 and inactivation of p16/p14 and Smad4 induce cell migration and invasion in vitro, migration and Matrigel invasion assays were performed. The results showed that cell lines HPDE/K-ras/Her2/p16p14shRNA, HPDE/K-ras/Her2/p16p14shRNA/Smad4shRNA, and most of HPDE cell lines with Smad4 silencing exhibited increased cell migration and invasion ability compared with other control cells (Supplementary Fig. S2; P < 0.05). Surprisingly, the HPDE/K-ras/p16shRNA cells exhibited increased cell migration and invasion compared with the control HPDE/K-ras cell line and HPDE/K-ras/p16shRNA/Smad4shRNA cells (Supplementary Fig. S2; P < 0.05). These results suggested that activation of K-ras and expression of Her2 and knocking down of p16/p14 or Smad4 initiated migration and invasion potential in HPDE cells before the emergence of the tumorigenic phenotype as observed in HPDE/K-ras/Her2/p16p14shRNA/Smad4shRNA.
Cell growth properties and anchorage-independent cell growth of HPDE cell lines with stable expression of mutant K-ras, Her2, p16/p14shRNA, and Smad4shRNA
Since unchecked cell growth is a hallmark of cancer, we examined the growth characteristics of these HPDE cells. The cell lines HPDE/K-ras/Her2/p16p14shRNA and HPDE/K-ras/Her2/p16p14shRNA/ Smad4 shRNA demonstrated a significantly elevated cell growth rate and a higher percentage of cells in the S phase in a cell cycle analysis compared with other control cell lines (Fig. 2A, P < 0.05; Fig. 2B, P < 0.05 on days 5 and 7). The HPDE/K-ras/p16p14shRNA/Smad4shRNA cell line also displayed a higher percentage of cells in the S phase (26.3%) compared with its control cell lines (Fig. 2B). Knockdown of p16 and p14 simultaneously induced a higher cell proliferation rate than did knockdown of p16 alone, when comparing the HPDE/K-ras/p16p14shRNA cell line with the HPDE/K-ras/p16shRNA cell line, or comparing the HPDE/K-ras/p16p14shRNA/Smad4shRNA cell line with the HPDE/K-ras/p16shRNA/Smad4shRNA cell line (Fig. 2A; P < 0.05). Our results indicated that the loss of p14 and p16 simultaneously gives cells an additional growth advantage compared with the loss of p16 alone. These results suggest that p16/p14 suppresses mitogenic stimulation of K-ras– and Her2-induced cell proliferation and that loss of p16/p14 releases the constraint on proliferation, thus inducing increased cell proliferation in HPDE cells. Together, our results suggested that HPDE cell lines with expression of mutant K-ras and Her2 and knockdown p16/p14 and Smad4, increased the ability for cell proliferation.
Fig. 2.
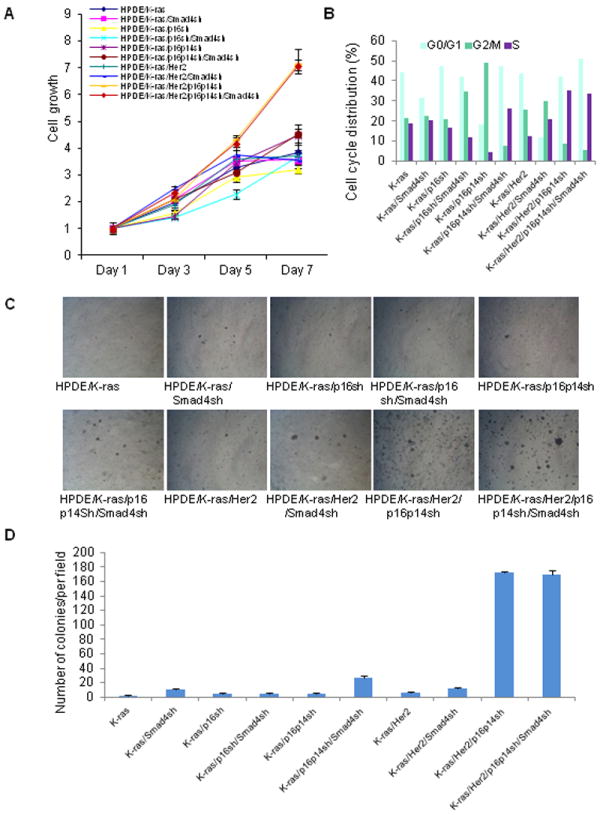
Cell growth properties and anchorage-independent growth in soft agar of HPDE cell lines with expression of mutant K-ras, Her2, p16/p14shRNA, and Smad4shRNA. A, The cell growth of HPDE cell lines in MTT assay. P < 0.05 for HPDE/K-ras/Her2/p16p14sh and HPDE/K-ras/Her2/p16p14sh/Smad4sh versus all other control HPDE cell lines at days 5 and 7. P < 0.05 for cell line HPDE/K-ras/p16p14sh versus cell line HPDE/K-ras/p16sh and cell line HPDE/K-ras/p16p14sh/Smad4sh versus cell line HPDE/K-ras/p16sh/Smad4sh at days 5 and 7. B, Cell cycle analysis of HPDE cell lines. The percentage of cells in each phase of the cell cycle is shown from a representative experiment. C, Representative field of soft agar for each cell line. D, Quantification of colonies per field in soft agar. P < 0.05 for cell line HPDE/K-ras/Her2/p1p14sh and HPDE/K-ras/Her2/p16p14sh/Smad4sh versus all other cell lines. P < 0.05 for cell line HPDE/K-ras/p16p14sh/Smad4sh versus cell lines HPDE/K-ras, HPDE/K-ras/Smad4sh, and HPDE/K-ras/p16shRNA, HPDE/K-ras/p16shRNA/Smad4sh, and HPDE/K-ras/p16p14shRNA.
To investigate whether the HPDE cells had acquired the ability of anchorage-independent growth, one of hallmarks of in vitro cell transformation, we performed soft agar assays to determine the transformation potential of mutant K-ras and Her2 and of knocked down p16/p14 and Smad4 in HPDE cells. The results demonstrated that the two cell lines HPDE/K-ras/Her2/p16p14shRNA and HPDE/K-ras/Her2/p16p14shRNA/Smad4shRNA grew significantly more and larger colonies compared with all other control cell lines (Fig. 2C and 2D; P < 0.05). We also found that cell line HPDE/K-ras/p16p14shRNA/Smad4shRNA grew more colonies than did other control cell lines (Fig. 2C and 2D; P < 0.05). These results suggest that the combination of expressed mutant K-ras and Her2 and knocked down p16/p14 with or without knocked down Smad4 induced anchorage-independent growth in the soft agar assay and was sufficient to transform immortalized HPDE cells in vitro.
Activation of K-ras and Her2 and inactivation of p16/p14 and Smad4 in HPDE cell line induced tumorigenesis in orthotopic mouse model
The tumorigenic potential of HPDE cells in vivo was assessed by an orthotopic tumorigenesis assay in non-obese diabetic/severe combined immunodeficient (NOD/SCID) mice. Only cells from cell line HPDE/K-ras/Her2/p16p14shRNA/Smad4shRNA formed tumors in 5 of 5 mice, as shown by in vivo bioluminescence imaging (Fig. 3A); when cells from other cell lines were injected into the mice, no tumors were found even after 6 months of observation (Supplementary Table S1). At 8 weeks after HPDE cell injection, mice started growing tumors and were euthanized at 12 to 20 weeks. Histological analysis of the tumors revealed a moderately to poorly differentiated pancreatic ductal adenocarcinoma phenotype with a large area of undifferentiated carcinoma (Fig. 3B). Metastases to other organs such as liver or spleen were not observed in the mice either by gross inspection of the mouse organs or by hematoxylin and eosin (H&E) staining of sections from the liver, spleen, and abdominal cavity; local invasion to adjacent abdominal wall and skeletal muscle, however, was found on H&E staining. The tumors had large pleomorphic nuclei and prominent nucleoli and displayed several (3-7) mitotic figures per high-powered field. As revealed by immunohistochemical analysis, the tumors expressed ductal cell marker cytokeratin-19 (CK-19) and the cell proliferation marker Ki-67 (Fig. 3B), and desmoplastic stroma was presented in some areas of the tumor masses, a hallmark feature of PDAC. These results suggested that our model mimicked the histological features of tumors from cultured human PDAC cells.
Fig. 3.
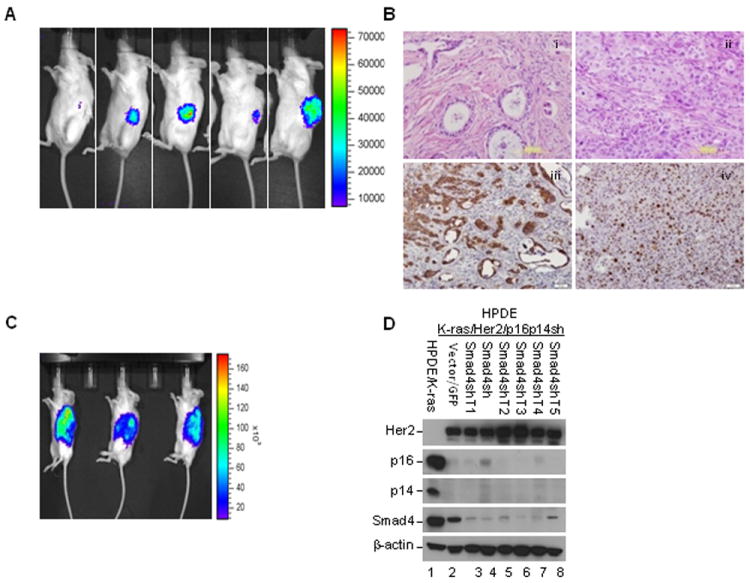
Activation of K-ras and Her2 and inactivation of p16/p14 and Smad4 in HPDE cell line induced tumorigenesis in the orthotopic mouse model. A, In vivo bioluminescence imaging of tumor growth for HPDE/K-ras/p16p14shRNA/Smad4shRNA cell line at 12 weeks after injection. B, Representative micrographs show the histopathologic features by H&E staining and the expression of cytokeratin-19 (CK-19) and Ki-67 in the tumors by immunohistochemical analysis. (i) Moderately to (ii) poorly differentiated adenocarcinoma, immunostaining of (iii) CK-19 and (iv) Ki-67. Scale bar: 100 μm. C, In vivo bioluminescence imaging of tumor growth of tumor cell line HPDE/K-ras/Her2/p16p14shRNA/Smad4shRNA T at 40 days after injection. D, Confirmation of gene expression alterations in the various tumor cell lines of HPDE/K-ras/Her2/p16p14shRNA/Smad4shRNA T isolated from orthotopic mouse tumors by Western blotting.
We successfully isolated and cultured the tumor cell lines (HPDE/K-ras/Her2/p16p14 shRNA/Smad4shRNA T) from the orthotopically xenografted tumors. When reimplanted orthotopically into the pancreas of NOD/SCID mice, these cells formed tumors in all of the animals (3/3) (Fig. 3C), and the latency of tumor development was also markedly reduced. In 40 days, huge tumors were observed in all mice. Histopathological analysis of tumors also exhibited moderately to poorly differentiated PDAC, similar to the original xenograft tumor. To validate the gene expression in HPDE tumor cell lines, we performed Western blotting and found that Her2 was overexpressed and that expression of p16, p14, and Smad4 was decreased in tumor cell lines (Fig. 3D). Thus our results confirmed the alterations of gene expression in the tumors.
Expression of cell proliferation–associated genes and activation of signaling pathway downstream of K-ras and Her2
Since transformed cells exhibited increased cell proliferation, we examined whether the expression of cell proliferation–associated genes such as cyclins were changed in the transformed cells. We found that expression levels of cyclin D1 and cyclin B1, which are involved in G1/S and G2/M cell cycle progression, respectively, were markedly elevated in the HPDE/K-ras/p16p14shRNA, HPDE/K-ras/p16p14shRNA/Smad4shRNA, the HPDE/K-ras/Her2/p16p14shRNA, and the HPDE/K-ras/Her2/p16p14shRNA/Smad4shRNA cell lines compared with other control cell lines (Fig. 4A). To determine the role of Smad4 in HPDE cell transformation, we examined the expression of c-myc and Id2 and Smad4 downstream genes associated with cell proliferation and whether this expression was changed in those transformed cells. Our results revealed that the expression of c-myc and Id2 was significantly increased in the HPDE/K-ras/p16p14shRNA, HPDE/K-ras/p16p14shRNA/Smad4shRNA, the HPDE/K-ras/Her2/ p16p14shRNA, and the HPDE/K-ras/Her2/p16p14shRNA/Smad4shRNA cell lines compared with their other control cell lines (Fig. 4A), indicating that Smad4 plays a role in the regulation of c-myc and Id2; knockdown of Smad4 increased the expression of c-myc and Id2 in the HPDE/K-ras cell line. However, in other HPDE cell lines, the increased c-myc and Id2 expression was not solely regulated by Smad4. These results suggest that increased expression of cell proliferation–associated gene cyclins c-myc and Id2 may be involved in enhanced cell proliferation and the transformation of HPDE cells.
Fig. 4.
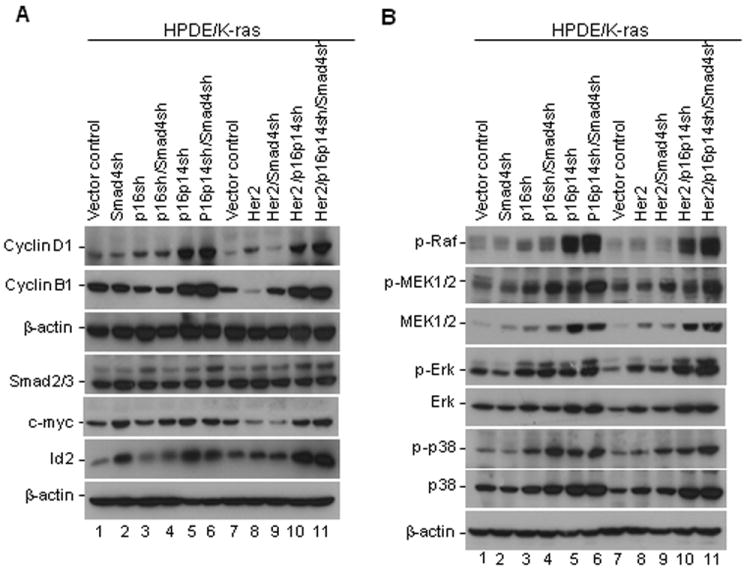
Expression of cell proliferation–associated genes and activation of signaling pathway downstream of K-ras and Her2 in HPDE cell lines. A, Expression of cyclin D1, cyclin B, Smad2/3, c-Myc, and Id2 in HPDE cell lines was detected by Western blotting. B, Activation of MAPK pathways in HPDE/K-ras cell lines. The expression of phosphorylated and total proteins of RAF, MEK, ERK, p38, and JNK was detected in HPDE/K-ras cell lines by Western blotting.
To dissect the mechanism of transformation of HPDE cells and explore the pathways critical for the transformation, we first investigated the three most common downstream signaling pathways of K-ras and Her2: RAF/MEK/ERK, PI3K/AKT, and RalGDS/Ral. We found that expression levels of the phosphorylated proteins of RAF, MEK, ERK, and p38, as well as the respective total protein levels of MEK, ERK, and p38, were enhanced in the cell lines HPDE/K-ras/p16p14shRNA and HPDE/K-ras/p16p14shRNA/ Smad4shRNA, and HPDE/K-ras/Her2/p16p14shRNA and HPDE/K-ras/Her2/p16p14shRNA/Smad4shRNA compared with their other control cell lines (Fig. 4B). Activation of the ERK and p38 in transformed HPDE cells suggested that activation of K-ras and Her2 downstream effectors in the MAPK pathway may play a role in the malignant transformation of HPDE cells. We found weak AKT activity in cell lines HPDE/K-ras/Her2/p16p14shRNA and HPDE/K-ras/Her2/p16p14shRNA/Smad4shRNA, but higher AKT activity in the HPDE/K-ras/p16shRNA cell line than in all other cell lines (data not shown). There was no difference for RalA and RalB activity among the various cell lines (data not shown). These findings suggest that the downstream signaling pathways of K-ras and Her2—RAF/MEK/ERK and PI3K/AKT—are activated in various HPDE sublines.
Alterations of gene expression for transformation in microarray analysis
To better understand the molecular mechanisms of human pancreatic cell transformation and to gain further mechanistic insight into the detailed molecular alterations involved in the transformation, we performed a microarray gene expression analysis. The top 10 most significantly upregulated and downregulated genes for cell line HPDE/K-ras/Her2/p16p14shRNA/Smad4shRNA versus cell line HPDE/K-ras/Her2/p16p14shRNA in microarray analysis are shown in Supplementary Table S2A. We confirmed the elevated expression of oncogene MDM2 in transformed cell line HPDE/K-ras/Her2/p16p14shRNA/Smad4shRNA in cDNA microarray data by Western blotting (Fig. 5A). The results demonstrated that the MDM2 protein was highly expressed in the cell lines with knockdown of p14 in the Western blot, thus confirming the previous finding of regulation of MDM2 by p14 (20), but the p53 level was not affected by MDM2 (Fig. 5A). Cell line HPDE/ K-ras/p16shRNA/Smad4shRNA also had increased MDM2 expression (Fig. 5A). In addition, we found that MDM2 was overexpressed in 9 (75%) of 12 pancreatic cancer cell lines compared with levels in immortalized pancreatic cell lines (Fig. 5B). These results suggest that MDM2 may play a role in pancreatic cell transformation and tumorigenesis. To determine the mechanism by which MDM2 expression is elevated in HPDE cells with p14 knockdown and HPDE cells expressing 16shRNA/Smad4shRNA, we analyzed MDM2 mRNA expression levels and stability by quantitative polymerase chain reaction (qPCR) using the total RNA from various time points of actinomycin D–treated cells. Results showed that MDM2 mRNA stability was not altered in these cells but that the levels of MDM2 mRNA were increased in HPDE/K-ras/p16 shRNA, HPDE/K-ras/p14p16shRNA, and HPDE/K-ras/p16shRNA/Smad4shRNA (Fig. 5C and 5D). Our findings suggest that MDM2 expression is primarily regulated at transcription.
Fig. 5.
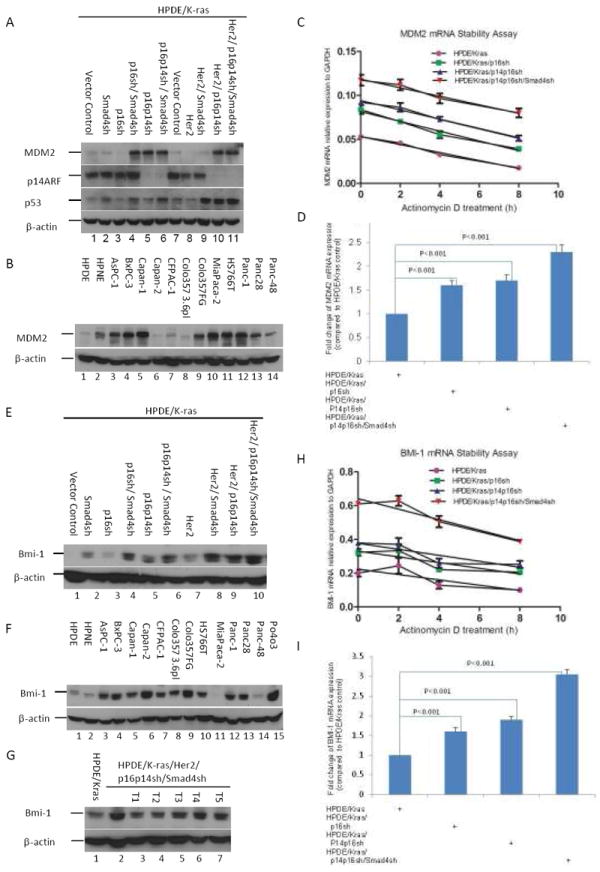
Confirmation of gene expression change in cDNA microarray analysis. A, Expression of MDM2 in various HPDE cells as indicated by western blotting. B, Expression of MDM2 in human pancreatic cancer cell lines determined by western blotting. C, Quantitative RT-PCR analysis of MDM2 was performed with use of total RNA isolated from actinomycin D–treated (10 μg/mL) HPDE/Kras, HPDE/Kras/p16sh, HPDE/Kras/p14p16sh, and HPDE/Kras/p14p16sh/Smad4sh cells at indicated time points. D, Quantitative PCR data for expression of MDM2 mRNA was normalized by GAPDH and statistically analyzed by using a GraphPad Prism 5. Error bars represent ± standard deviation (SD) from the data of three experiments. P values are indicated. E, Expression of Bmi-1 by western blotting in 5 tumorigenic HPDE cell lines derived tumors induced from cell line HPDE/K-ras/Her2/p16p14 shRNA/Smad4shRNA. F, Expression of Bmi-1 in various HPDE cell lines as indicated by Western blotting with the HPDE/K-ras cell line used as a control. G, Expression of Bmi-1 in human pancreatic cancer cell lines by Western blotting with the HPDE cell line used as a control. H, Quantitative RT-PCR analysis of Bmi-1 was performed with use of total RNA isolated from actinomycin D–treated (10 μg/mL) HPDE/Kras, HPDE/Kras/p16sh, HPDE/Kras/p14p16sh, and HPDE/Kras/ p14p16sh/Smad4sh cells at indicated time points. I, Quantitative PCR data for expression of Bmi-1 mRNA was normalized by GAPDH and statistically analyzed with use of a GraphPad Prism 5. Error bars represent ± standard deviation (SD) from the data of three experiments. P values are indicated.
We found that Bmi-1, a putative polycomb oncogene, was overexpressed in HPDE/K-ras/Her2/p16p14shRNA/Smad4shRNA cells on microarray analysis. We found that knockdown of Smad4 enhanced expression of the Bmi-1 protein in HPDE cells (Fig. 5E). We also found that Bmi-1 was markedly overexpressed in 11 (85%) of 13 PDAC cell lines and in HPDE tumorigenic cell lines compared with the very low level in HPDE and HPDE/K-ras cell lines, respectively (Fig. 5F and 5G). Together, these results suggest that Smad4-regulated Bmi-1 may play an important role in the transformation of HPDE cells. To determine how Bmi-1 expression is upregulated by Smad4 knockdown, we analyzed Bmi-1 mRNA levels and stability by qPCR by using the total RNA from various time points of actinomycin D–treated cells. Our results show that Bmi-1 mRNA stability is not changed in these cells, but the levels of Bmi-1 mRNA are increased in HPDE cells with K-ras/p14p16shRNA and in HPDE/K-ras/Smad4shRNA cells (Fig. 5H and 5I), suggesting that Bmi-1 expression is mainly regulated at transcription. The other Smad4-regulated genes that we found and validated were bone morphogenetic protein 7 (BMP7) and growth factor receptor-bound protein 10 (GRB10) (Supplementary Fig. S3). In K-ras– and Her2-expressing cell lines, knockdown of Smad4 increased the expression of BMP7 (Supplementary Fig. S3A), and BMP7 was highly overexpressed in 9 (64%) of 14 pancreatic cancer cell lines compared with the lower level in the control HPDE cells (Supplementary Fig. S3B). The results showed that knockdown of Smad4 reduced the mRNA expression level of GRB10 genes on real-time PCR analysis (Supplementary Fig. S3C). GRB10 is an adapter protein that interacts with several mitogenic receptor tyrosine kinases, including the insulin and insulin-like growth factor-I receptor (21). Overexpression of some isoforms of GRB10 inhibits tyrosine kinase activity and induces growth suppression (21). We thus confirmed the presence of several differentially expressed genes in the transformed cell lines compared with control cells.
The alterations of signaling pathway for transformation
To explore the signaling pathway alterations that are critical for the transformation of pancreatic ductal cells, we performed an IPA signaling pathway analysis of microarray data. The most significant alterations of biological functions for the HPDE/K-ras/Her2/p16p14shRNA/Smad4shRNA cells versus the HPDE/K-ras/Her2/p16p14shRNA cells were DNA replication, recombination, and repair, as well as cellular movement, death, growth, and proliferation (Fig. 6A). The most significant signaling pathway alterations were ILK signaling, cell cycle G2/M DNA damage checkpoint for cell line HPDE/K-ras/Her2/p16p14shRNA/Smad4shRNA versus HPDE/K-ras, and cell cycle G1/S checkpoint regulation for cell line HPDE/K-ras/Her2/p16p14shRNA/ Smad4shRNA versus HPDE/K-ras/Her2/p16p14shRNA (Fig. 6B). In conclusion, the results from IPA signaling pathways analysis suggested that abnormal ILK signaling and cell cycle dysregulation were most significantly associated with transformation of human pancreatic ductal epithelial cells.
Fig. 6.
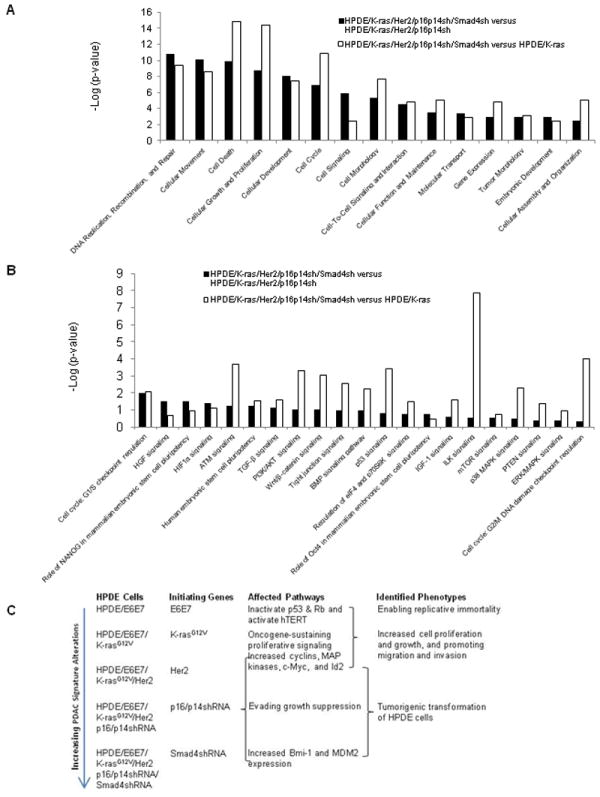
Ingenuity Pathway Analysis (IPA) signaling pathway of microarray data and the proposed model for transformation of the HPDE cell line. A, IPA canonical signaling pathway analysis for transformation. Bar indicates significance. The length of the bar indicates only that the differentially expressed proteins are related to this pathway but does not indicate upregulation or downregulation of the pathway. B, IPA biological function analysis for transformation. C, Proposed model for transformation of the HPDE cell line.
Discussion
In this study, we demonstrated the mechanism of tumorigenic transformation of HPDE cells by sequential introduction of activated K-ras and Her2 with p16/p14 and Smad4 shRNAs, the most frequently found alterations in human PDAC. To our knowledge, this is the first study in which a combination of the most common genetic alterations in human PDAC induced a tumorigenic transformation of HPDE, a key difference between this model and other models (22-24). Histological analysis of the tumors revealed moderately or poorly differentiated PDAC, characteristic of the tumors formed by cultured human PDAC cell lines with desmoplastic stroma in some areas of PDAC. No metastasis was detected in other mouse organs, suggesting that additional genetic or epigenetic changes may be necessary to acquire a metastasis phenotype. Thus, our model recapitulates human pancreatic carcinogenesis from gene lesion, activation of specific signaling pathway, and some histopathological features of PDAC.
Recent advancements in human cell culture transformation models have demonstrated the malignant transformation of a variety of normal human cells after the introduction of a limited number of genetic alterations (22-24). The cancer biology of the murine and human is different (16). Malignant transformation is more difficult in human cells than in rodent cells because more genetic alterations are required in human cells than in rodent cells (25). At least 4-6 major genetic alterations, including disruption of Rb, p53, and telomerase, mitogenic stimulation such as that associated with Ras, and angiogenesis, are required to transform human cells, which is consistent with the multistep process of PDAC development resulting from the sequential accumulation of genetic lesions in normal cells (26).
However, one weakness of our study is that a single starting cell line, HPDE, was used to generate all of the different cell lines expressing various combinations of PDAC signature alterations. We would also like to point out that HPDE is one of two existing immortalized, nontumorigenic human pancreatic cell lines. Furthermore, it is the only pancreatic ductal epithelial cell line. The other difference involves using E6E7 genes in the immortalization step. p53 inactivation results in dysregulation of two critical controls of cell division and cell death and extensive genetic instability, as demonstrated in recent PDAC mouse models for accelerated progression of K-ras–initiated pancreatic neoplasia (27). Because E6 and E7 proteins may perturb other cellular targets in addition to pRB and p53 tumour-suppressor, the possibility remains that additional pathways may also be altered in order for tumorigenic transformation to occur.
Our results suggested that expression of K-ras and Her2 and knockdown of p16/p14 and Smad4 are sufficient and essential for tumorigenic transformation of immortalized HPDE cells and that knocking down of Smad4 plays an important role in pancreatic tumorigenesis (14, 15). One very interesting and novel finding from our study was that p14shRNA-mediated increase in MDM2 level did not seem to affect p53 stability, as shown in Fig. 5. It is unclear why the increased level of Mdm2 failed to enhance p53 degradation (28). p14 binds to MDM2 and inhibits MDM2-mediated proteasome degradation of p53 and inhibited the malignant conversion of these PanIN lesions into PDAC (20, 29). In addition, p14 also has p53-independent functions (30). This feedback regulation loop might be disrupted by E6 oncoprotein-mediated inactivation of p53 in the immortalization step for establishing HPDE cells (Supplementary Fig. 1). To determine the role of p14 in the development of PDAC, we silenced p16/INK4a and p14 individually and together.
The other novel finding was that overexpression of Bmi-1, a putative polycomb ring finger oncogene, was found in the tumorigenic HPDE cell line and in most human pancreatic cancer cell lines. We found that inactivation of Smad4 enhanced the expression of Bmi-1, which is a stem cell marker and plays a key role in regulating cell proliferation, self-renewal, senescence, survival, epithelial-to-mesenchymal transition, invasion, and metastasis (31, 32). Overexpression of Bmi-1 was found in human PanIN lesions (33), PDAC cell lines, and patient tissues and has been correlated with lymph node metastasis, patient survival, and poor prognosis (33, 34). Silencing of Bmi-1 reduced proliferation, growth, and survival of PDAC cells; in addition, it inhibited anchorage-independent colony growth in vitro and xenograft tumor growth in vivo in animal models (35). Taken together, these results indicated that inactivation of Smad4 results in dysregulation of Smad4 downstream genes such as Bmi-1, leading to Bmi-1 overexpression, which in turn may contribute to transformation and tumorigenesis of human pancreatic cells.
Our microarray data signaling pathway analysis suggests that the ILK signaling pathway, which regulates a variety of cellular reactions including proliferation, adhesion, migration, differentiation, survival, invasion, and angiogenesis, is highly enriched in the transformed cell lines. Our novel experimental cell transformation model system with genetically defined alterations would provide a necessary tool for studying the molecular mechanism of disease progression by dissecting specific oncogenic signaling pathways in human PDAC.
Supplementary Material
Translational Relevance.
Kras is the most frequently identified genetic alterations in pancreatic ductal adenocarcinoma (PDAC). Inhibiting mutated Kras directly with small-molecule inhibitors has thus far shown unsuccessful, therefore, approaches are to identify potential therapeutic targets based on the understanding the mechanisms through which the alterations act in concert to induce PDAC. Our novel in vitro experimental cell transformation model system with genetically defined alterations would provide a necessary tool for studying the molecular mechanism of disease progression and the specific altered oncogenic signaling pathways in human pancreatic ductal adenocarcinoma (PDAC). This cell model could also be used to assess the efficacy of new therapeutic agents for PDAC induced with signature mutations without the confounding interference of other unknown genetic alterations, since the orthotopic tumor derived from these cells recapitulates some of the PDAC histopathological features.
Acknowledgments
The authors thank Dr. Ming-Sound Tsao at the Ontario Cancer Institute/Princess Margaret Hospital, University of Toronto, Toronto, Ontario, Canada for providing the HPDE cell line, June Cao for providing technical support, and Tammy K. Locke for editing the manuscript.
Financial support: This research was supported in part by the National Institutes of Health through MD Anderson’s Cancer Center Support Grant CA016672 and through grants R01CA097159 and R01CA109405 (to P.J.C.).
Footnotes
Conflicts of interest: The authors declare no potential conflicts of interests.
References
- 1.Hezel AF, Kimmelman AC, Stanger BZ, Bardeesy N, Depinho RA. Genetics and biology of pancreatic ductal adenocarcinoma. Genes Dev. 2006;20:1218–49. doi: 10.1101/gad.1415606. [DOI] [PubMed] [Google Scholar]
- 2.Ying H, Kimmelman AC, Lyssiotis CA, Hua S, Chu GC, Fletcher-Sananikone E, et al. Oncogenic Kras maintains pancreatic tumors through regulation of anabolic glucose metabolism. Cell. 2012;149:656–70. doi: 10.1016/j.cell.2012.01.058. [DOI] [PMC free article] [PubMed] [Google Scholar]
- 3.Collins MA, Bednar F, Zhang Y, Brisset JC, Galban S, Galban CJ, et al. Oncogenic Kras is required for both the initiation and maintenance of pancreatic cancer in mice. J Clin Invest. 2012;122:639–53. doi: 10.1172/JCI59227. [DOI] [PMC free article] [PubMed] [Google Scholar]
- 4.Moskaluk CA, Hruban RH, Kern SE. p16 and K-ras gene mutations in the intraductal precursors of human pancreatic adenocarcinoma. Cancer Res. 1997;57:2140–3. [PubMed] [Google Scholar]
- 5.Yamanaka Y, Friess H, Kobrin MS, Buchler M, Kunz J, Beger HG, et al. Overexpression of HER2/neu oncogene in human pancreatic carcinoma. Hum Pathol. 1993;24:1127–34. doi: 10.1016/0046-8177(93)90194-l. [DOI] [PubMed] [Google Scholar]
- 6.Tomaszewska R, Okon K, Nowak K, Stachura J. HER-2/Neu expression as a progression marker in pancreatic intraepithelial neoplasia. Pol J Pathol. 1998;49:83–92. [PubMed] [Google Scholar]
- 7.Schutte M, Hruban RH, Geradts J, Maynard R, Hilgers W, Rabindran SK, et al. Abrogation of the Rb/p16 tumor-suppressive pathway in virtually all pancreatic carcinomas. Cancer Res. 1997;57:3126–30. [PubMed] [Google Scholar]
- 8.Hustinx SR, Leoni LM, Yeo CJ, Brown PN, Goggins M, Kern SE, et al. Concordant loss of MTAP and p16/CDKN2A expression in pancreatic intraepithelial neoplasia: evidence of homozygous deletion in a noninvasive precursor lesion. Mod Pathol. 2005;18:959–63. doi: 10.1038/modpathol.3800377. [DOI] [PubMed] [Google Scholar]
- 9.Bardeesy N, DePinho RA. Pancreatic cancer biology and genetics. Nat Rev Cancer. 2002;2:897–909. doi: 10.1038/nrc949. [DOI] [PubMed] [Google Scholar]
- 10.Hruban RH, Goggins M, Parsons J, Kern SE. Progression model for pancreatic cancer. Clin Cancer Res. 2000;6:2969–72. [PubMed] [Google Scholar]
- 11.Wilentz RE, Iacobuzio-Donahue CA, Argani P, McCarthy DM, Parsons JL, Yeo CJ, et al. Loss of expression of Dpc4 in pancreatic intraepithelial neoplasia: evidence that DPC4 inactivation occurs late in neoplastic progression. Cancer Res. 2000;60:2002–6. [PubMed] [Google Scholar]
- 12.Aguirre AJ, Bardeesy N, Sinha M, Lopez L, Tuveson DA, Horner J, et al. Activated Kras and Ink4a/Arf deficiency cooperate to produce metastatic pancreatic ductal adenocarcinoma. Genes Dev. 2003;17:3112–26. doi: 10.1101/gad.1158703. [DOI] [PMC free article] [PubMed] [Google Scholar]
- 13.Bardeesy N, Aguirre AJ, Chu GC, Cheng KH, Lopez LV, Hezel AF, et al. Both p16(Ink4a) and the p19(Arf)-p53 pathway constrain progression of pancreatic adenocarcinoma in the mouse. Proc Natl Acad Sci U S A. 2006;103:5947–52. doi: 10.1073/pnas.0601273103. [DOI] [PMC free article] [PubMed] [Google Scholar]
- 14.Bardeesy N, Cheng KH, Berger JH, Chu GC, Pahler J, Olson P, et al. Smad4 is dispensable for normal pancreas development yet critical in progression and tumor biology of pancreas cancer. Genes Dev. 2006;20:3130–46. doi: 10.1101/gad.1478706. [DOI] [PMC free article] [PubMed] [Google Scholar]
- 15.Izeradjene K, Combs C, Best M, Gopinathan A, Wagner A, Grady WM, et al. Kras(G12D) and Smad4/Dpc4 haploinsufficiency cooperate to induce mucinous cystic neoplasms and invasive adenocarcinoma of the pancreas. Cancer Cell. 2007;11:229–43. doi: 10.1016/j.ccr.2007.01.017. [DOI] [PubMed] [Google Scholar]
- 16.Rangarajan A, Weinberg RA. Opinion: Comparative biology of mouse versus human cells: modelling human cancer in mice. Nat Rev Cancer. 2003;3:952–9. doi: 10.1038/nrc1235. [DOI] [PubMed] [Google Scholar]
- 17.Qian J, Niu J, Li M, Chiao PJ, Tsao MS. In vitro modeling of human pancreatic duct epithelial cell transformation defines gene expression changes induced by K-ras oncogenic activation in pancreatic carcinogenesis. Cancer Res. 2005;65:5045–53. doi: 10.1158/0008-5472.CAN-04-3208. [DOI] [PubMed] [Google Scholar]
- 18.Campbell PM, Groehler AL, Lee KM, Ouellette MM, Khazak V, Der CJ. K-Ras promotes growth transformation and invasion of immortalized human pancreatic cells by Raf and phosphatidylinositol 3-kinase signaling. Cancer Res. 2007;67:2098–106. doi: 10.1158/0008-5472.CAN-06-3752. [DOI] [PubMed] [Google Scholar]
- 19.Niu J, Li Z, Peng B, Chiao PJ. Identification of an autoregulatory feedback pathway involving interleukin-1alpha in induction of constitutive NF-kappaB activation in pancreatic cancer cells. J Biol Chem. 2004;279:16452–62. doi: 10.1074/jbc.M309789200. [DOI] [PubMed] [Google Scholar]
- 20.Zhang Y, Xiong Y, Yarbrough WG. ARF promotes MDM2 degradation and stabilizes p53: ARF-INK4a locus deletion impairs both the Rb and p53 tumor suppression pathways. Cell. 1998;92:725–34. doi: 10.1016/s0092-8674(00)81401-4. [DOI] [PubMed] [Google Scholar]
- 21.Lim MA, Riedel H, Liu F. Grb10: more than a simple adaptor protein. Front Biosci. 2004;9:387–403. doi: 10.2741/1226. [DOI] [PubMed] [Google Scholar]
- 22.Elenbaas B, Spirio L, Koerner F, Fleming MD, Zimonjic DB, Donaher JL, et al. Human breast cancer cells generated by oncogenic transformation of primary mammary epithelial cells. Genes Dev. 2001;15:50–65. doi: 10.1101/gad.828901. [DOI] [PMC free article] [PubMed] [Google Scholar]
- 23.Lazarov M, Kubo Y, Cai T, Dajee M, Tarutani M, Lin Q, et al. CDK4 coexpression with Ras generates malignant human epidermal tumorigenesis. Nat Med. 2002;8:1105–14. doi: 10.1038/nm779. [DOI] [PubMed] [Google Scholar]
- 24.Vonderheide RH, Hahn WC, Schultze JL, Nadler LM. The telomerase catalytic subunit is a widely expressed tumor-associated antigen recognized by cytotoxic T lymphocytes. Immunity. 1999;10:673–9. doi: 10.1016/s1074-7613(00)80066-7. [DOI] [PubMed] [Google Scholar]
- 25.Hahn WC, Weinberg RA. Modelling the molecular circuitry of cancer. Nat Rev Cancer. 2002;2:331–41. doi: 10.1038/nrc795. [DOI] [PubMed] [Google Scholar]
- 26.Hahn WC, Weinberg RA. Rules for making human tumor cells. N Engl J Med. 2002;347:1593–603. doi: 10.1056/NEJMra021902. [DOI] [PubMed] [Google Scholar]
- 27.Hingorani SR, Wang L, Multani AS, Combs C, Deramaudt TB, Hruban RH, et al. Trp53R172H and KrasG12D cooperate to promote chromosomal instability and widely metastatic pancreatic ductal adenocarcinoma in mice. Cancer Cell. 2005;7:469–83. doi: 10.1016/j.ccr.2005.04.023. [DOI] [PubMed] [Google Scholar]
- 28.Ozenne P, Eymin B, Brambilla E, Gazzeri S. The ARF tumor suppressor: structure, functions and status in cancer. Int J Cancer. 2010;127:2239–47. doi: 10.1002/ijc.25511. [DOI] [PubMed] [Google Scholar]
- 29.Bardeesy N, Morgan J, Sinha M, Signoretti S, Srivastava S, Loda M, et al. Obligate roles for p16(Ink4a) and p19(Arf)-p53 in the suppression of murine pancreatic neoplasia. Mol Cell Biol. 2002;22:635–43. doi: 10.1128/MCB.22.2.635-643.2002. [DOI] [PMC free article] [PubMed] [Google Scholar]
- 30.Shamanin VA, Androphy EJ. Immortalization of human mammary epithelial cells is associated with inactivation of the p14ARF-p53 pathway. Mol Cell Biol. 2004;24:2144–52. doi: 10.1128/MCB.24.5.2144-2152.2004. [DOI] [PMC free article] [PubMed] [Google Scholar]
- 31.Li J, Gong LY, Song LB, Jiang LL, Liu LP, Wu J, et al. Oncoprotein Bmi-1 renders apoptotic resistance to glioma cells through activation of the IKK-nuclear factor-kappaB Pathway. Am J Pathol. 176:699–709. doi: 10.2353/ajpath.2010.090502. [DOI] [PMC free article] [PubMed] [Google Scholar]
- 32.Jiang L, Li J, Song L. Bmi-1, stem cells and cancer. Acta Biochim Biophys Sin (Shanghai) 2009;41:527–34. doi: 10.1093/abbs/gmp040. [DOI] [PubMed] [Google Scholar]
- 33.Lee CJ, Dosch J, Simeone DM. Pancreatic cancer stem cells. J Clin Oncol. 2008;26:2806–12. doi: 10.1200/JCO.2008.16.6702. [DOI] [PubMed] [Google Scholar]
- 34.Song W, Tao K, Li H, Jin C, Song Z, Li J, et al. Bmi-1 is related to proliferation, survival and poor prognosis in pancreatic cancer. Cancer Sci. 101:1754–60. doi: 10.1111/j.1349-7006.2010.01577.x. [DOI] [PMC free article] [PubMed] [Google Scholar]
- 35.Martinez-Romero C, Rooman I, Skoudy A, Guerra C, Molero X, Gonzalez A, et al. The epigenetic regulators Bmi1 and Ring1B are differentially regulated in pancreatitis and pancreatic ductal adenocarcinoma. J Pathol. 2009;219:205–13. doi: 10.1002/path.2585. [DOI] [PubMed] [Google Scholar]
Associated Data
This section collects any data citations, data availability statements, or supplementary materials included in this article.