Abstract
Background
Inflammatory cells exhibit an elevated level of protoporphyrin IX (PpIX) after the administration of 5-aminolevulinic acid (ALA). Here, we investigate the sonodynamic effects of ALA-derived PpIX (ALA-PpIX) on macrophages, which are the pivotal inflammatory cells in atherosclerosis.
Methods and results
Cultured THP-1 macrophages were incubated with ALA. Fluorescence microscope and fluorescence spectrometer detection showed that intracellular PpIX increased with the concentration of ALA in the incubation solution in a time dependent manner; the highest level of intracellular PpIX was observed after 3-hour incubation. 3-[4,5-dimethylthiazol-2-yl]-2,5-diphenyltetrazolium bromide assays demonstrated that lower concentrations (less than 2 mM) of ALA have no influence on cell viability (more than 90% of cells survived), but sonodynamic therapy (SDT) with a low concentration of ALA significantly decreased the survival rate of cells, and the effect was increased with both ALA concentration and ultrasound exposure time. Cell apoptosis and necrosis induced by ALA-mediated SDT (ALA-SDT) were measured using Hoechst 33258 and propidium iodide assay. ALA-SDT induced both cell apoptosis and necrosis, and the maximum apoptosis/necrosis ratio was observed at 6 hours after SDT with 1 mM of ALA and 5 minutes of ultrasound exposure. Flow cytometry analysis showed that ALA-SDT significantly increased late stage apoptotic cells (about 10-fold control). Furthermore, ALA-SDT induced reactive oxygen species generation in THP-1 macrophages immediately after the treatment and a conspicuous loss of mitochondrial membrane potential (MMP) at 6 hours compared with that of the control, ALA alone, and ultrasound alone groups.
Conclusion
ALA-SDT exhibited synergistic apoptotic effects on THP-1 macrophages, involving excessive intracellular reactive oxygen species generation and MMP loss. Therefore, ALA-SDT is a potential treatment for atherosclerosis.
Keywords: 5-aminolevulinic acid, protoporphyrin IX, sonodynamic therapy, macrophage, atherosclerosis
Introduction
Atherosclerosis is now recognized as a chronic inflammatory disease and is the foremost cause of human death worldwide.1 Some studies have suggested that macrophages play a pivotal role in the development, progression, and destabilization of atherosclerotic plaques.2,3 Therefore, removal of macrophages from plaque represents a new strategy for the treatment of atherosclerosis.4,5 Sonodynamic therapy (SDT) is a new treatment method for cancer that locally activates intravascular administrated and targeted accumulated sonosensitizers in the cancer region by low intensity ultrasonic irradiation. The subsequent generation of free radicals by activated sonosensitizers can lead to apoptotic cell death.6,7 In a previous study, we reported that emodin, a Chinese herbal medicine, combined with ultrasound can act synergistically to cause damage to macrophages in vitro.8 However, systemic administration of such herbal medicine is difficult, which limits its application as a sonosensitizer to treat atherosclerosis.
5-aminolevulinic acid (ALA) is a natural precursor to sonosensitizer protoporphyrin IX (PpIX) in the heme biosynthesis pathway.9 Unlike emodin, ALA can be injected intravenously. It has been reported that, with the systemic administration of exogenous ALA, PpIX can be produced and accumulated in cancer cells and inflammatory cells because of their limited capacity of porphobilinogen deaminase and ferrochelatase.9,10 Moreover, PpIX is mainly accumulated in the mitochondria where the PpIX is produced from ALA.11 The generation of reactive oxygen species (ROS) from the ultrasonic-activated PpIX leads to an attack on the cell mitochondria and inactivation of key antioxidant enzymes,12,13 which are considered to be responsible for the sonodynamic damage of cancer cells.
Although the effects of ALA-mediated SDT (ALA-SDT) on cancer cells have been proven, to date there are few studies on whether ALA-derived PpIX (ALA-PpIX) plays a role in the sonodynamic damage of macrophages. This study describes an investigation of the sonodynamic effects of ALA-PpIX on THP-1 macrophages in vitro.
Methods
Materials
ALA, 3-[4,5-dimethylthiazol-2-yl]-2,5-diphenyltetrazolium bromide (MTT), and propidium iodide (PI) were purchased from Sigma-Aldrich (St Louis, MO, USA). Fetal bovine serum (FBS) and RPMI 1640 were purchased from Hyclone Laboratories, Inc (HyClone, Logan, UT, USA). Phorbol-12-myristate-13-acetate (PMA) was obtained from EMD Biosciences, Inc (La Jolla, CA, USA). The ApoAlert Annexin V-FITC kit was purchased from BD Biosciences (Franklin Lakes, NJ, USA). All other drugs and chemicals used for this study were obtained from Sigma-Aldrich.
Cell culture
Human THP-1 cells (American Type Culture Collection [ATCC], Manassas, VA, USA) were seeded at a density of 0.5 × 10⁶ cells per milliliter in RPMI 1640 medium containing 10% FBS, 20 μg/mL penicillin, and 20 μg/mL streptomycin. The cells were maintained at 37°C in a humidified atmosphere containing 5% CO2. The cells were differentiated into macrophages by adding 100 ng/mL PMA for 72 hours in 96-well plates and 35 mm Petri dishes.
ALA cytotoxicity and intracellular accumulation of ALA-PpIX
To investigate the cytotoxicity of ALA, the cells were seeded into a 96-well plate and incubated with various concentrations (0–10.0 mM) of ALA for 6 hours.8 The survival rate of the cells was measured by MTT assay.8,14 To investigate the intracellular kinetics of ALA-PpIX, the cells were incubated with various concentrations (0.1, 0.5, 1.0, and 2.0 mM) of ALA for 3 hours. Intracellular PpIX was identified using a fluorescence microscope (Olympus Corporation, Tokyo, Japan). Then, the cells were incubated with 1 mM ALA for 0–12 hours. The fluorescence intensity of PpIX was measured by a fluorescence spectrometer (USB2000; Ocean Optics Inc., Dunedin, FL, USA).
SDT procedure
The ultrasonic generator and power amplifier used in this study were assembled by the Harbin Institute of Technology (Harbin, People’s Republic of China), as shown in Figure 1. The homemade ultrasonic transducer (diameter: 3.5 cm; resonance frequency: 1.0 MHz; duty factor: 10%; repetition frequency: 100 Hz) was placed in a water bath 30 cm under the cells. The ultrasonic intensity used was 0.5 W/cm2, as measured by using a hydrophone (Onda Corp, Sunnyvale, CA, USA).
Figure 1.
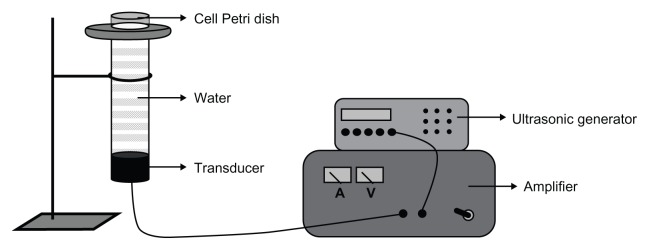
Schematic diagram of the sonication setup.
Note: The transducer is placed in a water bath 30 cm under the cells.
Cell viability assay
During the experiment, the cells were seeded into the 35 mm Petri dishes and incubated with different concentrations of ALA (0–2 mM) for 3 hours in the dark. They were then exposed to the ultrasound for 0–15 minutes. Six hours after ALA-SDT treatment, the survival rate of the cells was measured by MTT assay. Experiments were repeated three times independently.
Cell apoptosis and necrosis assessment
Hoechst 33258 and PI
Six hours after ALA-SDT treatment with different ALA concentrations and ultrasound exposure times, the cells were washed with PBS and stained with Hoechst 33258 and PI according to the manufacturer’s protocol. Briefly, macrophages were incubated with 10 μg/mL PI for 10 minutes at 37°C in the dark, and then incubated with 5 μg/mL Hoechst 33258 for 5 minutes. The cells were washed twice with PBS and then examined under a fluorescence microscope using a filter with an excitation wavelength of 330–385 nm and an emission wavelength of 420–480 nm. Necrotic cells were stained with red fluorescence, while apoptotic cells were stained with blue fluorescence. The fraction of apoptotic or necrotic cells was determined in five random microscopic images with at least 1000 cells/group. Experiments were repeated three times independently.
Flow cytometry analysis
Cell apoptosis and necrosis were also assessed by the Annexin V-FITC apoptosis kit according to the manufacturer’s instructions. Cells were divided randomly into four groups (control, ultrasound alone, ALA alone, and SDT). For the ALA alone and SDT groups, 1 mM ALA solution was added to the cells. The cells in the control and ultrasound alone groups were incubated with an equivalent PBS solution instead of the ALA solution. After 3-hour incubation in the dark, the cells in the ultrasound alone and SDT groups were exposed to the ultrasound for 5 minutes. Six hours after the treatments, the cells were incubated with 5 μL Annexin V and 5 μL PI for 10 minutes at room temperature in the dark. Cells from each sample were then analyzed by FacsCalibur flow cytometer (BD Biosciences). The data were analyzed using CELLQuest software (BD). The results were interpreted in the following fashion: cells in the lower-left quadrant (Annexin-V−/PI−) represent living cells, those in the lower-right quadrant (Annexin-V+/PI−) represent early apoptotic cells, those in the upper-right quadrant (Annexin-V+/PI+) represent late apoptotic cells, and those in the upper-left quadrant (Annexin-V−/PI+) represent necrotic cells. Experiments were repeated three times independently.
Mitochondrial membrane potential detection
Mitochondrial membrane potential (MMP) was assessed using fluorescent probe jc-1. Six hours after ALA-SDT treatment, macrophages were incubated with 10 mg/mL jc-1 for 20 minutes at 37°C in the dark and were monitored by the fluorescence microscope. Red–orange fluorescence is attributable to a potential-dependent aggregation in the mitochondria. Green fluorescence, reflecting the monomeric form of jc-1, appeared in the cytosol after mitochondrial membrane depolarization. The fluorescence intensity was measured using a fluorospectrophotometer (Varian Australia Pty Ltd, Melbourne, Victoria, Australia) at 488 nm excitation and 530 nm (green) and 590 nm (red) emission wavelengths. Experiments were repeated three times independently.
ROS detection
ROS content was determined by measuring the fluorescence of 2,7-dichlorofluorescein (DCF). 2′-7′-dichlorofluorescin diacetate (DCFH-DA) was added to the medium of cells at a final concentration of 20 μM and incubated at 37°C for 30 minutes. The cells were then washed carefully with PBS. Immediately after ALA-SDT treatment, a total of 1 × 10⁶ cells were collected, resuspended in serum-free medium, and measured using the fluorospectrophotometer at 488 nm excitation and 525 nm emission wavelengths. Experiments were repeated three times independently.
Statistical analysis
All data were reported as mean value ± standard deviation (SD). One-way analysis of variance, followed by Student–Newman–Keuls testing, was used to determine the difference among the groups. Statistical evaluation was performed using SPSS software (v13.0; IBM Corporation, Armonk, NY, USA). Differences with P < 0.05 were considered statistically significant.
Results
ALA cytotoxicity and intracellular accumulation of ALA-PpIX
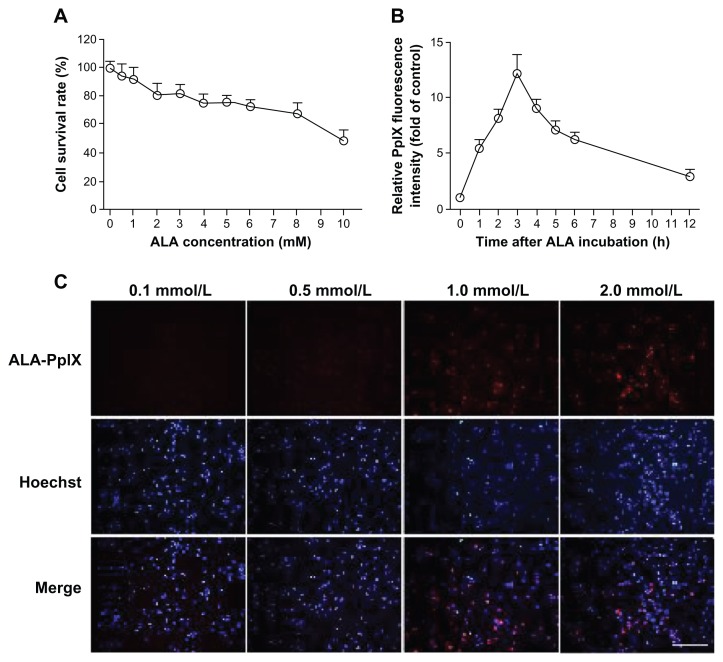
MTT assay showed that cell viability was related to ALA concentration. Low concentrations (less than 2 mM) of ALA did not influence cell survivability, and more than 90% of cells survived (Figure 2A). The fluorescence intensity of PpIX detected by the fluorescence spectrometer was increased in THP-1 macrophages after incubation with 1 mM ALA, peaked at 3 hours, and then faded with time (Figure 2B). Fluorescence microscope detection showed that an identical pattern of intracellular PpIX red fluorescence was observed when ALA concentration was greater than or equal to 1 mM (Figure 2C).
Figure 2.
ALA cytotoxicity and intracellular accumulation of ALA-PpIX. (A) The survival rates of THP-1 macrophages after incubation with ALA at different concentrations as determined by MTT assay. (B) The accumulation of PpIX in THP-1 macrophages detected by fluorescence spectrometer at different times after incubation with 1 mM ALA. Data represent the means ± SD (n = 6 per group). (C) Fluorescent photomicrograph of THP-1 macrophages showing intracellular PpIX after incubation with various concentrations of ALA.
Note: Scale bar: 0.2 mm.
Abbreviations: ALA, 5-aminolevulinic acid; MTT, 3-[4,5-dimethylthiazol-2-yl]-2,5-diphenyltetrazolium bromide; PpIX, protoporphyrin IX; SD, standard deviation.
Cell viability after ALA-SDT
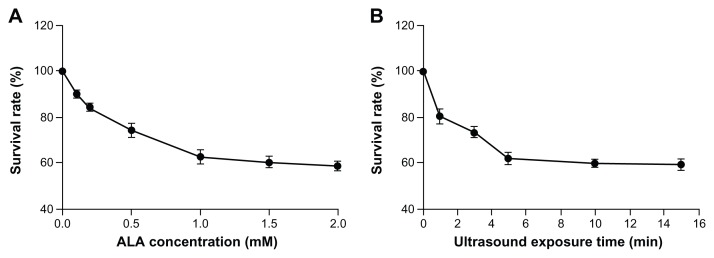
The survival rate of macrophages decreased with ALA concentration and ultrasound exposure time. As shown in Figure 3, the survival rate decreased significantly from 90.1% ± 2.2% (0.1 mM) to 58.7% ± 2.1% (2.0 mM) in cells treated with ALA-SDT, using 5 minute ultrasonic irradiation. The survival rate decreased significantly from 80.7% ± 2.3% (1 minute) to 59.7% ± 2.3% (15 minutes) in cells treated with ALA-SDT at 1 mM ALA concentration.
Figure 3.
Cell viability after ALA-SDT. (A) The survival rates of THP-1 macrophages after 5 minutes ultrasound exposure with ALA concentrations at 0, 0.1, 0.2, 0.5, 1.0, and 2.0 mM as determined by MTT assay. (B) The survival rates of THP-1 macrophages after 1 mM ALA incubation with ultrasound exposure for 0, 1, 3, 5, 10, and 15 minutes.
Note: Data represent the means ± SD (n = 6 per group).
Abbreviations: ALA, 5-aminolevulinic acid; MTT, 3-[4,5-dimethylthiazol-2-yl]-2,5-diphenyltetrazolium bromide; SD, standard deviation; SDT, sonodynamic therapy.
Apoptosis and necrosis induced by ALA-SDT
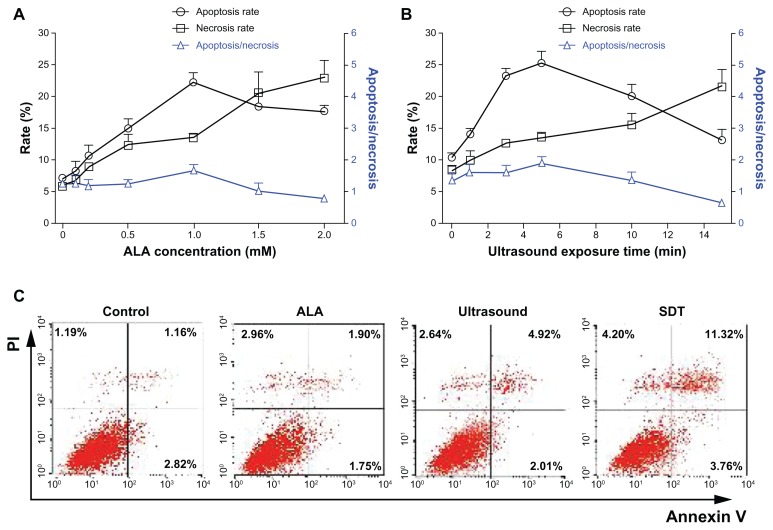
Hoechst 33258 and PI assay of cell apoptosis and necrosis are shown in Figure 4A and B. ALA-SDT induced both apoptosis and necrosis in THP-1 macrophages, and the apoptotic ratio was higher than the necrotic ratio with appropriate conditions. The percentage of apoptotic cells increased significantly from 8.3% ± 3.4% (0.1 mM) to 22.2% ± 2.7% (1 mM), but decreased to 17.6% ± 2.2% (2.0 mM) in cells treated with ALA-SDT using 5-minute ultrasonic irradiation, while the percentage of necrotic cells increased significantly from 7.0% ± 2.3% (0.1 mM) to 23.1% ± 5.7% (2 mM). The maximum apoptosis/necrosis ratio (1.7 ± 0.3) was observed in ALA-SDT-treated cells at 1 mM ALA concentration. The percentage of apoptotic cells increased significantly from 14.1% ± 0.8% (1 minute) to 25.3% ± 3.0% (5 minutes), but decreased to 13.0% ± 3.8% (15 minutes) in cells treated with ALA-SDT at 1 mM ALA concentration, while the percentage of necrotic cells increased significantly from 9.9% ± 3.3% (1 minute) to 21.6% ± 6.1% (15 minutes). The maximum apoptosis/necrosis ratio (1.9 ± 0.4) was observed in ALA-SDT-treated cells using 5-minute ultrasonic irradiation. Furthermore, cell apoptosis and necrosis were measured using flow cytometry with double staining of Annexin V and PI. As shown in Figure 4V, there were nearly equal cell apoptosis rates in the ALA alone and the control groups. However, the ultrasound-treated cells displayed an increase in late apoptosis rate. The late cell apoptosis rate in the ALA-SDT group was much higher than the other three groups (about 10-fold of the control).
Figure 4.
Apoptosis and necrosis induced by ALA-SDT. (A and B) The percentage of apoptotic and necrotic THP-1 macrophages and apoptosis/necrosis ratio at 6 hours after ALA-SDT with different ALA concentrations and ultrasound exposure times as determined by Hoechst 33258 and PI assay. Data represent the means ± SD (n = 6 per group). (C) Apoptosis and necrosis rates of THP-1 macrophages of the control and treated by ALA alone (1 mM), ultrasound alone (5 minutes), or SDT (1 mM ALA plus 5 minutes ultrasound exposure) groups, measured using flow cytometry with double staining of Annexin V and PI.
Abbreviations: ALA, 5-aminolevulinic acid; PI, propidium iodide; SD, standard deviation; SDT, sonodynamic therapy.
Mitochondrial membrane potential loss induced by ALA-SDT
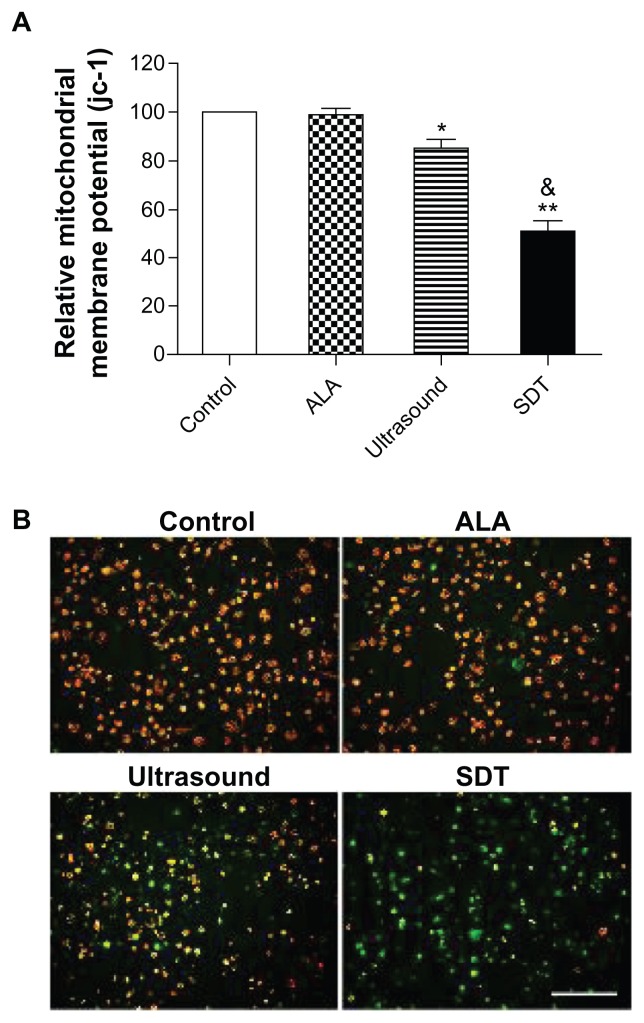
The green and red-orange fluorescence intensities of jc-1 were measured using the fluorospectrophotometer. As shown in Figure 5A, the relative MMP level of the ALA alone group was not different from that of the control group (P > 0.05). However, the relative MMP levels of macrophages exposed to ultrasound alone and SDT were decreased to 84.7% ± 4.6% (versus the control group, P < 0.05) and 51.1% ± 4.4% (versus the control and ultrasound alone groups, P < 0.01), respectively. The fluorescence properties of jc-1 in cells of the control and the treated by ALA alone, ultrasound alone, and SDT groups were monitored by the fluorescence microscope. As shown in Figure 5B, red-orange fluorescence was present in most cells of the control and ALA alone groups, while green fluorescence was present in a small portion of the ultrasound-treated cells and most of the SDT-treated cells.
Figure 5.
MMP loss induced by ALA-SDT. (A) The relative MMP level of THP-1 macrophages assessed using fluorospectrophotometer with the staining of fluorescent probe jc-1. Data represent the means ± SD (n = 6 per group). *P < 0.05; **P < 0.01 compared with the control group; &P < 0.05 compared with the ultrasound-alone group. (B) Fluorescent photomicrograph of THP-1 macrophages stained by jc-1 showing MMP.
Note: Scale bar: 0.1 mm.
Abbreviations: ALA, 5-aminolevulinic acid; MMP, mitochondrial membrane potential; SD, standard deviation; SDT, sonodynamic therapy.
ROS generation by ALA-SDT
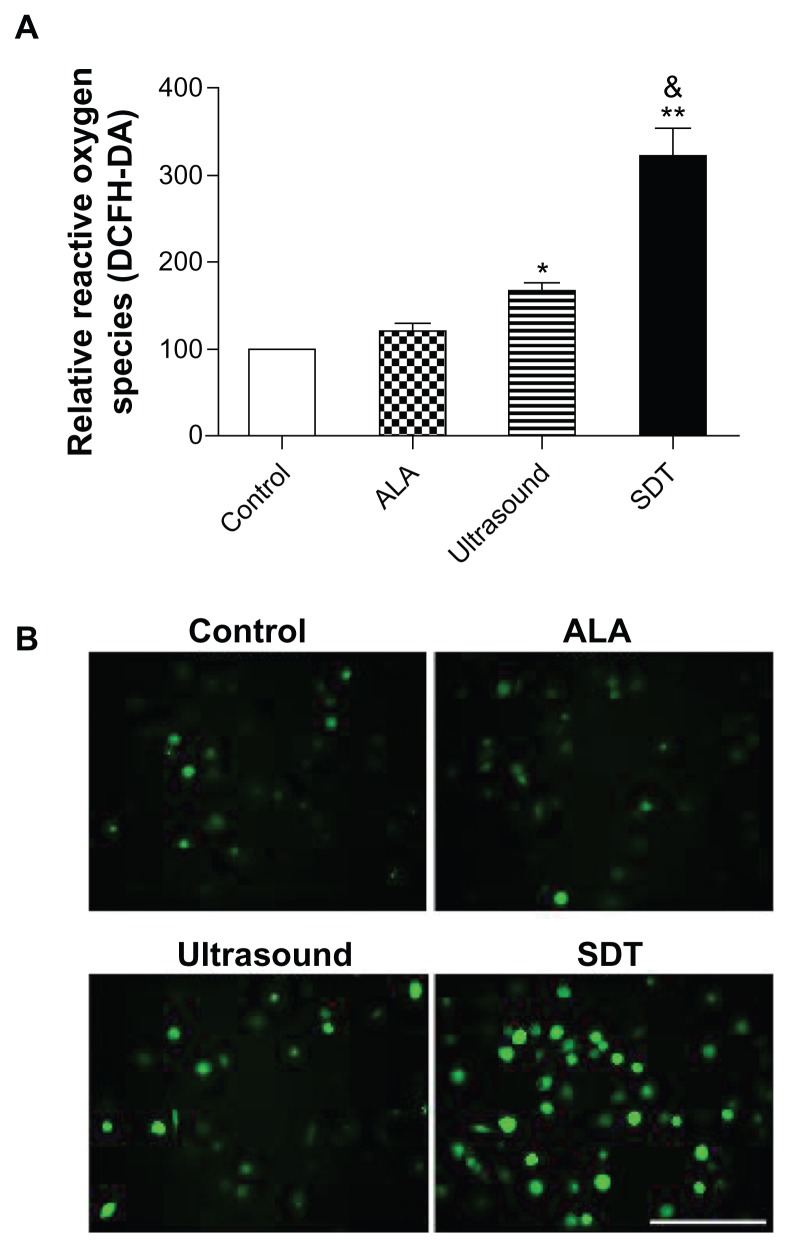
The fluorescence intensity of DCF was measured by the fluorospectrophotometer. The relative ROS level in the ALA alone group was 121.7% ± 8.1%, which was not statistically different from the control group (100%, P > 0.05). ROS levels were increased to 166.7% ± 8.5% in the ultrasound alone group (versus the control group, P < 0.05) and 322.0% ± 33.4% in the SDT group (versus the control and ultrasound alone groups, P < 0.01) (Figure 6A). The fluorescence of DCF was also monitored by the fluorescence microscope. The green fluorescence of DCF was present in few control and ALA-treated cells, and was present in a small portion of the ultrasound-treated cells and most of the SDT-treated cells (Figure 6B).
Figure 6.
ROS generation induced by ALA-SDT. (A) Intracellular ROS generation in THP-1 macrophages detected by fluorospectrophotometer with the staining of fluorescent probe DCFH-DA. Data represent the means ± SD (n = 6 per group). *P < 0.05; **P < 0.01 compared with the control group; &P < 0.05 compared with the ultrasound alone group. (B) Fluorescent photomicrograph of THP-1 macrophages stained by DCFH-DA showing intracellular ROS.
Note: Scale bar: 0.1 mm.
Abbreviations: ALA, 5-aminolevulinic acid; DCFH-DA, 2′-7′-dichlorofluorescin diacetate; ROS, reactive oxygen species; SD, standard deviation; SDT, sonodynamic therapy.
Discussion
ALA-PpIX has already been applied clinically as a sensitizer in photodynamic therapy (PDT) and SDT of cancers.9,15 Waksman et al successfully demonstrated that MV0611 mediated PDT simultaneously reduced the inflammation of plaque and attenuated the progression of the disease.16 Our previous study further demonstrated that PDT with ALA could reduce the macrophage content in plaques.17 However, the application of PDT is limited to superficial lesions because of its definite penetration. Since ultrasound has a much lower attenuation coefficient than does light in biological tissues, SDT is more promising for the noninvasive treatment of atherosclerosis imbedded in deep tissue. In this study, the sonodynamic effects of ALA-PpIX on macrophages were investigated in vitro.
Here, we confirmed that PpIX preferentially accumulated in THP-1 macrophages through the administration of ALA. Intracellular PpIX was proportional to ALA concentration as well as ALA incubation time with incubation up to 3 hours (Figure 2B and C). ALA concentration over 1 mM showed obvious cytotoxicity as less than 80% of cells survived (Figure 2A). Therefore, PpIX accumulation induced by ALA in macrophages reached its maximum at 1 mM ALA for 3-hour incubation. These results indicate that the specification of proper drug concentration and incubation time is necessary for the safety of SDT. Furthermore, cell viability was measured by MTT assay after ALA-SDT. In the ALA-SDT-treated macrophages, cell death was observed to be ALA concentration- and ultrasound irradiation time-dependent.
Recent investigations have revealed that apoptosis was the prominent form of cell death in response to SDT for many cancer cells.10,18 As shown in Figure 4A and B, at low sonosensitizer dosage and less ultrasound exposure time, apoptosis was the main cell-death pathway in macrophages. The rate of necrosis increased gradually as the amount of ALA concentration and ultrasound irradiation augmented, and the maximal apoptosis/necrosis ratio was observed at 1 mM ALA and 5-minute irradiation. Clinically, apoptosis is preferred over necrosis since it causes less inflammation reactions.19,20 Therefore, ALA-PpIX is a promising sonosensitizer when used in proper concentration combined with the appropriate amount of ultrasound irradiation for the treatment of atherosclerosis.
Cell apoptosis was further assessed in THP-1 macrophages at 1 mM ALA and 5 minutes irradiation using flow cytometry analysis. The cell apoptosis rate of the ALA-SDT group was much higher than that in the ultrasound alone group, while the ALA alone had little effect (Figure 4C). Late apoptosis was dominant over early apoptosis in ALA-SDT-treated cells, which was in accordance with previous studies on the SDT treatment of cancer cells.21 The late apoptotic cells might represent cells that were initially early apoptotic before losing membrane integrity due to the lack of timely phagocytosis in vitro.22
The treatment efficiency depends on the subcellular localization patterns of sonosensitizers because of the very short lifetime and very short diffusion distance of the ROS during SDT treatment.23 We propose that mitochondria damage is the major cause of ALA-SDT-induced apoptosis because intracellular PpIX was synthesized in mitochondria from ALA. To confirm this, MMP change of THP-1 macrophages after ALA-SDT was assessed using fluorescent probe jc-1. The cells treated by ultrasonic irradiation displayed a decrease in MMP, and this decrease was greatly enhanced in the presence of ALA, while ALA alone had little effect (Figure 5). This result was consistent with previous studies.24 The loss of MMP has been confirmed to inhibit the function of mitochondrial adenosine triphosphate synthesis.25 Additionally, the release of cytochrome c, Smac/Diablo, and AIF from intermembrane space into the cytosol was observed due to the decreased MMP, which subsequently activated caspase-9 and caspase-3, and eventually regulated cell apoptosis.26
Our previous investigations have shown that SDT-induced ROS production stimulates damages in the mitochondria.10,21 These ROS may react with proteins, nucleic acids, lipids, and other molecules, leading to changes in their structures, and thus causing damage in organelles and cells. It should be noted that there are numerous defensive mechanisms in the cells based on antioxidative enzymes and the actions of low molecular antioxidants, which are able to eliminate excessive active oxygen.27 However, the defensive system may be destroyed by the formation of excessive free radicals, resulting in irreversible modifications of biologically fundamental macromolecules. Our study indicated that ultrasound treatment alone caused a slight increase in intracellular ROS production compared with the control group (Figure 6), but did not produce noticeable cell apoptosis (Figure 4C). On the other hand, SDT with ALA generated much more ROS in cells (Figure 6), which corresponded well with the results of the highest MMP loss (Figure 5) and cell apoptosis in the group treated by ALA-SDT (Figure 4C). These results implied that the enhanced apoptosis of THP-1 macrophages by ALA-SDT was potentially related to the ROS-mediated mitochondrial pathway.
Conclusion
ALA-SDT exhibited synergistic damage and apoptosis of THP-1 macrophages in vitro due to the targeting of mitochondria, excessive intracellular ROS generation, and MMP loss. Our results imply that ALA-SDT, which realized the strategy of reducing the infiltration of macrophages in atherosclerotic plaque, might be a good treatment for atherosclerosis.
Acknowledgments
This study was supported by the National Natural Science Foundation of China (30970786, 81101164, 81171483) and the Scientific and Technical Key Task of Heilongjiang Provence, People’s Republic of China (GC10C306). This study was also supported by grants from the Funds for Creative Research Groups of the National Natural Science Foundation of China (81121003).
Footnotes
Disclosure
The authors report no conflicts of interest in this study.
References
- 1.Libby P. Inflammation in atherosclerosis. Nature. 2002;420(6917):868–874. doi: 10.1038/nature01323. [DOI] [PubMed] [Google Scholar]
- 2.Moore KJ, Tabas I. Macrophages in the pathogenesis of atherosclerosis. Cell. 2011;145(3):341–355. doi: 10.1016/j.cell.2011.04.005. [DOI] [PMC free article] [PubMed] [Google Scholar]
- 3.Weber C, Noels H. Atherosclerosis: current pathogenesis and therapeutic options. Nat Med. 2011;17(11):1410–1422. doi: 10.1038/nm.2538. [DOI] [PubMed] [Google Scholar]
- 4.Tiwari RL, Singh V, Barthwal MK. Macrophages: an elusive yet emerging therapeutic target of atherosclerosis. Med Res Rev. 2008;28(4):483–544. doi: 10.1002/med.20118. [DOI] [PubMed] [Google Scholar]
- 5.De Meyer I, Martinet W, De Meyer GR. Therapeutic strategies to deplete macrophages in atherosclerotic plaques. Br J Clin Pharmacol. 2012;74(2):246–263. doi: 10.1111/j.1365-2125.2012.04211.x. [DOI] [PMC free article] [PubMed] [Google Scholar]
- 6.Rosenthal I, Sostaric JZ, Riesz P. Sonodynamic therapy – a review of the synergistic effects of drugs and ultrasound. Ultrason Sonochem. 2004;11(6):349–363. doi: 10.1016/j.ultsonch.2004.03.004. [DOI] [PubMed] [Google Scholar]
- 7.Shibaguchi H, Tsuru H, Kuroki M. Sonodynamic cancer therapy: a non-invasive and repeatable approach using low-intensity ultrasound with a sonosensitizer. Anticancer Res. 2011;31(7):2425–2429. [PubMed] [Google Scholar]
- 8.Gao Q, Wang F, Guo S, et al. Sonodynamic effect of an anti- inflammatory agent – emodin on macrophages. Ultrasound Med Biol. 2011;37(9):1478–1485. doi: 10.1016/j.ultrasmedbio.2011.05.846. [DOI] [PubMed] [Google Scholar]
- 9.Krammer B, Plaetzer K. ALA and its clinical impact, from bench to bedside. Photochem Photobiol Sci. 2008;7(3):283–289. doi: 10.1039/b712847a. [DOI] [PubMed] [Google Scholar]
- 10.Song W, Cui H, Zhang R, et al. Apoptosis of SAS cells induced by sonodynamic therapy using 5-aminolevulinic acid sonosensitizer. Anticancer Res. 2011;31(1):39–45. [PubMed] [Google Scholar]
- 11.Wang X, Wang P, Tong W, Liu Q. Comparison of pharmacokinetics, intracellular localizations and sonodynamic efficacy of endogenous and exogenous protoporphyrin IX in sarcoma 180 cells. Ultrasonics. 2010;50(8):803–810. doi: 10.1016/j.ultras.2010.04.004. [DOI] [PubMed] [Google Scholar]
- 12.Mi N, Liu Q, Wang X, et al. Induction of sonodynamic effect with protoporphyrin IX on isolate hepatoma-22 cells. Ultrasound Med Biol. 2009;35(4):680–686. doi: 10.1016/j.ultrasmedbio.2008.07.002. [DOI] [PubMed] [Google Scholar]
- 13.Wang XB, Liu QH, Wang P, et al. Study of cell killing effect on S180 by ultrasound activating protoporphyrin IX. Ultrasonics. 2008;48(2):135–140. doi: 10.1016/j.ultras.2007.11.001. [DOI] [PubMed] [Google Scholar]
- 14.Mosmann T. Rapid colorimetric assay for cellular growth and survival: application to proliferation and cytotoxicity assays. J Immunol Methods. 1983;65(1–2):55–63. doi: 10.1016/0022-1759(83)90303-4. [DOI] [PubMed] [Google Scholar]
- 15.Agostinis P, Berg K, Cengel KA, et al. Photodynamic therapy of cancer: an update. CA Cancer J Clin. 2011;61(4):250–281. doi: 10.3322/caac.20114. [DOI] [PMC free article] [PubMed] [Google Scholar]
- 16.Waksman R, McEwan PE, Moore TI, et al. PhotoPoint photodynamic therapy promotes stabilization of atherosclerotic plaques and inhibits plaque progression. J Am Coll Cardiol. 2008;52(12):1024–1032. doi: 10.1016/j.jacc.2008.06.023. [DOI] [PubMed] [Google Scholar]
- 17.Peng C, Li Y, Liang H, et al. Detection and photodynamic therapy of inflamed atherosclerotic plaques in the carotid artery of rabbits. J Photochem Photobiol B. 2011;102(1):26–31. doi: 10.1016/j.jphotobiol.2010.09.001. [DOI] [PubMed] [Google Scholar]
- 18.Xiang J, Xia X, Jiang Y, et al. Apoptosis of ovarian cancer cells induced by methylene blue-mediated sonodynamic action. Ultrasonics. 2011;51(3):390–395. doi: 10.1016/j.ultras.2010.11.005. [DOI] [PubMed] [Google Scholar]
- 19.Martinet W, Verheye S, De Meyer GR. Selective depletion of macrophages in atherosclerotic plaques via macrophage-specific initiation of cell death. Trends Cardiovasc Med. 2007;17(2):69–75. doi: 10.1016/j.tcm.2006.12.004. [DOI] [PubMed] [Google Scholar]
- 20.Tabas I. Macrophage death and defective inflammation resolution in atherosclerosis. Nat Rev Immunol. 2010;10(1):36–46. doi: 10.1038/nri2675. [DOI] [PMC free article] [PubMed] [Google Scholar]
- 21.Lv Y, Fang M, Zheng J, et al. Low-intensity ultrasound combined with 5-aminolevulinic acid administration in the treatment of human tongue squamous carcinoma. Cell Physiol Biochem. 2012;30(2):321–333. doi: 10.1159/000339067. [DOI] [PubMed] [Google Scholar]
- 22.Kim CH, Chung CW, Choi KH, et al. Effect of 5-aminolevulinic acid-based photodynamic therapy via reactive oxygen species in human cholangiocarcinoma cells. Int J Nanomedicine. 2011;6:1357–1363. doi: 10.2147/IJN.S21395. [DOI] [PMC free article] [PubMed] [Google Scholar]
- 23.Kinoshita M, Hynynen K. Mechanism of porphyrin-induced sonodynamic effect: possible role of hyperthermia. Radiat Res. 2006;165(3):299–306. doi: 10.1667/rr3510.1. [DOI] [PubMed] [Google Scholar]
- 24.Li Y, Wang P, Zhao P, et al. Apoptosis induced by sonodynamic treatment by protoporphyrin IX on MDA-MB-231 cells. Ultrasonics. 2012;52(4):490–496. doi: 10.1016/j.ultras.2011.10.013. [DOI] [PubMed] [Google Scholar]
- 25.Ji Z, Yang G, Vasovic V, et al. Subcellular localization pattern of protoporphyrin IX is an important determinant for its photodynamic efficiency of human carcinoma and normal cell lines. J Photochem Photobiol B. 2006;84(3):213–220. doi: 10.1016/j.jphotobiol.2006.03.006. [DOI] [PubMed] [Google Scholar]
- 26.Ly JD, Grubb DR, Lawen A. The mitochondrial membrane potential (deltapsi(m)) in apoptosis; an update. Apoptosis. 2003;8(2):115–128. doi: 10.1023/a:1022945107762. [DOI] [PubMed] [Google Scholar]
- 27.Mates JM. Effects of antioxidant enzymes in the molecular control of reactive oxygen species toxicology. Toxicology. 2000;153(1–3):83–104. doi: 10.1016/s0300-483x(00)00306-1. [DOI] [PubMed] [Google Scholar]


