Abstract
Purpose.
To determine the effect of triamcinolone acetonide (TA) on outflow facility in mice.
Methods.
Animals received 20 μL of TA (40 mg/mL) suspension subconjunctivally either bilaterally or unilaterally and were euthanized after either 1 week or 3 weeks. Before mice were killed, IOP was measured with a rebound tonometer. Outflow facility was determined using simultaneous pressure and flow measurements. Another set of animals received bilateral injection of anecortave acetate (AA) with or without bilateral TA injection and their outflow facility was also determined. Myocilin expression was investigated in a subset of eyes using quantitative PCR (qPCR).
Results.
Outflow facility of eyes in animals receiving bilateral TA injection (TABL) and TA-treated eyes of animals receiving unilateral injection (TAUL) was significantly decreased compared to naïve control eyes (Cnaive) after 1 week and 3 weeks of TA treatment (ANOVA P < 0.01, P < 0.001, respectively). Eyes treated with AA (with or without TA) had higher outflow facility than animals treated with TA (P < 0.05). IOP data did not show any significant difference between groups. qPCR analysis revealed significant decrease in myocilin expression in eyes receiving AA compared to naïve control and TA-treated eyes (ANOVA P < 0.001).
Conclusions.
Steroid treatment significantly decreases outflow facility in C57BL/6 mice despite having small effect on IOP. This animal model can be useful for studying the pathogenesis of steroid-induced glaucoma.
A new mouse model of steroid-induced changes in outflow facility has been established. This model can be used for rapid evaluation of the role of genes as well as pharmacologic agents in the pathogenesis of steroid-induced and more broadly open-angle glaucoma.
Introduction
Glucocorticoid (GC)-induced ocular hypertension (OH) is a frequent complication of chronic treatment with steroids, either systemic or local. A number of predisposing risk factors have been identified.1,2 GC-induced ocular hypertension generally occurs within weeks in susceptible individuals and is dependent on GC potency, pharmacokinetics, duration of treatment, and route of administration.3 It is usually reversible with discontinuation of the steroids; however, if steroid treatment is continued for prolonged periods, it can lead to glaucomatous optic neuropathy.4 Although the exact pathogenetic mechanism of GC-induced ocular hypertension remains unknown, it is clear that the rise in IOP is due to increased aqueous humor (AH) outflow resistance.3,5,6 In addition, it is associated with specific morphological changes in the trabecular meshwork (TM) cells7–9 and mediated by a glucocorticoid receptor (GR). Lower expression of GR beta (GRβ), an alternatively spliced form of the GR in glaucomatous TM cells, may contribute to the altered phagocytic function of TM cells, thus leading to increased AH outflow resistance mediated by GC.10 Changes in the TM include physical and mechanical alteration in the microstructure of the TM, glucocorticoid-induced formation of cross-linked actin networks,11 and increase in the deposition of extracellular matrix (ECM) components collagen, glycosaminoglycans, elastin, and fibronectin, which are ultimately responsible for decreased outflow facility.12–14 GCs can also inhibit proteases and trabecular meshwork endothelial cell phagocytosis, causing a decrease in the breakdown of ECM in the TM.15–17
To better understand the mechanism of steroid-induced glaucoma, a number of animal models have been developed.18–23 Most recently, we reported a bovine and an ovine model of steroid-induced IOP elevation.24,25 Although these models have certain advantages in terms of the similarity of ruminant eyes to the human eye, the reliable response to steroids, and the size of the eyes, they also have some drawbacks. Specifically, experimentation with large animals is prohibitively expensive and the lack of detailed genomic information makes hypothesis testing difficult. In an effort to harness the power of mouse genomics, we attempted to develop a mouse model of steroid-induced OH.
Although other investigators have previously reported that rats and mice develop elevated IOP following steroid treatment, such IOP elevation is small and often within the margin of error of measurements with current instrumentation.26 We reasoned that this is because outflow in mice is mostly through the uveoscleral pathway and thus not affected as much by changes in trabecular outflow.27 Thus, a more appropriate parameter to monitor in mice after exposure to steroid would be outflow facility rather than the insensitive IOP. In the present study, we reported the effect of triamcinolone acetonide (TA) on outflow facility in mice.
Materials and Methods
Animals
Three-month-old female mice of C57BL/6 strain were used in this study. The animals were kept under a 12-hour light/12-hour dark cycle and fed ad libitum. All procedures were performed in accordance with the ARVO Statement for the Use of Animals in Ophthalmic and Vision Research and were approved by the Institutional Animal Care Committee.
Subconjunctival Injection
The animals received either 20 μL of TA (40 mg/mL) or anecortave acetate (AA) (75 mg/mL; Alcon, Ft. Worth, TX) suspension or both subconjunctivally using a Hamilton syringe and a 26-gauge needle. Some animals were injected with TA bilaterally, whereas others unilaterally. In these animals, contralateral eyes received a sham injection. Animals were killed after either 1 week or 3 weeks of TA treatment. Animals receiving AA were treated in both eyes. AA was injected after 2 weeks of bilateral TA injection and animals were killed after 1 week of AA treatment (i.e., after 3 weeks of TA treatment). Some animals received bilateral injection of AA only for 1 week. All injections were performed under intraperitoneal anesthesia with ketamine/xylazine mix and topical anesthesia with 0.5% proparacaine.
IOP Measurement
IOP was measured in mice preterminally with a rebound tonometer.28 The animals were held in a custom-made restraint that does not compress the chest or neck while IOP is measured.29 IOP measurements were performed after application of 0.5% proparacaine topical anesthesia. Five measurements per eye were obtained and averaged. IOP measurements were performed between 10 AM and 12 PM, to minimize the effect of diurnal IOP variation.
Outflow Facility Determination
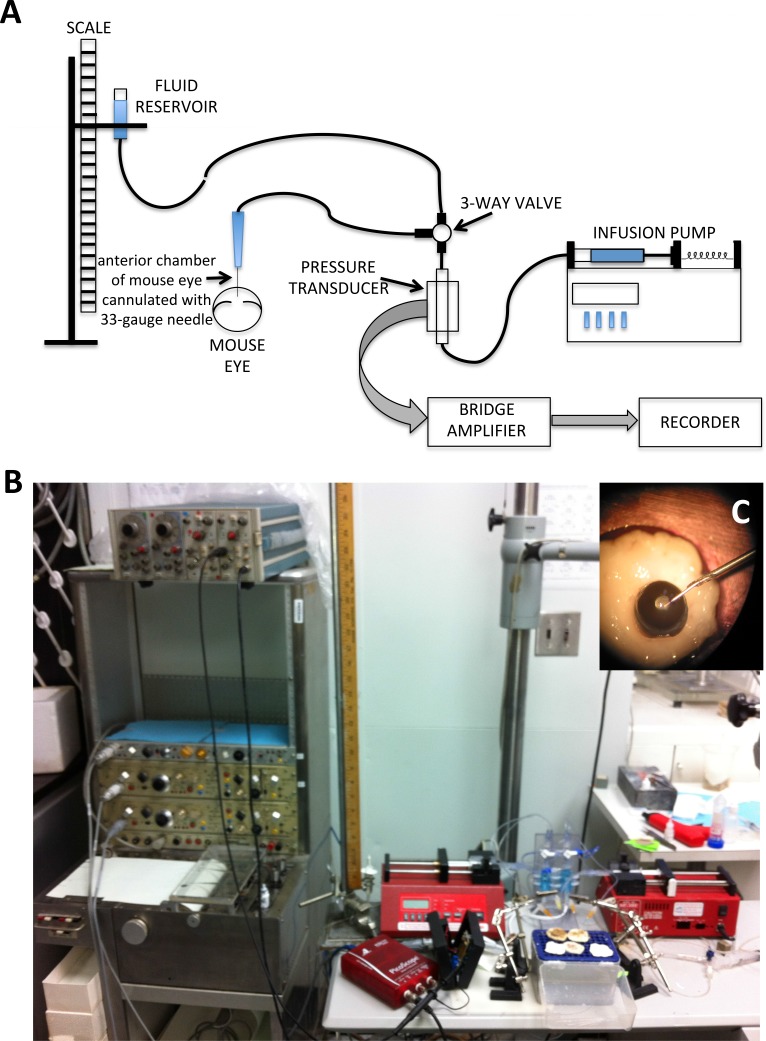
The animals were killed by cervical dislocation under deep surgical anesthesia. The eyes were immediately enucleated and used for the measurement of outflow facility as previously described,30 with minor modifications. Briefly, the eyes were cannulated using custom-made 33-gauge stainless steel needles constructed by inserting 33-gauge stainless steel tubing in 26-gauge disposable needles, securing it in place with epoxy glue, and beveling the edge to 45 degrees with a custom-made beveling device. Needles were connected via short PE60 tubing (BD Biosciences, San Jose, CA) to a three-way valve. One end of the valve was connected to a flow-through pressure transducer (DTXPlus transducer; BD Biosciences) for the continuous determination of pressure within the system. The other end of the valve was connected via capillary intravenous tubing to a reservoir to calibrate the system by altering the height of the fluid-filled reservoir. The pressure transducer was also connected to a 1-mL syringe loaded into a microdialysis infusion pump (NE-300 Just Infusion Syringe Pump; New Era Pump System, Inc., Farmingdale, NY) (Fig. 1). The tubing, transducer, syringe, and reservoir were all filled with PBS. Before using, it was verified that the system resistance was negligible. It was also determined that the compliance was such that allowed the system to reach steady state almost instantaneously when the 33-gauge needle was occluded for pressures to 50 mm Hg. In preliminary experiments, it was determined that the maximum amount of time for reaching steady state after increasing perfusion rate was 30 to 40 minutes at the lowest flow rate and faster at highest flow rates. Enucleated eyes were suspended from the cannulating needles and in touch with the surface of a well of PBS. In addition, a drop of PBS was applied to the upper surface of the eyes every 10 minutes for the duration of the perfusion.
Figure 1. .
Schematic representation (A) and actual setup (B) for outflow facility measurement in mouse eyes. The eye was cannulated (C) with a custom-made 33-gauge needle and connected via short PE60 tubing to a three-way valve. One end of the valve is connected to a flow-through pressure transducer for the continuous determination of pressure within the system. The other end of the valve is connected via capillary intravenous tubing to a reservoir to calibrate the system by altering the height of the fluid-filled reservoir. The pressure transducer is connected to a syringe loaded into a microdialysis infusion pump. For continuous pressure recording, the pressure transducer is attached to a bridge amplifier and the signal fed into a recorder.
Outflow facility was determined using a constant flow method. Eyes were initially perfused at a flow rate of 0.1 μL per minute and the system was allowed to run for 30 to 40 minutes to achieve stable baseline pressure. Flow rate was then increased sequentially to 0.13, 0.15, 0.20, 0.25, and 0.30 μL per minute. Pressures were recorded either continuously using a chart recorder or intermittently (every 5 minutes) using a digital recorder. The pressure readings at steady state at each flow rate were plotted and the slope of the regression line was used to calculate outflow facility. Only pressure values below 30 mm Hg were included in outflow facility calculation. Eyes showing regression lines with R2 less than 0.9 were also excluded from analysis, as it was determined that such readings occurred almost invariably by either leaks at high pressure or trauma to the lens during cannulation.
Tissue Collection and Isolation of RNA
Myocilin (MYOC) mRNA expression in the TM was investigated in a subset of eyes. After perfusion, eyes were immersed in RNA stabilizing agent (RNAlater, Ambion; Invitrogen, Carlsbad, CA) at 4°C overnight and stored at −20°C until RNA extraction. The eyes were dissected on ice in the presence of RNA stabilizing agent to isolate a rim of tissue containing the TM after removing most of the cornea, iris, and ciliary body. Rims containing TM from eyes of the same experimental group were pooled together (four at a time) to achieve sufficient amount of RNA for analysis. The rims were homogenized and total RNA was extracted using TRIzol reagent (Gibco/Invitrogen, Carlsbad, CA) according to the manufacturer's protocol. Briefly, the tissue was homogenized in TRIzol and chloroform was added to separate proteins from RNA. After being centrifuged, the RNA-containing supernatant was aspirated. The RNA was precipitated with isopropanol, washed in 70% ethanol, treated with DNase and column purified using a commercial kit (RNAeasy Mini Kit; Qiagen, Valencia, CA) in accordance with the manufacturer's instructions. RNA concentrations were determined with a spectrophotometer (Nanodrop; Thermo Scientific, Wilmington, DE) and the 260/280-nm absorbance ratio calculated to determine RNA purity.
Quantitative Real-Time PCR
The RNA samples were reverse transcribed with random hexamers to cDNA using a reverse transcription kit (Quantitect; Qiagen), in accordance with the manufacturer's instructions. Quantitative real-time PCR (qRT-PCR) was performed using a commercial kit (SYBR Green RT-PCR Reagents Kit; Applied Biosystems, Carlsbad, CA). qRT-PCR was carried out in an ABI PRISM 7900HT sequence detector (Applied Biosystems) using the following parameters: denaturation at 95°C for 2 minutes; 35 cycles of denaturation at 95°C for 30 seconds; annealing at 65°C for 30 seconds; extension at 72°C for 30 seconds; and final extension at 72°C for 5 minutes. The primer sequences used for mouse myocilin (MYOC) were as follows: Forward: 5′- ACCTTCAGAGAGACAGCAGCATC-3′, Reverse: 5′- GCTGGTCCCGTTCTCTCCTCA-3.′ Relative quantification of gene expression was performed using the standard curve method. Mean Ct (threshold cycle) of the samples was compared among the groups by using the Ct of 18S as an internal control. ΔCt was calculated as the difference in Ct values derived from the target gene and the 18S gene. Relative fold change was calculated as log2(ΔCt).
Statistical Analysis
Statistical analysis was performed using GraphPad Prism (3.03) software (GraphPad, La Jolla, CA). The differences in means were analyzed using one-way ANOVA followed by Tukey's multiple comparison test. Values of P less than 0.05 were considered to be statistically significant.
Results
Effect of TA and Anecortave on IOP
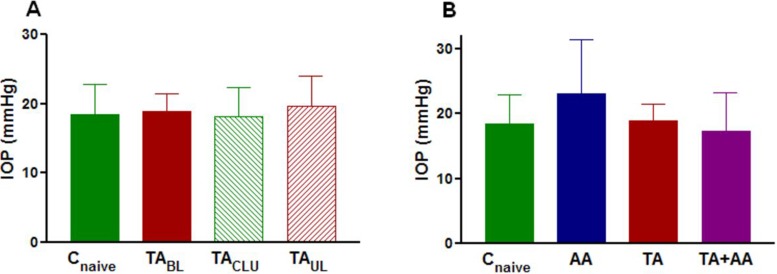
No significant difference was observed in IOP among eyes injected with TA (animals either receiving bilateral or unilateral TA injection), their contralateral sham-injected eyes, or eyes of noninjected animals after 3 weeks of TA treatment (Fig. 2A). IOP was also not significantly different among eyes injected with either TA alone or AA alone or both and eyes of noninjected animals after 3 weeks of TA treatment (Fig. 2B).
Figure 2. .
(A) Preterminal mean ± SD IOP in naive control eyes (Cnaive) (n = 10), eyes of animals receiving bilateral injection of TA (TABL) (n = 8), TA-treated eyes of animals receiving unilateral injection (TAUL) (n = 9), and their sham-injected contralateral eyes (TACLU) (n = 9) after 3 weeks of treatment. Group means are not significantly different. Power of this comparison was only 0.09. (B) Preterminal mean ± SD IOP in naive control eyes (Cnaive) (n = 10), eyes of animals receiving bilateral injection of AA alone (AA) (n = 12) for 1 week, eyes of animals receiving bilateral injection of TA alone (TA) (n = 8) for 3 weeks, and eyes of animals receiving bilateral TA injection for 2 weeks followed by bilateral injection of AA for 1 week (TA+AA) (n = 8). Group means are not significantly different. Power of this comparison was only 0.44.
Effect of TA on Outflow Facility
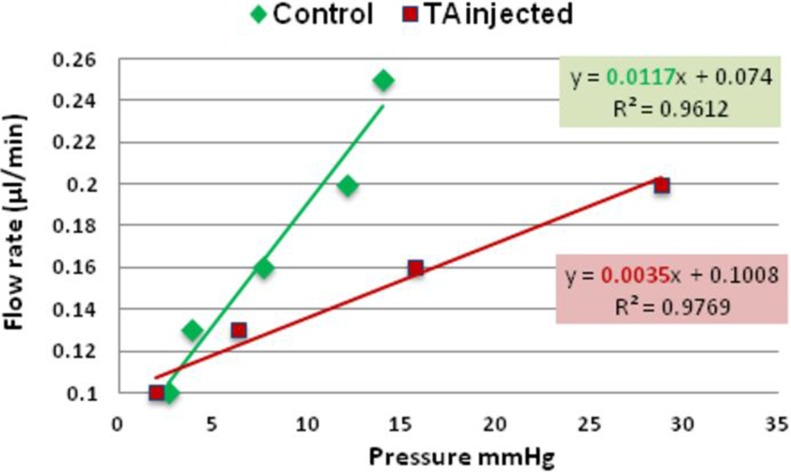
A representative graph of outflow facility in naïve control and TA-treated eyes is shown in Figure 3.
Figure 3. .
Representative graph showing the relation between pressure and flow rate in naïve control eye (green) and TA-treated eye (red). The slope of regression line (highlighted) represents outflow facility (0.0117 μL/min/mm Hg and 0.0035 μL/min/mm Hg, for the control and TA-treated eye respectively).
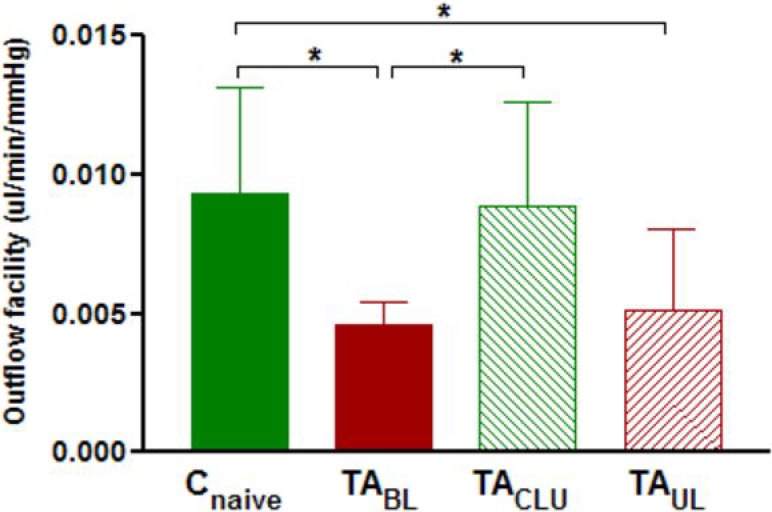
Outflow facility (mean ± SD) was 0.0093 ± 0.0038, 0.0046 ± 0.0009, 0.0051 ± 0.0029, and 0.0089 ± 0.0037 μL/min/mm Hg for treatment-naïve control eyes (Cnaive), TA-injected eyes of bilaterally treated animals (TABL), TA-injected eyes of unilaterally injected animals (TAUL), and their sham-injected contralateral untreated eyes (TACLU) respectively after 1 week of treatment. One-way ANOVA revealed significant difference (P < 0.01) in outflow facility among TA-injected eyes (from animals receiving either bilateral or unilateral injection of TA) treated for 1 week, contralateral sham-injected eyes, and eyes of noninjected animals (Fig. 4). Post hoc analysis showed a significant decrease in the outflow facility of eyes of animals receiving bilateral injection of TA (P < 0.05) and TA-treated eyes of animals receiving unilateral injection (P < 0.05) compared with eyes of naïve control animals after 1 week of TA treatment (Fig. 4). Outflow facility was also significantly decreased (P < 0.05) in eyes of animals receiving bilateral injection of TA compared with sham-injected eyes of animals receiving unilateral injection of TA after 1 week of TA treatment (Fig. 4). However, the difference in outflow facility of TA treated eyes of animals receiving unilateral TA injection compared with their sham-injected contralateral eyes after 1 week of TA treatment did not reach statistical significance (Fig. 4).
Figure 4. .
Mean ± SD outflow facility in naive control eyes (Cnaive) (n = 9), eyes of animals receiving bilateral injection of TA (TABL) (n = 9), TA-treated eyes of animals receiving unilateral injection (TAUL) (n = 8), and their sham-injected contralateral untreated eyes (TACLU) (n = 8) after 1 week of treatment. Group means are significantly different (ANOVA P < 0.05). Asterisks indicate significant differences on post hoc analysis. *P < 0.05.
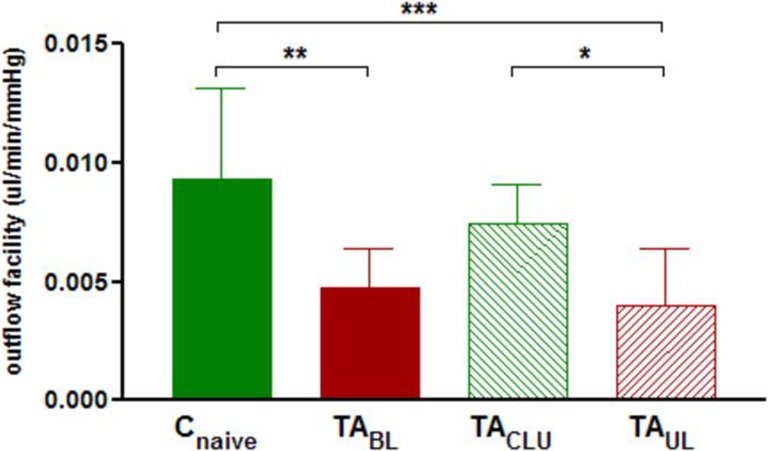
Outflow facility (mean ± SD) was 0.0093 ± 0.0038, 0.0047 ± 0.0017, 0.0040 ± 0.0024, and 0.0074 ± 0.0017 μL/min/mm Hg for treatment-naïve control eyes (Cnaive), TA-injected eyes of bilaterally treated animals (TABL), TA-injected eyes of unilaterally injected animals (TAUL), and their sham-injected contralateral untreated eyes (TACLU), respectively, after 3 weeks of treatment. Outflow facility of eyes of animals receiving bilateral TA injection, TA-treated eyes of animals receiving unilateral injection, their contralateral sham-injected eyes, and eyes of naïve control animals were significantly different after 3 weeks of TA treatment (ANOVA P < 0.001) (Fig. 5). Post hoc analysis revealed significant decrease in outflow facility of eyes of animals receiving bilateral TA injection and TA-treated eyes of animals receiving unilateral injection compared with eyes of naïve control animals (P < 0.01, P < 0.001, respectively) (Fig. 5). Outflow facility was also significantly decreased in TA-treated eyes of animals receiving unilateral injection compared with their sham-injected contralateral eyes (P < 0.05) (Fig. 5). Outflow facility of sham-injected contralateral eyes of animals receiving unilateral injection of TA was higher than eyes of animals receiving bilateral injection and lower than eyes of naïve control animals after 3 weeks of TA treatment; however, these differences did not reach statistical significance (Fig. 5).
Figure 5. .
Mean ± SD outflow facility in naive control eyes (Cnaive) (n = 9), eyes of animals receiving bilateral injection of TA (TABL) (n = 10), TA-treated eyes of animals receiving unilateral injection (TAUL) (n = 9), and their sham-injected contralateral untreated eyes (TACLU) (n = 9) after 3 weeks of treatment. Group means are significantly different (ANOVA P < 0.001). Asterisks indicate significant differences on post hoc analysis. *P < 0.05, **P < 0.01, ***P < 0.001.
Effect of Anecortave on Outflow Facility of TA-Injected Eyes
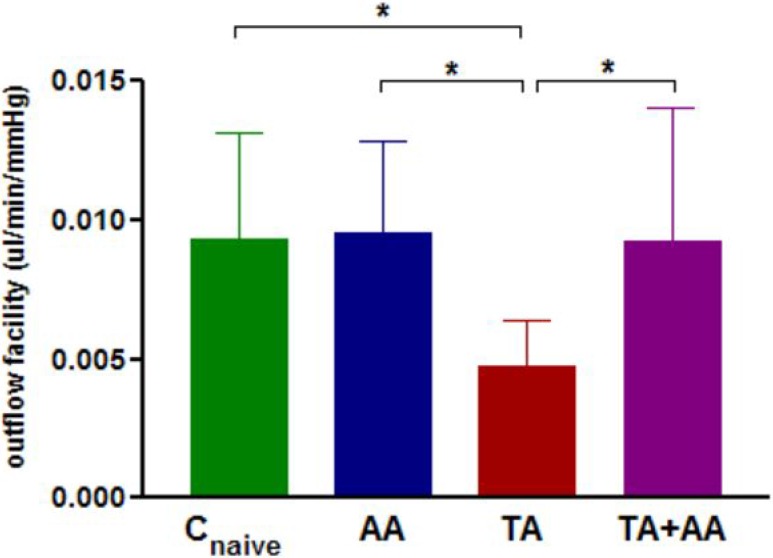
To ensure decrease in outflow facility by TA, animals were treated with bilateral TA injections for 2 weeks followed by bilateral injections of AA for 1 week. Outflow facility (mean ± SD) was 0.0093 ± 0.0038, 0.0047 ± 0.0017, 0.0090 ± 0.0048, and 0.0093 ± 0.0032 μL/min/mm Hg for treatment-naïve control eyes (Cnaive), TA-treated eyes (TA), TA plus AA-treated eyes (TA+AA), and AA alone–treated eyes (AA) respectively. One-way ANOVA revealed significant difference (P < 0.05) in outflow facility between eyes of animals receiving TA alone, both TA and AA, AA alone, and naïve control eyes (Fig. 6). Post hoc analysis showed a significant difference in outflow facility of only TA-injected eyes compared with AA-injected eyes, eyes of naïve control animals, and eyes injected with both TA and AA (P < 0.05) (Fig. 6). No significant difference was detected in outflow facility of naïve control eyes, eyes injected with AA only, and eyes injected with both TA and AA (Fig. 6).
Figure 6. .
Mean ± SD outflow facility in naive control eyes (Cnaive) (n = 9), eyes of animals receiving bilateral injection of AA alone (AA) (n = 8) for 1 week, eyes of animals receiving bilateral injection of TA alone (TA) (n = 10) for 3 weeks, and eyes of animals receiving bilateral TA injection for 2 weeks followed by bilateral injection of AA for 1 week (TA+AA) (n = 13). Group means are significantly different (ANOVA P < 0.05). Asterisks indicate significant differences on post hoc analysis. *P < 0.05.
MYOC Expression in Trabecular Meshwork
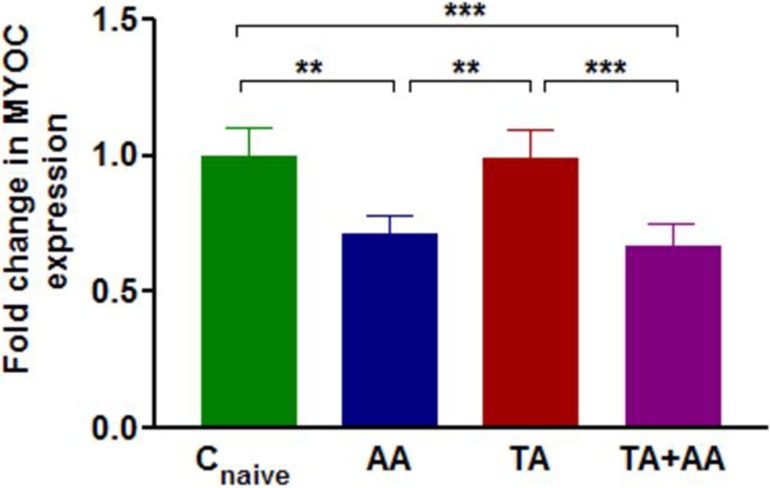
One-way ANOVA showed significant differences (P < 0.001) in normalized MYOC expression between TM of eyes treated with AA, TA, TA+AA, and naïve controls (Fig. 7). Post hoc analysis surprisingly revealed that eyes receiving AA either alone or together with TA had significantly lower (P < 0.001) relative MYOC expression compared with either TA-injected or naïve control eyes after 1 week of AA treatment (Fig. 7). No significant difference in MYOC expression was observed between eyes treated with TA for 3 weeks and naïve control eyes (Fig. 7). MYOC expression was significantly decreased by 0.72-fold in eyes receiving AA alone and 0.66-fold in eyes receiving TA+AA compared with naïve control eyes (P < 0.01, P < 0.001, respectively) (Fig. 7).
Figure 7. .
Fold change (mean ± SD) of relative MYOC expression in TM of naive control eyes (Cnaive) (n = 20), eyes of animals receiving bilateral injection of AA alone (AA) (n = 12) for 1 week, eyes of animals receiving bilateral injection of TA alone (TA) (n = 20) for 3 weeks, and eyes of animals receiving bilateral TA injection for 2 weeks followed by bilateral injection of AA for 1 week (TA+AA) (n = 16). Group means are significantly different (ANOVA P < 0.001). Asterisks indicate significant differences on post hoc analysis. **P < 0.01, ***P < 0.001.
Discussion
Administration of topical GC in humans can cause IOP elevation in susceptible individuals; however, in recent years, increasingly potent GCs have been used locally. This has led to a higher percentage of patients exposed to GCs manifesting clinically significant IOP elevation.31 Thus, efforts to understand the mechanism that leads to steroid-induced IOP elevation have become increasingly important.32 It has been appreciated for some time that steroid-induced ocular hypertension is caused by a reduction in outflow facility.3,5,6 In addition, morphologic, biochemical, and structural changes in the TM have been documented.11–17 However, it is unclear whether such changes are causative for steroid-induced ocular hypertension. Because similar changes are often observed in chronic open-angle glaucoma, it becomes even more important to understand the mechanism behind such changes. That points to the need for development of reproducible animal models for understanding the mechanism of steroid-induced ocular hypertension.
A number of animals respond to steroid treatment with IOP elevation; however, for many of those, the response is either not consistent enough or requires steroid treatment that is close to a lethal dose.18–23 Recently, we described two animal models of steroid-induced ocular hypertension in cows and sheep in which IOP elevation occurs in almost 100% of treated animals in a relatively brief time period.24,25 Although these models offer significant experimental advantages, they are not very amenable to use for rapid testing of hypotheses, as small numbers of animals can be used at one time and some experimental procedures cannot be readily performed in large eyes because of substantial cost. In addition, genetic information in both of these species is not well developed. To overcome these problems we attempted to determine whether mice can be used for studying the effects of steroid on the TM. In an attempt to make this model as inexpensive and easy for others to use, we decided to use 12-week-old female mice, which can be readily obtained commercially. An additional potential advantage of using young animals may be a greater responsiveness to steroids, as has been shown for humans.33
Mice have been used by others for the same purpose in the past; however, mice need to be treated systemically with doses close to the median lethal dose (LD50) for IOP to be affected. Even then, IOP elevations due to steroid in mice are rather small in magnitude, making them difficult to detect unless large cohorts of animals are used.26 Our approach differed from prior attempts in two aspects: (1) we administered steroid locally rather than systemically, and (2) we focused on outflow facility rather than IOP as an outcome measure. The rationale behind the first choice was to try to maximize effects on the eye while minimizing systemic toxicity. The choice of outflow facility as the parameter to measure was based on the fact that most aqueous humor elimination in mice occurs through the uveoscleral pathway.27 Thus, we reasoned (see Appendix) that outflow facility would be much more sensitive in detecting steroid-induced changes in the TM than IOP.
Our results suggest that outflow facility in mice is indeed affected rather quickly by steroid treatment. To investigate whether we can use one eye of each animal as a control eye (untreated eye) we studied four groups of eyes: (1) eyes that received steroid injection in uniocularly treated animals, (2) eyes that received sham injection in uniocularly treated animals, (3) eyes that received steroid injection in bilaterally treated animals, and (4) naïve control eyes. The four groups of eyes had different outflow facility after both 1 week and 3 weeks of treatment. However, the outflow facility of eyes of animals treated unilaterally with TA was not significantly different between treated and untreated eyes at the 1-week time point. Although increasing the sample size could potentially allow the difference to become statistically significant, we believe that such an increase obviates some of the advantages afforded by this animal model. Part of the reason why differences in outflow facility of contralateral eyes of animals treated with TA in only one eye are not as large is because animals receiving TA injection unilaterally have some effect on their contralateral eyes. This becomes more apparent after 3 weeks of treatment where the outflow facility of untreated eyes of uniocularly treated animals is slightly lower than that of naïve control eyes. Thus we believe that bilateral treatment of animals with TA and comparison with eyes of naïve untreated animals as controls is best, as it allows for reasonable group sizes to be used.
As a proof of concept that this model can be used for studying the effect of pharmacologic agents on steroid-induced IOP elevation, we have used this design to determine the effect of AA on outflow facility of the mouse eye. AA is one of a class of steroid-derived compounds known to lower IOP, but devoid of conventional steroid hormone activity.34 The precise molecular mechanism of action is not well understood; however, it has been shown that it does not bind the glucocorticoid receptor.35 Anecortave has been shown to lower IOPs of patients with primary open-angle glaucoma and patients with steroid-related glaucoma.36,37 In the steroid-induced sheep model of glaucoma, administration of anecortave prevented the increase in outflow resistance produced by the corticosteroid.38 Recently, in a randomized clinical study, the authors reported an IOP lowering effect of AA administered at three doses (3, 15, or 30 mg) as an anterior juxtascleral depot in patients experiencing elevated IOP due to corticosteroid therapy.39 Our results demonstrated significant increase in outflow facility in eyes receiving 2 weeks of TA treatment with subsequent treatment with AA for 1 week, compared with eyes treated with AA alone. This indicates that treatment with AA can reverse changes in outflow facility caused by steroid treatment, suggesting relevance of this mouse model.
The mouse model of steroid-induced glaucoma could be useful for beginning to investigate the role of some of the genes already linked with the pathogenesis of the condition and more broadly of open-angle glaucoma; however, one has to keep in mind that mouse anterior segment physiology is not always identical to that of humans. For example, glaucoma gene myocilin, which is a 55- to 57-kDa secreted glycoprotein is induced by glucocorticoid in human TM tissue explants, perfusion-cultured human eyes, and TM of primate eyes, and this induction is associated with an increase in IOP.40 In contrast, in mice, neither absence of MYOC nor elevated level of MYOC is associated with IOP elevation.41,42 However, mutant MYOC transgenic animal models showing elevated IOP have been reported.43 The exact mechanism of how mutant MYOC affects IOP has not been elucidated, but appears to be through endoplasmic reticulum stress probably through exposure of a cryptic peroxisomal targeting sequence (PTS), whose interaction with the PTS type 1 receptor is necessary for IOP elevation in mice.44 We investigated whether MYOC expression is affected in mice treated with steroid. Although no such difference was detected between TA-treated and control eyes, we were very surprised to detect decreased expression of MYOC in eyes treated with AA. To date, there is no published data showing AA-mediated downregulation of MYOC expression, although such a decrease in humans has been referenced in a relevant patent.45 Although our results need additional confirmation with a larger number of animals and potentially added controls, they are provided here to allow appreciation of the potential usefulness of this model.
In summary, we have established a new model of steroid-induced changes in outflow facility in mice that can allow rapid evaluation of genes as well as pharmacologic agents in the pathogenesis of steroid-induced and, more broadly, open-angle glaucoma. We hope that this model will rapidly increase our understanding of the disease by allowing investigators to harness the power of mouse genetics.
Acknowledgments
The authors thank Iok-Hou Pang and Alcon, Inc. for providing anecortave acetate.
Appendix
To determine the magnitude of the effect of outflow facility changes on IOP change in the mouse, we performed a theoretical analysis using published data as well as experimental values obtained from the above experiments.
Because aqueous dynamics are expected to be in steady state, inflow is expected to be equal to total outflow (Ft). Total outflow is the sum of conventional outflow (Fc) and uveoscleral outflow (Fu), thus
 |
According to the Friedman equation,
 |
where C is outflow facility and EVP is episcleral venous pressure.
By substituting Equation 2 into Equation 1 we thus have
 |
On treatment with TA, outflow facility changes to C′ and IOP is expected to also change to IOP′. Because inflow and EVP are not expected to change, we can write
 |
Substituting Equation 3 into Equation 4 will thus give us
 |
which can be rearranged as
 |
Because Fu′ is expected to be equal to Fu, (6) can be rewritten as
 |
or
 |
Because IOP is expected to increase from baseline after TA treatment by an amount ΔIOP, we can write
 |
and substituting in Equation 8 we obtain
 |
or
 |
or
 |
or
 |
or even yet
 |
Substituting the C and C′ values with the means experimentally detected above yields
 |
or
 |
Using the EVP and IOP values measured by Aihara et al.,27 one can calculate that expected ΔIOP would be
 |
Using the variance data in our IOP measurements, one would need a minimum of 25 eyes in each group to reach a power of 0.8 for detecting a 20% difference of IOP between groups. Smaller IOP differences would require an even larger number of eyes.
Footnotes
Supported by National Eye Institute (EY020670), unrestricted challenge grant from Research to Prevent Blindness.
Disclosure: S. Kumar, None; S. Shah, None; E.R. Deutsch, None; H.M. Tang, None; J. Danias, None
References
- 1. Jones R III, Rhee DJ. Corticosteroid-induced ocular hypertension and glaucoma: a brief review and update of the literature. Curr Opin Ophthalmol. 2006; 17: 163–167 [DOI] [PubMed] [Google Scholar]
- 2. Kersey JP, Broadway DC. Corticosteroid-induced glaucoma: a review of the literature. Eye (Lond). 2006; 20: 407–416 [DOI] [PubMed] [Google Scholar]
- 3. Becker B, Mills DW. Corticosteroids and intraocular pressure. Arch Ophthalmol. 1963; 70: 500–507 [DOI] [PubMed] [Google Scholar]
- 4. Goldmann H. Cortisone glaucoma. Arch Ophthalmol. 1962; 68: 621–626 [DOI] [PubMed] [Google Scholar]
- 5. Bernstein HN, Schwartz B. Effects of long-term systemic steroids on ocular pressure and topographic values. Arch Ophthalmol. 1962; 68: 742–753 [DOI] [PubMed] [Google Scholar]
- 6. Armaly MF. Effect of corticosteroids on intraocular pressure and fluid dynamics. I. The effect of dexamethasone in the normal eye. Arch Ophthalmol. 1963; 70: 482–491 [DOI] [PubMed] [Google Scholar]
- 7. Rohen JW, Linner E, Witmer R. Electron microscopic studies on the trabecular meshwork in two cases of corticosteroid-glaucoma. Exp Eye Res. 1973; 17: 19–31 [DOI] [PubMed] [Google Scholar]
- 8. Roll P, Benedikt O. Electronmicroscopic studies of the trabecular meshwork in corticosteroid glaucoma [in German]. Klin Monbl Augenheilkd. 1979; 174: 421–428 [PubMed] [Google Scholar]
- 9. Johnson D, Gottanka J, Flugel C, Hoffmann F, Futa R, Lutjen-Drecoll E. Ultrastructural changes in the trabecular meshwork of human eyes treated with corticosteroids. Arch Ophthalmol. 1997; 115: 375–383 [DOI] [PubMed] [Google Scholar]
- 10. Zhang X, Clark AF, Yorio T. Regulation of glucocorticoid responsiveness in glaucomatous trabecular meshwork cells by glucocorticoid receptor-beta. Invest Ophthalmol Vis Sci. 2005; 46: 4607–4616 [DOI] [PubMed] [Google Scholar]
- 11. Clark AF, Wilson K, McCartney MD, Miggans ST, Kunkle M, Howe W. Glucocorticoid-induced formation of cross-linked actin networks in cultured human trabecular meshwork cells. Invest Ophthalmol Vis Sci. 1994; 35: 281–294 [PubMed] [Google Scholar]
- 12. Wilson K, McCartney MD, Miggans ST, Clark AF. Dexamethasone induced ultrastructural changes in cultured human trabecular meshwork cells. Curr Eye Res. 1993; 12: 783–793 [DOI] [PubMed] [Google Scholar]
- 13. Yue BY. The extracellular matrix and its modulation in the trabecular meshwork. Surv Ophthalmol. 1996; 40: 379–390 [DOI] [PubMed] [Google Scholar]
- 14. Johnson DH, Bradley JM, Acott TS. The effect of dexamethasone on glycosaminoglycans of human trabecular meshwork in perfusion organ culture. Invest Ophthalmol Vis Sci. 1990; 31: 2568–2571 [PubMed] [Google Scholar]
- 15. Wordinger RJ, Clark AF. Effects of glucocorticoids on the trabecular meshwork: towards a better understanding of glaucoma. Prog Retin Eye Res. 1999; 18: 629–667 [DOI] [PubMed] [Google Scholar]
- 16. Snyder RW, Stamer WD, Kramer TR, Seftor RE. Corticosteroid treatment and trabecular meshwork proteases in cell and organ culture supernatants. Exp Eye Res. 1993; 57: 461–468 [DOI] [PubMed] [Google Scholar]
- 17. Shirato S, Bloom E, Polansky J, Alvarado J, Stilwell L. Phagocytic properties of confluent human trabecular meshwork cells. Invest Ophthalmol Vis Sci. 1988; 29: S125 [Google Scholar]
- 18. Bhattacherjee P, Paterson CA, Spellman JM, Graff G, Yanni JM. Pharmacological validation of a feline model of steroid-induced ocular hypertension. Arch Ophthalmol. 1999; 117: 361–364 [DOI] [PubMed] [Google Scholar]
- 19. Fingert JH, Clark AF, Craig JE, et al. Evaluation of the myocilin (MYOC) glaucoma gene in monkey and human steroid-induced ocular hypertension. Invest Ophthalmol Vis Sci. 2001; 42: 145–152 [PubMed] [Google Scholar]
- 20. Knepper PA, Breen M, Weinstein HG, Blacik JL. Intraocular pressure and glycosaminoglycan distribution in the rabbit eye: effect of age and dexamethasone. Exp Eye Res. 1978; 27: 567–575 [DOI] [PubMed] [Google Scholar]
- 21. Lorenzetti OJ. Effects of corticosteroids on ocular dynamics in rabbits. J Pharmacol Exp Ther. 1970; 175: 763–772 [PubMed] [Google Scholar]
- 22. Sawaguchi K, Nakamura Y, Sakai H, Sawaguchi S. Myocilin gene expression in the trabecular meshwork of rats in a steroid-induced ocular hypertension model. Ophthalmic Res. 2005; 37: 235–242 [DOI] [PubMed] [Google Scholar]
- 23. Zhan GL, Miranda OC, Bito LZ. Steroid glaucoma: corticosteroid-induced ocular hypertension in cats. Exp Eye Res. 1992; 54: 211–218 [DOI] [PubMed] [Google Scholar]
- 24. Gerometta R, Podos SM, Candia OA, et al. Steroid-induced ocular hypertension in normal cattle. Arch Ophthalmol. 2004; 122: 1492–1497 [DOI] [PubMed] [Google Scholar]
- 25. Gerometta R, Podos SM, Danias J, Candia OA. Steroid-induced ocular hypertension in normal sheep. Invest Ophthalmol Vis Sci. 2009; 50: 669–673 [DOI] [PubMed] [Google Scholar]
- 26. Whitlock NA, McKnight B, Corcoran KN, Rodriguez LA, Rice DS. Increased intraocular pressure in mice treated with dexamethasone. Invest Ophthalmol Vis Sci. 2010; 51: 6496–6503 [DOI] [PubMed] [Google Scholar]
- 27. Aihara M, Lindsey JD, Weinreb RN. Aqueous humor dynamics in mice. Invest Ophthalmol Vis Sci. 2003; 44: 5168–5173 [DOI] [PubMed] [Google Scholar]
- 28. Danias J, Kontiola AI, Filippopoulos T, Mittag T. Method for the noninvasive measurement of intraocular pressure in mice. Invest Ophthalmol Vis Sci. 2003; 44: 1138–1141 [DOI] [PubMed] [Google Scholar]
- 29. Nissirios N, Goldblum D, Rohrer K, Mittag T, Danias J. Noninvasive determination of intraocular pressure (IOP) in nonsedated mice of 5 different inbred strains. J Glaucoma. 2007; 16: 57–61 [DOI] [PubMed] [Google Scholar]
- 30. Millar JC, Clark AF, Pang IH. Assessment of aqueous humor dynamics in the mouse by a novel method of constant-flow infusion. Invest Ophthalmol Vis Sci. 2011; 52: 685–694 [DOI] [PubMed] [Google Scholar]
- 31. Bollinger K, Kim J, Lowder CY, Kaiser PK, Smith SD. Intraocular pressure outcome of patients with fluocinolone acetonide intravitreal implant for noninfectious uveitis. Ophthalmology. 2011; 118: 1927–1931 [DOI] [PubMed] [Google Scholar]
- 32. Clark AF. Basic sciences in clinical glaucoma: steroids, ocular hypertension, and glaucoma. J Glaucoma. 1995; 4: 354–369 [PubMed] [Google Scholar]
- 33. Lam DS, Fan DS, Ng JS, Yu CB, Wong CY, Cheung AY. Ocular hypertensive and anti-inflammatory responses to different dosages of topical dexamethasone in children: a randomized trial. Clin Experiment Ophthalmol. 2005; 33: 252–258 [DOI] [PubMed] [Google Scholar]
- 34. Clark AF. Mechanism of action of the angiostatic cortisene anecortave acetate. Surv Ophthalmol. 2007; 52: S26–S34 [DOI] [PubMed] [Google Scholar]
- 35. McNatt LG, Weimer L, Yanni J, Clark AF. Angiostatic activity of steroids in the chick embryo CAM and rabbit cornea models of neovascularization. J Ocul Pharmacol Ther. 1999; 15: 413–423 [DOI] [PubMed] [Google Scholar]
- 36. Robin AL, Suan EP, Sjaarda RN, Callanan DG, Defaller J. Reduction of intraocular pressure with anecortave acetate in eyes with ocular steroid injection-related glaucoma. Arch Ophthalmol. 2009; 127: 173–178 [DOI] [PubMed] [Google Scholar]
- 37. Robin AL, Clark AF, Covert DW, et al. Anterior juxtascleral delivery of anecortave acetate in eyes with primary open-angle glaucoma: a pilot investigation. Am J Ophthalmol. 2009; 147: 45–50.e2 [DOI] [PubMed] [Google Scholar]
- 38. Candia OA, Gerometta R, Millar JC, Podos SM. Suppression of corticosteroid-induced ocular hypertension in sheep by anecortave. Arch Ophthalmol. 2010; 128: 338–343 [DOI] [PubMed] [Google Scholar]
- 39. Stalmans I, Callanan DG, Dirks MS, et al. Treatment of steroid-induced elevated intraocular pressure with anecortave acetate: a randomized clinical trial. J Ocul Pharmacol Ther. 2012; 28: 559–565 [DOI] [PMC free article] [PubMed] [Google Scholar]
- 40. Clark AF, Steely HT, Dickerson JE Jr, et al. Glucocorticoid induction of the glaucoma gene MYOC in human and monkey trabecular meshwork cells and tissues. Invest Ophthalmol Vis Sci. 2001; 42: 1769–1780 [PubMed] [Google Scholar]
- 41. Kim BS, Savinova OV, Reedy MV, et al. Targeted disruption of the myocilin gene (Myoc) suggests that human glaucoma-causing mutations are gain of function. Mol Cell Biol. 2001; 21: 7707–7713 [DOI] [PMC free article] [PubMed] [Google Scholar]
- 42. Gould DB, Miceli-Libby L, Savinova OV, et al. Genetically increasing Myoc expression supports a necessary pathologic role of abnormal proteins in glaucoma. Mol Cell Biol. 2004; 24: 9019–9025 [DOI] [PMC free article] [PubMed] [Google Scholar]
- 43. McDowell CM, Luan T, Zhang Z, et al. Mutant human myocilin induces strain specific differences in ocular hypertension and optic nerve damage in mice. Exp Eye Res. 2012; 100: 65–72 [DOI] [PMC free article] [PubMed] [Google Scholar]
- 44. Shepard AR, Jacobson N, Millar JC, et al. Glaucoma-causing myocilin mutants require the Peroxisomal targeting signal-1 receptor (PTS1R) to elevate intraocular pressure. Hum Mol Genet. 2007; 16: 609–617 [DOI] [PubMed] [Google Scholar]
- 45. Robin AL, Weiner AL, Marsh DA. inventors; Alcon, Inc., assignee Method for treating primary and secondary forms of glaucoma. US patent US2007/0197491 A1. August 23, 2007 [Google Scholar]


