

Background: Fam57b was identified as a putative novel PPARγ target up-regulated in adipocytes and adipose tissue.
Results: Fam57b was confirmed as a novel target of PPARγ by reporter and ChIP assays. FAM57B synthesizes ceramides and inhibits adipogenesis in mouse stromal ST2 cells.
Conclusion: FAM57B regulates adipogenesis through ceramide synthesis.
Significance: This study reveals one of the pleiotropic actions of PPARγ related to ceramide metabolism.
Keywords: Adipogenesis, Ceramide, Obesity, Peroxisome Proliferator-activated Receptor (PPAR), Sphingolipid
Abstract
This report identifies a novel gene encoding Fam57b (family with sequence similarity 57, member B) as a novel peroxisome proliferator-activated receptor γ (PPARγ)-responsive transmembrane gene that is related to obesity. The gene was identified based on an integrated bioinformatics analysis of the following three expression profiling data sets: adipocyte differentiation of mouse stromal cells (ST2 cells), adipose tissues from obesity mice, and siRNA-mediated knockdown of Pparγ using ST2 cells. Fam57b consists of three variants expressed from different promoters and contains a Tram-Lag1-CLN8 domain that is related to ceramide synthase. Reporter and ChIP assays showed that Fam57b variant 2 is a bona fide PPARγ target gene in ST2 cells. Fam57b was up-regulated during adipocyte differentiation, suggesting that FAM57B is involved in this process. Surprisingly, FAM57B overexpression inhibited adipogenesis, and siRNA-mediated knockdown promoted adipocyte differentiation. Analysis of the ceramide content by lipid assay found that ceramides were in fact augmented in FAM57B-overexpressing ST2 cells. We also confirmed that ceramide inhibits adipogenesis. Therefore, the aforementioned results of FAM57B overexpression and siRNA experiments are reconciled by ceramide synthesis. In summary, we present in vitro evidence showing that PPARγ regulates Fam57b transcription during the adipogenesis of ST2 cells. In addition, our results suggest that PPARγ activation contributes to the regulation of ceramide metabolism during adipogenesis via FAM57B.
Introduction
Metabolic syndrome, which is characterized by abdominal visceral obesity and dyslipidemia, increases the risk of type 2 diabetes and cardiovascular disease through chronic systemic inflammation and insulin resistance (reviewed in Refs. 1 and 2). Obese adipose tissue secretes increased levels of proinflammatory adipokines, including tumor necrosis factor α (TNFα) (3), monocyte chemoattractant protein-1 (MCP-1) (4, 5), and interleukin-6 (IL-6) (6, 7) as well as plasminogen activator inhibitor-1 (PAI-1) (8). On the other hand, obese adipose tissue has decreased secretion of anti-inflammatory factors, such as adiponectin, resulting in chronic inflammation.
PPARγ is a member of the nuclear receptor family and is a well known master regulator of adipocyte differentiation (9–11), which has been demonstrated both in vitro and in vivo (12). PPARγ is also a target of the insulin-sensitizing synthetic ligand thiazolidinedione class of drugs, including rosiglitazone and pioglitazone (13). These chemicals decrease the expression of insulin resistance-inducing adipokines, such as TNF-α, IL-1, and resistin, and increase the production of the insulin-sensitizing hormone, adiponectin (14, 15). Unfortunately, however, these PPARγ agonists also have adverse effects, such as body weight gain, liver dysfunction, and an increased risk of heart failure (16). Thus, it is important to identify new targets of PPARγ that offer a new pathway for the pleiotropic action of PPARγ. These specific targets may provide new therapeutic options to enhance the beneficial effects of PPARγ or decrease the side effects of PPARγ. Therefore, the objective of this study was to identify PPARγ target genes with particular emphasis on secretory or transmembrane genes that are related to metabolic syndrome or obesity.
To this end, we performed a gene expression analysis of adipose tissue in obese versus lean mice. We chose genes that were up-regulated more than 2-fold in obese mice relative to lean mice and that overlapped with genes up-regulated in ST2 cells during adipogenesis. We further narrowed down the genes by selecting those that were down-regulated in ST2 cells treated with Pparγ-targeting siRNA (siPparγ). As a result, we identified 14 genes and ultimately focused on a novel gene, Fam57b (family with sequence similarity 57, member B) and analyzed its function in detail. Interestingly, FAM57B has a Tram-Lag1-CLN8 (TLC)3 domain that is related to acyl-CoA-dependent ceramide synthase (17), and this domain is present in ceramide synthases (CERS1 to CERS6) (18–23).
Ceramide functions as a second messenger in a variety of cellular events, including apoptosis and differentiation (24, 25). The ceramide levels in cells depend on the balance between the rate of ceramide synthesis and degradation. Ceramide is either produced by hydrolysis of sphingomyelin by neutral and acid sphingomyelinase (26) or synthesized de novo by serine palmitoyltransferase, followed by ceramide synthase. We hereby identified a novel PPARγ target gene, Fam57b, analyzed its function in vitro, and ultimately demonstrated that FAM57B interferes with adipogenesis by augmenting ceramide synthesis.
EXPERIMENTAL PROCEDURES
Materials
d-erythro-Sphinganine, fumonisin B1, and C20-ceramide were obtained from Cayman Chemical Co. C18-ceramide was from Toronto Research Chemicals (Ontario, Canada). C2- and C6-ceramide, palmitoyl-CoA(C16:0), stearoyl-CoA(C18:0), and diacylglycerol kinase were purchased from Sigma-Aldrich, whereas arachidoyl-CoA, behenoyl-CoA (C22:0), lignoceroyl-CoA (C24:0), and hexacosanoyl-CoA (C26:0) were obtained from Avanti Polar Lipids (Alabaster, AL), and defatted bovine serum albumin was purchased from British BioCell International, Ltd. (Cardiff, UK). SYBR Green PCR master mix and BioScript reverse transcriptase were obtained from Applied Biosystems (Bedford, MA) and Bioline (London, UK), respectively. pGL4.10, pGL4.74, and the Dual-Luciferase reporter assay system were from Promega Corp. (Madison, WI). Restriction enzymes and DNA-modifying enzymes were from either Takara Bio (Otsu, Japan) or New England Biolabs (Beverly, MA). The anti-FLAG monoclonal antibody (clone M2) and 3× FLAG peptide were from Sigma-Aldrich. Silica gel 60 thin layer chromatography plate was from Whatman (Kent, UK). All solvents were of analytical grade and were purchased from Nacalai Tesque (Kyoto, Japan). Oligonucleotides were synthesized by Sigma-Aldrich and Invitrogen. [γ-32P]ATP was obtained from PerkinElmer Life Sciences.
Expression Microarray Analysis
Total RNA was extracted from the adipose tissue of mice fed a normal diet (CE-2) or high fat diet (HFD32) (Clea, Tokyo, Japan) using a Nucleospin RNA II isolation kit (Macherey-Nagel, Düren, Germany) according to the manufacturer's instructions. Biotin-labeled cRNA was synthesized as recommended by the Affymetrix guidelines. The labeled samples were hybridized to Affymetrix GeneChip Mouse Genome 430 2.0 arrays according to the manufacturer's protocol. Scanning and intensity data analysis were performed as described previously (27). The raw data are publicly available at Gene Expression Omnibus (see the National Institutes of Health Web site) by accession number GSE36492. The data sets of ST2 cell adipocyte and siPparγ-treated ST2 cell adipocyte are publicly available at the Genome network platform (see the National Institute of Genetics (Japan) Web site).
Molecular Cloning
Mouse cDNA was used as a template to amplify Fam57b variants 1, 2, and 3 as well as the Cers2 open reading frame. A FLAG epitope was introduced at the 3′ terminus of mouse Fam57b by PCR. The PCR product was cloned into the pGcDNAsamIRES-EGFP retroviral vector (kindly provided by Masafumi Onodera (NCCHD, National Institutes of Health), and EGFP was deleted from FAM57B-pGcDNsamIRES-EGFP retroviral vectors using the ClaI and XhoI restriction enzymes. The primers used to generate the retroviral vector are described in Table 1.
TABLE 1.
Primers used for subcloning
| Primer | Sequence |
|---|---|
| pGcDNsam retrovirus cloning | |
| Fam57b_var1Fw | 5′-gctctgagaagcggccgccatgcttaccccaatggtggctgggg |
| Fam57b_var2Fw | 5′-gctctgagaagcggccgccatggccctgctcttcctgctg |
| Fam57b_var1(No tag)_Rv | 5′-acgtcgactcagtcctgggtctgacaaggagagggtg |
| Fam57b_var3Fw | 5′-gctctgagaagcggccgccatggcctccacagctggc |
| Fam57b_var1,2,3(FLAG)_Rv | 5′-cgggatccgtcctgggtctgacaaggagagggtg |
| pCMV5aFLAG_Rv | 5′-cgggatccctacttgtcatcgtcgtccttgtaatc |
| pCMV5aNotag_Rv | 5′-ttccgcggccgctactcgagacgtcgacctacttgtcatcgtcgtccttgtaatc |
| Cers2_Fw | 5′-gctctgagaagcggccgccatgctccagaccttgtatgactac |
| Cers2_Rv | 5′-ttccgcggccgctatggccgacgtcgactcagtcattcttaggatgattgttattgagg |
| Cers2FLAG_Rv | 5′-cgggatccgtcattcttaggatgattgttattgagg |
| pGL4.10 luc2 cloning | |
| Fam57b_pro1(PPRE) Fw1 | 5′-tggcctaactggccggtaccttctgaggaccagacgaggt |
| Fam57b_pro3(PPRE)Fw3 | 5′-ggggtaccctgggggtaattcagtggtg |
| Fam57b_pro5(PPRE)Rv | 5′-gaagatctctgcgtggaggattagatgtg |
| Fam57b_pro4(PPERE)Rv2 | 5′-gaagatctctgctggggttaaaggtgagt |
| Fam57b_pro3(PPRE)Rv3 | 5′-gaagatctcccgattgtcactggaacctt |
| Fam57b_pro2( PPRE)Rv4 | 5′-gaagatctcccaggtccacagctacacag |
| Fam57b_pro2(PPRE)del Fw | 5′-cagtactctgggctgggggtaattc |
| Fam57b_pro2(PPRE)del Rv | 5′-agcccagagtactgactgtcccttc |
| Fam57b_pro2(PPRE) mut1Fw | 5′-agtacttttataaagttaactgggctggg |
| Fam57b_pro2(PPRE) mut1Rv | 5′-ctttataaaagtactgactgtcccttc |
| Fam57b_pro2(PPRE) mut2Fw | 5′-gagaaattaaactgggctgggggtaattc |
| Fam57b_pro2(PPRE) mut2Rv | 5′-ccagtttaatttctcccagtactgactg |
| Fam57b _pro2-5_Fw | 5′-cggtacccagtggtgaaccaccacac |
| Fam57b_pro2_5_Rv | 5′-caccactgggtaccggccagttaggc |
Cell Culture and Infection
Mouse bone marrow-derived stromal cell line ST2 cells were obtained from the RIKEN BioResource Center (Tsukuba, Japan) and cultured as described previously (28). ST2 cells were grown in RPMI 1640 medium. 293FT cells, Plat-E cells (kindly provided by Toshio Kitamura (Institute of Medical Science)) and NIH3T3 cells were grown in Dulbecco's modified Eagle's medium (with high glucose, l-glutamine, sodium pyruvate, and pyridoxine hydrochloride). All media were supplemented with 10% fetal bovine serum (FBS), 100 IU/ml penicillin, and 100 IU/ml streptomycin. 293FT cells were cultured in medium supplemented with 500 μg/ml G418, and the culture medium for Plat-E cells was supplemented with 10 μg/ml blasticidin, 1 μg/ml puromycin, and MEM non-essential amino acids. The media and FBS were purchased from Nacalai Tesque and JRH BIO (St. Louis, MO), respectively. Cells were cultured at 37 °C with 5% CO2. Viruses were prepared as described previously (29). Briefly, Plat-E cells were transfected with a mixture of viral plasmids, and the medium was replaced 24 h post-transfection. The viral supernatants were collected at 48, 72, and 96 h and then filtered. ST2 cells were incubated with the viral supernatants for 24 h, after which the cells were cultured in normal medium and then induced to undergo adipocyte differentiation 3 days after infection.
Adipogenic Differentiation
The adipogenic differentiation of ST2 cells was induced by changing the medium to differentiation medium supplemented with 0.5 mm 3-isobutyl-1-methylxanthine, 0.25 μm dexamethasone, and insulin-transferrin-selenium-X supplement containing 5 μg/ml insulin (Invitrogen). For ST2 cells that were treated with siRNA or transduced with retrovirus to overexpress FAM57B, 1 μm and 0.1 μm rosiglitazone, respectively, was also added to the medium. After 48–72 h, the differentiation medium was replaced with normal culture medium.
Effects of Ceramide on Differentiating ST2 Cells
ST2 cells were differentiated into adipocytes using an adipogenic hormonal mixture containing 5, 10, or 25 μm C6-ceramide, 20 or 25 μm C18-ceramide, and 7 or 15 μm C20-ceramide. C6-ceramide was solubilized in 100% ethanol, whereas C18- and C20-ceramides were solubilized in a 2% dodecane-EtOH solution as described previously (30). Ethanol and dodecane-EtOH were added to the control samples to adjust the concentration to each corresponding sample. On day 6, Oil Red O staining was performed to evaluate lipid accumulation in differentiating ST2 cells.
ChIP-Quantitative Real-time PCR (qPCR) Analysis
ChIP was performed as previously described (31). ST2 cells were allowed to differentiate into adipocytes and then fixed at 2 and 6 days post-differentiation. Undifferentiated samples were also prepared and analyzed at 6 days. An anti-PPARγ antibody (Santa Cruz Biotechnology, Inc. (Santa Cruz, CA) and PPMX (Tokyo, Japan)) was used for the ChIP assays. The ChIP samples were analyzed by real-time PCR using the primer indicated in Table 2. The results were normalized to cyclophilin levels in control DNA and presented as -fold enrichment of the PPARγ binding region.
TABLE 2.
Primers used for quantitative real-time PCR
| Forward | Reverse | |
|---|---|---|
| ChIP-qPCR | ||
| Fam57b_var2_1 | 5′-tggcctaactggccggtaccttctgaggaccagacgaggt | 5′-aagatggagacgggaggact |
| Fam57b_var2_2 | 5′-aaacgtatttctgtggctcc | 5′-taagatccgattgtcactgg |
| Fam57b_var1_1 | 5′-aagagaagagccatcctttcc | 5′-gggaggcccttaaagagaca |
| Fam57b_var1_2 | 5′-tgcatcttcctcctcctgtc | 5′-gacagagcgctggtgagag |
| Fam57b_var3_1 | 5′-cgagagttcagcccctctct | 5′-atgaggtccaaggagggaag |
| Fam57b_var3_2F | 5′-caaggggcaagactgtgttt | 5′-cttaccatggccctcttcct |
| mRNA qRT-PCR | ||
| Fam57b_c2 | 5′-ggctacctgcacaaggagtt | 5′-aatctcccttgccttgtcg |
| Fam57b_var1(a) | 5′-cccggactcttcctcctatc | 5′-gcttggacagaggacaccaa |
| Fam57b_var2(a) | 5′-ctgcagaatcgaaccagctt | 5′-atgatggcttggacagagga |
| Fam57b_var3(a) | 5′-agacgcacacctgattgtca | 5′-cagccagtgctggtcatcta |
| Fam57b_var2(b) | 5′-ctgctggggtgtgtcttctt | 5′-cttgcctctccatccgtaag |
| Fam57b_var1(b) | 5′-tgcatcttcctcctcctgtc | 5′-gacagagcgctggtgagag |
| Cers2 | 5′-cgagatgctccagaccttgt | 5′-tgtcttctagatcagcccaggt |
| Cers4 | 5′-tgcgatgctctcttcatcat | 5′-cccgagttcttgatggagtc |
| Cers5 | 5′-catgccatctggtcctacct | 5′-catcactgcggtcatcctta |
| Cers6 | 5′-gggttgaactgcttctggtc | 5′-tcaatgtcactccggtcatc |
| PPARγ2 | 5′-atgggtgaaactctgggaga | 5′-gagctgattccgaagttggt |
| Adipoq | 5′-gatggcactcctggagagaa | 5′-gcttctccaggctctccttt |
| Glut4 | 5′-gacggacactccatctgttg | 5′-gccacgatggagacatagc |
| Plin1 | 5′-tgctggatggagacctc | 5′-accggctccatgctcca |
| Gapdh | 5′-tggagaaacctgccaagtatg | 5′-ggagacaacctggtcctcag |
Luciferase Reporter Assay
The Fam57b variant 2 promoter regions were cloned by PCR from the mouse genome (Table 1), and the cloned fragments were ligated into the promoterless plasmid pGL4.10 harboring the firefly luciferase gene. NIH3T3 cells were co-transfected with the firefly luciferase reporter vectors, expression vectors, and the internal control Renilla luciferase vector pGL4.74 using Lipofectamine 2000 (Invitrogen). At 24 h post-transfection, the cells were induced with 1 μm rosiglitazone for 24 h. The luciferase activity was measured using a Wallac 1420 multilabel counter (ARVO) (PerkinElmer Life Sciences). These experiments were performed more than three times.
Electrophoretic Mobility Shift Assay (EMSA)
EMSA was performed as described previously (32). DNA probes were prepared by end-labeling double-stranded oligonucleotides with T4 polynucleotide kinase and [γ-32P]ATP (6000 Ci/ml). For the second PPRE of Fam57b variant 2 (var2), wild type (WT) and mutant type 1 (mut1) sequences were prepared. The oligonucleotides used in this study are listed in Table 3. Two micrograms of nuclear extract from preadipocyte or adipocyte-differentiated ST2 cells were used for the binding reaction. After the binding reaction, the supershift assay was performed by adding 0.2 μg of a mouse monoclonal anti-PPARγ antibody (E8) (Santa Cruz) or 0.2 μg of a mouse control IgG (Santa Cruz Biotechnology, Inc.) for 20 min before loading the DNA-protein complex on a 6% native acrylamide gel in 0.5× TBE buffer.
TABLE 3.
Oligonucleotides used for EMSA
| Forward | Reverse | |
|---|---|---|
| aP2PPRE | 5′-cttcttactggatcagagttcactagtgg | 5′-ttccactagtgaactctgatccagtaaga |
| Fam57b2up_PPRE2wt | 5′-cacagtactgggagaaagttaactgggctg | 5′-cccagcccagttaactttctcccagtactg |
| Fam57b2up_PPRE2mt1 | 5′-cacagtacttttataaagttaactgggctg | 5′-cccagcccagttaactttataaaagtactg |
Isolation of Total RNA and Quantitative Real-time RT-PCR (qRT-PCR)
Total RNA was isolated and qualified as described previously (33). Gene expression level was measured by qRT-PCR as previously described (28). The sequences of the forward and reverse primers used to amplify each gene are described in Table 2.
siRNA-mediated Knockdown of Fam57b
siRNAs targeting the mouse Fam57b transcript were purchased from Invitrogen. Negative Universal Control Med#2 (Invitrogen, catalog no. 12935-112) was used as a negative control, and siPparγ was from IDT (Coralville, IA). The siRNA sequences for Fam57b are described in Table 4. For siRNA transfection, a complex of Lipofectamine 2000 and 20 nm siRNA was prepared according to the manufacturer's instructions and directly mixed with 6.4 × 10⁴ cells in 24-well culture plates. The medium was replaced at 4–6 h post-transfection with fresh differentiation medium (adipogenic induction medium).
TABLE 4.
siRNA sequences
| Forward | Reverse | |
|---|---|---|
| siFam57b-A | 5′-uauaggccgaggacagccagugcug | 5′-cagcauggcuguccucggccuaua |
| siFam57b-B | 5′-ucaacaugcagccuagaaagaaauc | 5′-gauuucuuucuaggcugcauguuga |
| siFam57b-C | 5′-uuaaccuggugcuugugccaguggc | 5′-gccacuggcacaagcaccagguuaa |
| siPparγ | 5′-aucuaauuccagugcauugaacuucac | 5′-gaaguucaaugcacuggaauuagat |
Lipid Assay
Lipid accumulation in adipocytes was detected based on Oil Red O staining, and the triglyceride content in adipocytes was determined as described previously (33, 34). ST2 cells differentiated into adipocytes with overexpressed FAM57B or with Fam57b siRNA at day 6 were fixed or extracted for further lipid assays. The ceramide content of ST2 adipocytes was determined as described previously (35). Lipids were extracted using the Bligh Dyer method, and then the ceramide content was measured using the diacylglycerol kinase method. The ceramide content was normalized to the protein levels. The extracted lipids were labeled with 32P, converting the ceramide to ceramide 1-phosphate, and then separated by a thin layer chromatography plate using the following solvents: chloroform/acetone/methanol/acetic acid/water (30:12:9:6:3). The signals were counted with a BAS5000 imaging analyzer (FUJIFILM, Tokyo, Japan). A sphingomyelinase assay was performed using a sphingomyelinase assay kit (Cayman Chemical) according to the manufacturer's instructions. Briefly, total sphingomyelinase activity was analyzed using ST2 cells overexpressing FAM57B, the same conditions as for the ceramide content analysis. All experiments were performed at least three times.
Ceramide Synthase Activity Assay
This assay was performed as described previously (20). Differentiated ST2 cells overexpressing FAM57B-FLAG or 293FT cells that had been transiently transfected with FAM57B-FLAG were washed with PBS and harvested from culture dishes using a cell scraper. After centrifuging for 4 min at 150 × g, the cell pellets were homogenized in 20 mm HEPESKOH, pH 7.4, 25 mm KCl, 250 mm sucrose, and 2 mm MgCl2 containing a protease inhibitor mixture (Nacalai Tesque), and the protein levels were measured. An anti-FLAG antibody was used to pull down FAM57B-FLAG from lysates of ST2 cells or 293FT cells overexpressing FAM57B-FLAG. The bound FAM57B-FLAG protein was released with 3× FLAG peptide according to the manufacturer's instructions. Homogenates (500 μg of protein/ml) or purified protein (5 μg of protein) were incubated with 15 μm sphingosine, 20 μm defatted-bovine serum albumin with or without 20 μm fumonisin B1 (FB1) for 5 min at 37 °C. The reaction was initiated by adding either 50 μm palmitoyl-CoA (C16), stearoyl-CoA (C18), or arachidoyl-CoA (C20) and then incubated for 1 h at 37 °C. Lipids were extracted, subjected to the diacylglycerol kinase assay, and analyzed as described above, except for the following change in the developing solvent system: CHCl3/acetone/MeOH/HOAc/H2O (50:30:10:6:3). These experiments were performed more than three times.
Animals
All mice used in this study were maintained and handled according to protocols that were approved by the Animal Research Committee of Saitama Medical University.
RESULTS
Fam57b Was Identified as a Novel PPARγ Target Gene Using a Computational Analysis
To explore novel PPARγ target genes encoding secretory or transmembrane proteins that could represent new therapeutic targets, we performed an integrative analysis of three gene expression profile data sets: 1) ST2 cell-derived adipocytes during the course of differentiation at 0, 1, 2, 3, 4, 5, 6, 8, 10, 12, and 14 days; 2) adipose tissue obtained from mice fed a high fat diet and a normal diet as a control; and 3) ST2 cells treated with siPparγ during adipogenesis and examined on day 5. A total of 642 genes were up-regulated in adipose tissue derived from mice fed a high fat diet compared with the control, 2300 were up-regulated in ST2 cell-derived adipocytes, and 517 genes were down-regulated in siPparγ-treated ST2 cells. Of these, 24 genes overlapped across the three data sets, and ultimately 14 genes were extracted as secretory or transmembrane genes using the signal peptide (SP) or transmembrane hidden Marcov method (Tmhmm) program (Fig. 1A and Table 5). Four of these genes were previously identified as PPARγ targets (Dio2, Abcg1, Pnpla2, and 1100001G20Rik) (36–38), five have been linked to lipid metabolism (Scd2, Abcg1, Pnpla2, Mosc1, and Dhcr7) (39–41), two have been related to inflammatory cells (Ltc4s and Cd53) (42, 43), and three have been identified as transmembrane proteins (Ly6h, Trfr2, Cd53, and Clstn3) (44–46). Because Fam57b has neither been functionally characterized nor previously reported but contains an interesting domain, the TLC domain, that is related to lipid metabolism (Fig. 1C) (47), we focused on this gene and performed a detailed characterization. LAG1 was first identified in yeast as essential for fatty acyl-CoA-dependent ceramide synthesis (17). Fam57b consists of three variants (variant 1 (var1), NM_029978.1; variant 2 (var2), NM_026884.1; variant 3 (var3), NM_001146347.1) that use different promoters (Fig. 1B) and have different N-terminal sequences but share a common TLC domain (Fig. 1C). Variant 3 has five whereas variants 1 and 2 have six putative transmembrane regions that were predicted using SOSUI (48). Variants 2 and 3 were experimentally shown to localize at the ER, whereas variant 1 localized at the Golgi (data not shown), which is consistent with the prediction that FAM57B is a transmembrane protein.
FIGURE 1.

Screening of PPARγ target genes that regulate metabolic disease. A, we performed an expression analysis of genes under the following three conditions: 1) genes that were up-regulated more than 2-fold in adipose tissue from mice that were fed a high fat diet (HFD) compared with a normal diet as a control (ND), 2) genes up-regulated in ST2 cells that had undergone adipogenesis, and 3) genes down-regulated in ST2 cells that had been treated with siRNA targeting Pparγ and undergone adipogenesis. The number in the Venn diagram represents the number of probes on the microarray. There were 14 common genes that contained a signal sequence and/or transmembrane region (which was screened with the signal peptide (SP) and transmembrane hidden Marcov method (Tmhmm) programs) as shown in Table 5. B, the structures of three variants of the Fam57b gene. The last four exons are common exons in these three variants. +1, transcription start site. C, the common amino acid sequence of the three FAM57B variants is indicated with a star below each amino acid, in which the lined amino acid sequence indicates the TLC domain. The sequences were obtained from the NCBI Web site.
TABLE 5.
The 14 genes extracted by the expression array based on an integrated analysis
| Gene symbol | Accession number | Description |
|---|---|---|
| Dio2 | NM_010050 | Type II iodothyronine deiodinase |
| Clstn3 | NM_153508 | Calsyntenin-3 precursor |
| Ltc4s | NM_008521 | Leukotriene C4 synthase |
| Ly6h | NM_011837 | Lymphocyte antigen 6H isoform a precursor |
| Abcg1 | NM_009593 | ATP-binding cassette sub-family G member 1 |
| Scd2 | NM_009128 | Acyl-CoA desaturase 2 |
| Pnpla2 | NM_001163689 | Patatin-like phospholipase domain-containing protein 2 isoform 1 |
| Mosc1 | NM_001081361 | MOSC domain-containing protein 1, mitochondrial |
| Lamb3 | NM_008484 | Laminin subunit β-3 precursor |
| Trfr2 | NM_015799 | Transferrin receptor protein 2 |
| Cd53 | NM_007651 | Leukocyte surface antigen CD53 |
| 1100001G20Rik | NM_183249 | WDNM1-like protein precursor |
| Dhcr7 | NM_007856 | 7-Dehydrocholesterol reductase |
| Fam57b | NM_026884 | Family with sequence similarity 57, member B |
Expression Analysis of the Three Fam57b Variants
We analyzed the gene expression profile of the Fam57b variants in ST2 cells during adipogenesis as well as in different tissues and adipose tissue derived from obese or lean mice using qRT-PCR. All three Fam57b variants were up-regulated in ST2 and 3T3L1 cells during adipogenesis (Fig. 2, A and B). An analysis of different tissues showed a distinct expression profile for each variant across different tissues (i.e. variant 1 was highly up-regulated in the brain, whereas variant 2 was highly expressed in the testis and adipose tissue) (Fig. 2D). Interestingly, only variant 2 was expressed at higher levels in the adipose tissue of epididymal fat from obese mice compared with lean mice. The expression levels of variants 1 and 3 were significantly less in obese mice compared with lean mice (Fig. 2E). Thus, it is likely that FAM57B variant 2 has an important role in adipose tissue of obese mice.
FIGURE 2.

Expression profiling of Fam57b in ST2 adipogenesis and mouse different tissues. A, samples were harvested on the indicated days after adipogenic induction, and total RNA was extracted and analyzed by real-time RT-PCR with primers targeting a common sequence (indicated by Fam57b_c2) and variant-specific sequences (indicated by Fam57b_var1, -2, and -3). As a control, samples left uninduced were also analyzed by qRT-PCR using the common sequence primers (Fam57b_c2(C)). B, 3T3L1 cells were differentiated into adipocytes, and samples were harvested on the indicated days. Total RNA was extracted and analyzed for Fam57b expression using common primers (Fam57b_c2) as well as specific primers for variants 1 and 2 (Fam57b_var1 and Fam57b_var2). C, ST2 cells were induced with rosiglitazone instead of a total adipogenic mixture and analyzed on the indicated days of differentiation. The mRNA expression of three Fam57b variants was analyzed by real-time RT-PCR as indicated above. D, the expression of the Fam57b variants in normal tissues from C57bBL/6J mice was analyzed by real-time RT-PCR with variant-specific primers. BAT, brown adipose tissue; WAT, white adipose tissue; AdreG, adrenal gland; CortB, cortical bone; Calv, calvaria; BM, bone marrow. E, the expression of the Fam57b variants was examined in adipose tissue derived from obese mice induced by a high fat diet (HFD), and from mice fed a normal diet (ND). Two different primers were used for variants 1 and 2 (a and b). Results are the means ± S.D. (error bars) (n = 3). *, p < 0.05; **, p < 0.01; ***, p < 0.001.
Fam57b Variant 2 Is a Bona Fide Novel Target of PPARγ
Because Fam57b was identified as a down-regulated gene in siPparγ-treated cells, which suggests that Fam57b is a direct target of PPARγ, we validated whether Fam57b is directly regulated by PPARγ. An in silico analysis showed that PPARγ-responsive elements (PPREs) are located near the promoter regions of all Fam57b variants (indicated with arrows in Fig. 3A). To further determine whether these PPREs are regulated by PPARγ, we performed ChIP-qPCR for the three variants using two primer sets for each variant (as shown in Fig. 3A, in which the PCR primer site is indicated with a heavy black line; see also Table 2 for primer information). Unexpectedly, the ChIP-qPCR analysis of ST2 cells during adipocyte differentiation demonstrated that only the promoter region of variant 2 was enriched by PPARγ as much as ∼20-fold compared with the input, as was Fabp4 (fatty acid-binding protein (ap2)) by ∼50-fold (Fig. 3B). These results indicate that variant 2 was occupied by PPARγ in adipocytes on days 2 and 6 post-differentiation but not in preadipocytes. Next, we performed a reporter assay with the promoter of Fam57b variant 2, which contained five candidate PPRE sequences. We cloned the promoter region of Fam57b variant 2 containing five PPREs into the pGL4.10 vector, and subclones with various deletions in this promoter were prepared (Fig. 4A). The luciferase reporter assay demonstrated that the construct containing five PPREs (pro1–5) showed up-regulation of luciferase activity by rosiglitazone. The luciferase activity was up-regulated as long as the second PPRE was present in the constructs (pro1–4, pro1–3, pro1–2, and pro2–5). Thus, only the construct with pro3–5, lacking the second PPRE, resulted in luciferase not being activated by rosiglitazone (Fig. 4B), suggesting that the second PPRE is the critical site targeted by PPARγ in response to rosiglitazone. To confirm this finding, we constructed two mutants of the second PPRE (mut1 and mut2) and one deletion of the second PPRE in the construct pro1–5 (Fig. 4A). An analysis using these constructs demonstrated that luciferase activity was not up-regulated by rosiglitazone (Fig. 4C), indicating that a novel PPRE sequence in Fam57b variant 2, GGGAGAAAGTTAA (second PPRE at −132 to −120 bp) (WT) was targeted directly by PPARγ. To further determine whether PPARγ binds directly to this sequence, we performed EMSA. As shown in Fig. 4D, a specific DNA-binding activity was detectable with the WT PPRE sequence from the Fam57b variant 2 and ap2 PPRE as probes when adipocyte nuclear extracts (Ad NE) were used (lanes 5 and 7). DNA-binding activity was not detected using preadipocyte nuclear extracts (Pread NE) (lanes 2 and 4). When either preadipocyte or adipocyte nuclear extracts were used, a distinct mobility shift in radioactivity with a mutant PPRE probe (mut1) was detectable (lanes 3 and 6, respectively), which is indicative of nonspecific DNA-binding activity. The DNA-binding activity with WT PPRE in lane 5 was supershifted with an anti-PPARγ antibody (lane 9), indicating that PPARγ binds directly to this second PPRE.
FIGURE 3.

PPARγ targets a promoter-proximal site of the Fam57b variant 2. A, the predicted PPRE sequence sites are indicated with arrows on each Fam57b promoter, and heavy lines indicate the PCR amplicons used for ChIP-qPCR, whose numbers correspond to those indicated in Table 2. B, ST2 cells that were induced into adipocytes for 2 and 6 days (A2d and A6d, respectively) as well as uninduced cells were analyzed by ChIP-qPCR as indicated. Fabp4 was used as a positive control, and the promoter site of each Fam57b variant was examined. Results are means ± S.D. (error bars) (n = 3); **, p < 0.01. +1, transcription start site.
FIGURE 4.

PPARγ binds and activates the gene promoter of Fam57b variant 2. A, schematic illustration of Fam57b variant 2 promoter and luciferase reporter construct. The five candidates for the PPRE are numbered 1–5 in the promoter region of Fam57b variant 2. These promoter sequences were inserted into the pGL4.10 promoterless reporter vector. The sequences of WT and mutant types (mut1 and mut2) for the second PPRE are indicated. B, NIH3T3 cells were transfected with the reporter vectors together with PPARγ or the control expression vector and treated with rosiglitazone (Rosi) at 24 h post-transfection for another 24 h. The cells were harvested, and luciferase activity was measured with ARVO according to the manufacturer's instructions. The luciferase activity was shown as FL/RL. FL, firefly luciferase activity was normalized by RL, renilla luciferase. C, the pro1–5 wild type (pro_wt), pro1–5 mutants 1 and 2 (pro_mut1 and pro_mut2), and pro1–5 PPRE2 deleted (pro_del) were analyzed as described above. D, EMSA was performed using a 32P-labeled oligonucleotide containing the above second PPRE WT and mut1 of Fam57b var2 promoter and ap2 PPRE as a positive control. The labeled probes were incubated with nuclear extracts of adipocytes (Ad NE) and preadipocytes (Pread NE) of ST2 cells as a negative control. For the supershift assay, the adipocyte nuclear extract was preincubated with labeled WT or ap2 PPRE and then incubated with an anti-PPARγ antibody or mouse IgG for 20 min. The DNA-protein complexes were resolved by PAGE. Lane 1, free probe; lanes 2–4, WT, mut1, and ap2 PPRE with preadipocyte nuclear extract, respectively; lanes 5–7, WT, mut1, and ap2 PPRE with adipocyte nuclear extract, respectively; lanes 8 and 10, WT and ap2 with mouse IgG and Ad NE, respectively; lanes 9 and 11, WT and ap2 PPRE with PPARγ-specific antibody and adipocyte nuclear extract, respectively. Results are means ± S.D. (error bars) (n = 3).
Overexpressing or Knocking Down FAM57B in ST2 Cells Affects Adipocyte Differentiation
Because Fam57b is up-regulated during adipogenesis, we hypothesized that FAM57B promotes adipogenesis. To verify the in vitro effects of FAM57B on adipogenesis, we cloned three Fam57b variants with and without a C-terminal FLAG tag in a retroviral vector (with IRES-EGFP) and then overexpressed these variants in ST2 cells and assessed the effect on day 6 after adipocyte differentiation. The expression of each FAM57B-FLAG variant (var1F, -2F, and -3F) in ST2 cells was confirmed by Western blotting on day 6 of adipocyte differentiation (Fig. 5A).
FIGURE 5.

Adipocyte differentiation of ST2 cells is inhibited by overexpression of FAM57B. A, ST2 cells overexpressing FAM57B-FLAG were analyzed on day 6 of adipocyte differentiation by Western blotting using an anti-FLAG antibody. B, ST2 cells were infected with retroviruses expressing three different FAM57B variants. Three days after infection, adipogenesis was induced by replacing the medium with fresh medium containing an adipogenic mixture as indicated under “Experimental Procedures.” On day 6 of differentiation, the cells were fixed and stained with Oil Red O in which lipids are stained red, at a magnification of ×10. Scale bar, 100 μm. C, triglyceride (TG) content of ST2 cells expressing the FAM57B variants was analyzed on day 6 of adipogenesis. D, mRNA level of adipocyte markers was analyzed by qRT-PCR. E, we measured the Fam57b mRNA levels in ST2 cells overexpressing each FAM57B variant. F, ST2 cells overexpressing FAM57B var3 were treated with MG132 at the indicated concentrations for 6–12 h. The cells were harvested and subjected to Western blot analysis using anti-FLAG and anti-β-actin antibodies. Results are means ± S.D. (error bars) (n = 3); *, p < 0.05; **, p < 0.01; ***, p < 0.001.
Surprisingly, ST2 cells overexpressing FAM57B variants 1 and 2 exhibited strongly decreased Oil Red O staining (Fig. 5B). This staining pattern was also observed using FLAG-tagged var1F and var2F FAM57B (data not shown). Further analysis demonstrated that the triglyceride content and mRNA expression levels of mature adipocyte markers, notably Pparγ2, adiponectin (AdipoQ), perilipin 1 (Plin1), and glucose transporter 4 (Glut4), were all decreased (Fig. 5, C and D). Overexpressing variant 3 (var3 and var3F) did not result in significant changes in the triglyceride content, Oil Red O staining, or expression level of mature adipocyte markers (Fig. 5, B–D).
Next, we knocked down Fam57b using three sets of siRNAs (A, B, and C) targeting a common sequence within the Fam57b variants (Fig. 1B). As shown in Fig. 6A, the knockdown efficiency of each siRNA varied from ∼70 to 90% on day 2 post-transfection. The Oil Red O staining was slightly increased in ST2 cells treated with each Fam57b siRNA compared with the negative control (Fig. 6B). We further confirmed that the triglyceride content (Fig. 6C) and the expression of adipocyte markers Pparγ2, AdipoQ, Plin1 (also a lipid droplet marker), and Glut4 were all up-regulated (Fig. 6D).
FIGURE 6.

Adipogenic differentiation is promoted by Fam57b down-regulation in ST2 cells. A, ST2 cells were transfected with three classes of Fam57b siRNA (siFam57b-A, -B, and -C) targeting a common site in all of the Fam57b variants. Non-targeting control siRNA (siNC) and Pparγ siRNA (siPparγ) were used as a negative and positive control, respectively. At 6 h post-transfection, adipogenesis was induced, and total RNA was extracted from the cells on day 2. The knockdown efficiency on day 2 of differentiation was analyzed by real-time RT-PCR. B, ST2 cells were treated with siRNA and adipogenic induction and then fixed and stained with Oil Red O on day 6. Magnification was ×10. Scale bar, indicates 100 μm. C, the triglyceride (TG) content was analyzed on day 6 of differentiation. D, markers of adipocyte differentiation were analyzed on day 6 of differentiation by qRT-PCR. Pparγ, AdipoQ and Glut4 were used as mature adipocyte markers, and perilipin 1 (Plin1) was used as a lipid droplet marker. Results are means ± S.D. (error bars) (n = 3); *, p < 0.05; **, p < 0.01; ***, p < 0.001.
Overexpressing FAM57B Augments the Total Ceramide Content in ST2 Cells
FAM57B variants have a TLC domain that is related to ceramide synthase. On the one hand, it is reported that C6-ceramide inhibits adipogenesis using D1 cells (49); here, we confirmed that C6-ceramide also inhibited adipogenesis in ST2 cells (Fig. 7, A and B). Because overexpressing FAM57B variants 1 and 2 suppressed adipogenesis, we hypothesized that FAM57B could be involved in ceramide synthesis. To evaluate this hypothesis, we analyzed the ceramide content of ST2 cells that were differentiated into adipocytes with each FAM57B variant overexpression. As expected, overexpressing variants 1 and 2, but not variant 3, resulted in an increase in the total ceramide levels (Fig. 7C). siRNA-mediated knockdown of Fam57b, however, did not decrease the ceramide content (Fig. 7D, left panel). We considered that this is because other ceramide synthases, such as CERS isoforms 1–6, could function in a compensatory manner to maintain constant ceramide levels. We confirmed that the mRNA expression levels of Cers2, -4, -5, and -6 (Cers isoforms that were detectable in ST2 cells) were significantly increased by siFam57b (Fig. 7E). Therefore, we repeated the knockdown experiment using FB1, an inhibitor of ceramide synthase, to reduce the effects of other CERS isoforms. FB1 was added 5 days after siFam57b treatment and the induction of adipogenesis, and the ceramide levels were measured on day 6. As expected, the addition of FB1 decreased the ceramide levels with siFam57b treatment (Fig. 7D), indicating that FAM57B has ceramide synthesis activity.
FIGURE 7.

Total ceramide content is augmented in ST2 cells overexpressing FAM57B. A, ST2 cells were treated with the indicated concentration of C6-ceramide during adipogenesis and then stained with Oil Red O on day 6 of differentiation. The Oil Red O that accumulated in lipid droplets was extracted with isopropyl alcohol and measured at OD 535 nm. B, the triglyceride content was measured on day 6 of adipogenesis and is presented as the triglyceride levels normalized to the protein levels and the control. C, ST2 cells overexpressing each FAM57B variant with (var1F–var3F) and without FLAG (var1–var3) were differentiated into adipocytes for 6 days. Total lipids were extracted from cell lysates containing 200 μg of protein and subjected to the diacylglycerol kinase assay that enzymatically phosphorylates and labels lipids with 32P (Ceramide-1-[32P]), as described under “Experimental Procedures.” The samples were spotted onto thin layer chromatography plates and developed in organic solvents (bottom panel). The ceramide levels were digitized by measuring the band intensity with an Image analyzer (Image Gauge version 3.4, FUJIFILM), normalized to the protein levels, and then expressed relative to the control (EGFP-expressing cells). γ2 represents the ceramide levels that accumulated upon PPARγ overexpression as a positive control. The experiment was performed at least three times. D, the ceramide content of siFam57b-A treated ST2 cells was examined in a similar manner with or without 20 μm FB1, a ceramide synthase inhibitor, which was added from day 5 to 6 of differentiation. The ceramide levels were measured 6 days after differentiation using 100 μg of protein. The relative ceramide levels between siNC and siFam57b are shown for both conditions with and without FB1. E, ST2 cells were treated with siRNA (siNC and siFam57b-A, -B, and -C) and induced to undergo adipogenesis. On day 6, total RNA was extracted and analyzed by qRT-PCR. The mRNA expression of Cers2, -4, -5, and -6 was measured using the primer sets listed in Table 2. Results are means ± S.D. (error bars) for three individual experiments. *, p < 0.05; **, p < 0.01; ***, p < 0.001.
FAM57B Has Ceramide Synthase Activity
We first examined if the increase in ceramide by overexpressing each of the FAM57B variants attributed to the increase in Cers or increased sphingomyelinase activity.
There were no differences in the mRNA levels of Cers isoform 2, 5 or 6, although Cers4 mRNA was down-regulated, in ST2 cells overexpressing each FAM57B variant compared with the control (Fig. 8A). There were also no differences in the total sphingomyelinase activity (Fig. 8B). Therefore, we further examined if the FAM57B protein has ceramide synthase activity. In vitro ceramide synthesis was assessed using fatty acyl-CoA with different acyl chain lengths, including C16, C18, C20, and C22, as substrates. We used CERS2 as a positive control, which uses mainly C20, C22, and C24 as substrates. The ceramide synthase assay using extracts of ST2 cells overexpressing each FAM57B variant (var1, -2, and -3) showed that overexpression of FAM57B variant 2 markedly increased the amount of C16-, C18-, and C20-ceramides compared with the control (Fig. 9A).
FIGURE 8.

FAM57B overexpression does not affect the mRNA expression levels of ceramide synthase or sphingomyelinase activity. A, the mRNA expression levels of four ceramide synthases (Cers2, -4, -5, and -6) in differentiated FAM57B-overexpressing ST2 cells on day 6 were analyzed by qRT-PCR. B, the total sphingomyelinase activity was analyzed in differentiated FAM57B-overexpressing ST2 cells on day 6 using a sphingomyelinase assay kit. Results are means ± S.D. (error bars) for three individual experiments. *, p < 0.05; **, p < 0.01; ***, p < 0.001.
FIGURE 9.

Ceramide synthase activity of the FAM57B protein. A, in vitro ceramide synthase activity was measured using differentiated ST2 cell extracts (50 μg of protein), which overexpressed each FAM57B variant (var1–var3) with different substrates, such as palmitoyl-CoA (C16:0), stearoyl-CoA (C18:0), arachidoyl-CoA (C20:0), and behenoyl-CoA (C22:0). B, an in vitro ceramide synthase assay was performed using undifferentiated FAM57B-FLAG or ceramide synthase 2-FLAG (CERS2F)-overexpressed ST2 cell extracts (50 μg of protein) that were preincubated with or without 20 μm FB1, followed by adding C18-acyl-CoA as substrate. C, in vitro ceramide synthase activity with or without fumonisin B1 was assayed using 293FT cell extracts (50 μg of protein), which transiently overexpressed FAM57B var2F or CERS2F. D, ST2 cells overexpressing CERS2F, EGFP, or FAM57B-F (each variant) were immunoprecipitated (IP) with an anti-FLAG antibody, which was released with 3× FLAG peptide, and subjected to Western blot analysis (WB) using an anti-FLAG antibody. E, in vitro ceramide synthase activity was measured using purified FAM57B-FLAG protein (var1F–var3F) and CERS2F, with different substrates, such as C16-, C18- and C20-acyl-CoA. Results are representative of three independent experiments.
We further determined if ceramide synthase activity was blocked with fumonisin B1 using ST2 or 293FT cells that overexpress each variant of FAM57B (Fig. 9, B and C). As shown in Fig. 9B, FAM57B variants 1 and 2 (var1F and var2F) as well as CERS2 augmented the ceramide levels, and this augmentation was inhibited by fumonisin B1, indicating that FAM57B (at least variants 1 and 2) has ceramide synthase activity.
We purified each FAM57B-FLAG variant and CERS2-FLAG to further confirm if FAM57B has ceramide synthase activity. The identity of the purified protein was confirmed by Western blotting as shown in Fig. 9D. As shown in Fig. 9E, FAM57B variant 2 (var2F) drastically increased the levels of C16-, C18-, and C20-ceramides. Variant 1 (var1F) slightly increased the levels of C18- and C20-ceramides, and variant 3 (var3F) only minimally increased these ceramides.
Ceramide Inhibits Adipogenesis
The variant-specific control of FAM57B in the synthesis of ceramides contributed to the blockade of adipogenesis. These results prompted us to analyze whether C18- or C20-ceramides could inhibit adipogenesis. As shown in Fig. 10, adipogenesis was inhibited by treating ST2 cells with C18- or C20-ceramides. A statistical analysis showed a significant reduction in adipogenesis and triglyceride levels upon the addition of each ceramide in a dose-dependent manner (Fig. 10, B and C), indicating the possible involvement of FAM57B in adipogenesis mediated by ceramide production.
FIGURE 10.

Effect of C18- and C20-ceramide on ST2 adipogenesis. A, ST2 cells were treated with 20 μm C18-ceramide (C18-cer), or 15 μm C20-ceramide (C20-cer) during adipogenesis. The cells were stained with Oil Red O on day 6 of differentiation. Scale bar, 100 μm. B, the Oil Red O, which accumulated in lipid droplets, was extracted with isopropyl alcohol and measured at OD 535 nm. C, ST2 cells were treated with 20 or 25 μm C18-ceramide and 7 μm or 15 μm C20-ceramide during adipogenesis. The relative triglyceride levels were measured on day 6 of differentiation and normalized to the total protein levels. *, p < 0.05; **, p < 0.01; ***, p < 0.001. Error bars, S.D.
DISCUSSION
In this study, we performed an in vitro functional analysis of a novel gene, Fam57b, that was identified as a PPARγ target gene and involved in obesity by an integrated analysis of three data sets: adipose tissue of HFD/CD, ST2 adipocytes, and Pparγ knockdown ST2 cells. Interestingly, FAM57B consists of three variants and has a TLC domain that is related to ceramide synthase. Because ceramide metabolism is dysregulated and augmented in the plasma during obesity and is related to insulin resistance (50, 51), we analyzed the relationship between FAM57B and ceramide and the effects of FAM57B on adipogenesis. We demonstrated that only FAM57B variant 2 is directly targeted by PPARγ and could regulate adipogenesis through ceramide metabolism.
Fam57b variant 2 was up-regulated during adipogenesis and by rosiglitazone treatment (Fig. 2, A and C). The variant 2 was up-regulated slowly starting on day 2 until day 6 and then down-regulated on day 10 (Fig. 2, A and B) (data not shown). These results suggested that the appropriate timing of Fam57b expression is important in adipogenesis.
We demonstrated that Fam57b variant 2 is a direct target of PPARγ by ChIP-qPCR (Fig. 3B), reporter assay (Fig. 4, B and C), and EMSA (Fig. 4D). In the ChIP-qPCR assay, the PCR product of the variant 2 promoter sequence was significantly concentrated by an anti-PPARγ antibody, whereas that of variants 1 and 3 was less concentrated (Fig. 3B), indicating that the putative PPRE of the variant 2 promoter is the major target of PPARγ. Based on a reporter assay, the specific region of the variant 2 promoter was also identified as PPRE, and direct binding of PPARγ to this specific target sequence was further confirmed by EMSA (Fig. 4D). Interestingly, higher luciferase activity was observed when the downstream region of the transcription start site of Fam57b variant 2 was deleted, suggesting that the expression of Fam57b variant 2 could be negatively regulated by this region.
Although variant 2 is a direct target of PPARγ, the restricted expression at later stages of adipogenesis awaits further clarification. Variants 1 and 3 were also up-regulated during adipogenesis to a different degree compared with variant 2 (i.e. variant 1 was up-regulated more slowly than variant 2, and variant 3 was relatively low throughout adipogenesis). The expression of variant 1 reached the same level at day 6 after adipogenic induction (Fig. 2A). However, Fam57b variant 1 is unlikely to be regulated by PPARγ (Fig. 2C) but rather by other transcription factors related to adipogenesis. Alternatively, we cannot rule out the possibility that PPARγ might be involved in the expression of variants 1 and 3 in the distal region of the Fam57b gene promoter along with other transcription factors. Further investigation is required to elucidate the roles of these factors.
When tissue expression was analyzed, there was a distinct expression profile among the three variants in which variant 1 was up-regulated mainly in the brain, whereas variant 2 was expressed in the testis and adipose tissue and variant 3 was only weakly expressed in all tissues (Fig. 2D). This tissue-specific expression could indicate that each variant has important roles in individual tissues.
The role of each FAM57B variant in adipogenesis was demonstrated using overexpression and siRNA knockdown assays. Variants 1 and 2 inhibited adipogenesis, whereas variant 3 had little effect on adipogenesis. The differential effects of the three variants might reflect the expression level of each variant, in which the protein expression of variant 2 was the highest, whereas variant 3 was the lowest, although the mRNA levels of overexpressed variants 1, 2, and 3 were comparably high (Fig. 5E). The protein level of variant 3 was recovered by treating with the proteasome inhibitor MG132 (Fig. 5F). Therefore, the reduced effects of FAM57B variant 3 on adipogenesis could be explained by the reduced expression of variant 3 as a result of protein degradation. These results suggest that variants 1 and 2 have roles in regulating adipogenesis.
The ability of FAM57B variant 2 to inhibit adipogenesis could be explained by the augmented ceramides that we attributed to this variant. Indeed, we demonstrated that C6-, C18-, or C20-ceramides inhibited the adipogenesis of ST2 cells (Figs. 7, A and B, and 10). This phenomenon is also consistent with previous reports that C6-ceramide treatment inhibited adipogenesis in D1 murine mesenchymal stem cells (49). On the other hand, ceramide levels reportedly decrease with adipogenesis (52), and we have reproduced this phenomenon in ST2 cells (data not shown), suggesting that the decrease in ceramide levels is necessary during adipogenesis.
Because FAM57B has a TLC domain and overexpression of FAM57B augmented ceramide levels, we hypothesized that FAM57B variant 2 acts as a ceramide synthase. Although variant 2 does not show high homology to classic ceramide synthase (CERS), we demonstrated experimentally using FAM57B variant 2-overexpressing cells and purified FAM57B protein that variant 2 augmented ceramides in vitro. Thus, we concluded that FAM57B variant 2 plays a role in de novo synthesis of ceramide.
Variant 1 also has ceramide synthase activity. Indeed, variant 1 inhibited adipogenesis, augmented ceramide levels, and exhibited ceramide synthase activity in vitro using ST2 cell extracts overexpressing variant 1 and with purified protein. The preference of substrates is probably different between variant 1 and variant 2. Variant 2 uses C16, C18, and C20, whereas variant 1 uses C18 and C20 but not C16 acyl-CoA. On the other hand, variant 3 had little effect on adipogenesis, and the ceramide content did not apparently change with ST2 cell extracts overexpressing variant 3 and in purified protein. This relatively low effect may be attributed to protein instability.
Although Fam57b is a regulatory target of PPARγ, Pparγ2 expression was decreased upon FAM57B overexpression (Fig. 5D), suggesting that FAM57B acts as a negative feedback factor. In fact, the idea is strikingly supported by the significant augmentation of Pparγ2 gene expression as well as that of other adipogenesis markers by knocking down Fam57b (Fig. 6D). Because the FAM57B protein is distributed in the ER and Golgi (data not shown), it is unlikely that FAM57B directly inhibits the expression of PPARγ. However, a previous report showed that C2-ceramide inhibited adipogenesis by decreasing the transcriptional activity of C/EBPβ and PPARγ expression (53). Hence, we thought that PPARγ expression was decreased through FAM57B-mediated regulation of ceramides.
Because FAM57B overexpression resulted in an increase in ceramides followed by an inhibition of adipogenesis, we speculate that the decrease in ceramides upon FAM57B knockdown could promote adipogenesis. As expected, adipogenesis was promoted by knocking down FAM57B; however, unexpectedly the total ceramide levels did not decrease, probably due to the compensation of ceramides by other ceramide synthases (Fig. 7E). Because ceramides have a sphingolipid backbone and are metabolized to biologically active substances, such as sphingosine 1-phosphate, which can promote adipogenesis (54), ceramides are thought to serve as precursors for other bioactive sphingolipids. Altogether, we conclude that ceramides are important for adipogenesis. However, excess ceramides inhibit adipogenesis, indicating that ceramide levels should be tightly regulated, and FAM57B could play a role in this fine-tuned regulation (Fig. 11).
FIGURE 11.
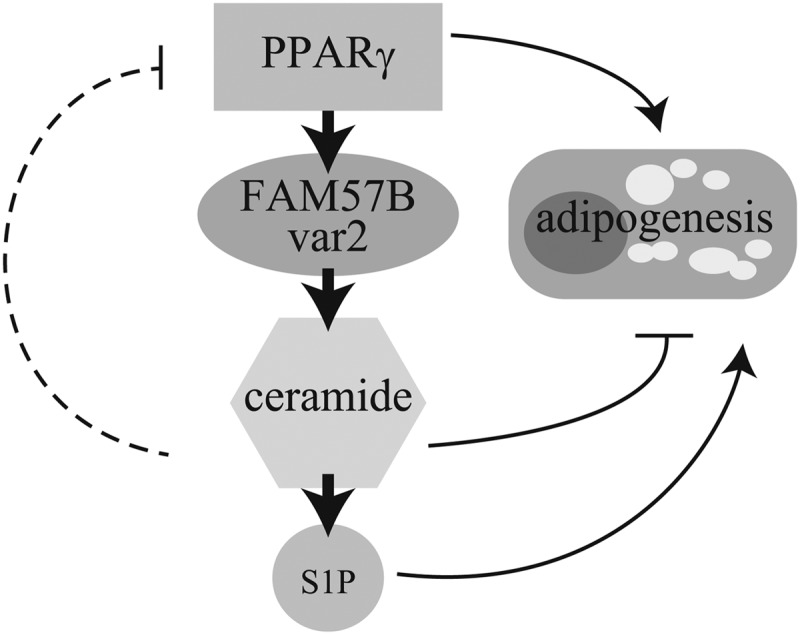
The proposed role of FAM57B in adipogenesis. PPARγ directly controls FAM57B var2 expression, and consequently FAM57B synthesizes ceramides during adipogenesis. PPARγ is the master regulator of adipogenesis. FAM57B also regulates adipogenesis through ceramide metabolism. High ceramide levels could inhibit adipogenesis, whereas low levels might promote adipogenesis by being converted to sphingosin 1-phosphate (S1P), which is another sphingolipid that promotes adipogenesis and generally works contrary to ceramides.
Recent evidence demonstrated that sphingolipid metabolism is dysregulated in obesity (50, 51). Pharmacological and genetic approaches have shown that decreased ceramide synthesis results in improved insulin sensitivity in rodent models of insulin resistance (54). These authors hypothesized that ceramide generated and secreted from visceral adipose tissue could contribute to insulin resistance in the liver and muscle. Our findings also showed that Fam57b variant 2 is up-regulated in obese adipose tissue (Fig. 2E). This increased expression may contribute in part to the augmented ceramide levels in adipose tissue and subsequently to insulin resistance. On the other hand, Fam57b variants 1 and 3 were down-regulated in obese adipose tissue. Therefore, the function of these variants in obesity is probably different from that of variant 2. Thus, it would be interesting to further analyze the relationship between FAM57B and ceramides in obese adipose tissues. The mechanism by which variant 2 is up-regulated in obese adipose tissue also remains to be clarified. Recently, it was reported that PPARγ phosphorylation increases in obese adipose tissue, resulting in the up-regulation of lipid metabolism-related genes (55). Fam57b variant 2 might also be regulated by phosphorylated PPARγ. As another possibility, a transcription factor, such as NF-κB, that is induced in obese tissue due to inflammation might contribute to the up-regulation because NF-κB-binding sites were identified in the promoter region of Fam57b variant 2 using an in silico analysis.
In conclusion, we demonstrated that a novel PPARγ target gene, Fam57b variant 2, regulates adipocyte differentiation with ceramide as an effector (Fig. 11). Our findings suggested a new pathway of PPARγ-mediated ceramide metabolism and may offer new therapeutic targets for obesity or metabolic syndrome.
Acknowledgments
We thank Masafumi Onodera for providing the retroviral vector and Toshio Kitamura for providing Plat-E cells. We greatly appreciate the technical assistance of Mioko Iseki and are grateful to Yuichi Ninomiya and Hiroyoshi Iseki for critical suggestions for the experiments. We thank Toshiwo Andoh for critically reading the manuscript and all members of the laboratory for suggestions and advice in writing the manuscript.
This work was supported in part by a grant-in-aid for the “Genome Network Project” (to Y. O.) and “Support Project of Strategic Research Center in Private Universities” from the Ministry of Education, Culture, Sports, Science, and Technology (MEXT) (to Saitama Medical University Research Center for Genomic Medicine).
- TLC
- Tram-Lag1-CLN8
- CERS
- ceramide synthase
- PPRE
- PPARγ-responsive element
- qPCR
- quantitative real-time PCR
- qRT-PCR
- quantitative real-time RT-PCR
- FB1
- fumonisin B1
- EGFP
- enhanced green fluorescent protein.
REFERENCES
- 1. Bonora E., Brangani C., Pichiri I. (2008) [Abdominal obesity and diabetes]. G. Ital. Cardiol. 9, 40S–53S [PubMed] [Google Scholar]
- 2. Després J. P., Lemieux I. (2006) Abdominal obesity and metabolic syndrome. Nature 444, 881–887 [DOI] [PubMed] [Google Scholar]
- 3. Hotamisligil G. S., Shargill N. S., Spiegelman B. M. (1993) Adipose expression of tumor necrosis factor-α. Direct role in obesity-linked insulin resistance. Science 259, 87–91 [DOI] [PubMed] [Google Scholar]
- 4. Gerhardt C. C., Romero I. A., Cancello R., Camoin L., Strosberg A. D. (2001) Chemokines control fat accumulation and leptin secretion by cultured human adipocytes. Mol. Cell. Endocrinol. 175, 81–92 [DOI] [PubMed] [Google Scholar]
- 5. Sartipy P., Loskutoff D. J. (2003) Monocyte chemoattractant protein 1 in obesity and insulin resistance. Proc. Natl. Acad. Sci. U.S.A. 100, 7265–7270 [DOI] [PMC free article] [PubMed] [Google Scholar]
- 6. Hutley L., Prins J. B. (2005) Fat as an endocrine organ. Relationship to the metabolic syndrome. Am. J. Med. Sci. 330, 280–289 [DOI] [PubMed] [Google Scholar]
- 7. Fried S. K., Bunkin D. A., Greenberg A. S. (1998) Omental and subcutaneous adipose tissues of obese subjects release interleukin-6. Depot difference and regulation by glucocorticoid. J. Clin. Endocrinol. Metab. 83, 847–850 [DOI] [PubMed] [Google Scholar]
- 8. Ozel Demiralp D., Aktas H., Akar N. (2008) The effect of plasminogen activator inhibitor-1–675 4G/5G polymorphism on PAI-1 gene expression and adipocyte differentiation. Clin. Appl. Thromb. Hemost. 14, 438–446 [DOI] [PubMed] [Google Scholar]
- 9. Tontonoz P., Hu E., Graves R. A., Budavari A. I., Spiegelman B. M. (1994) mPPAR γ 2. Tissue-specific regulator of an adipocyte enhancer. Genes Dev. 8, 1224–1234 [DOI] [PubMed] [Google Scholar]
- 10. Tontonoz P., Hu E., Spiegelman B. M. (1994) Stimulation of adipogenesis in fibroblasts by PPAR γ 2, a lipid-activated transcription factor. Cell 79, 1147–1156 [DOI] [PubMed] [Google Scholar]
- 11. Chawla A., Schwarz E. J., Dimaculangan D. D., Lazar M. A. (1994) Peroxisome proliferator-activated receptor (PPAR) γ. Adipose-predominant expression and induction early in adipocyte differentiation. Endocrinology 135, 798–800 [DOI] [PubMed] [Google Scholar]
- 12. Gray S. L., Dalla Nora E., Vidal-Puig A. J. (2005) Mouse models of PPAR-γ deficiency. Dissecting PPAR-γ's role in metabolic homoeostasis. Biochem. Soc. Trans. 33, 1053–1058 [DOI] [PubMed] [Google Scholar]
- 13. Lehmann J. M. (1995) An antidiabetic thiazolidinedione is a high affinity ligand for peroxisome proliferator-activated receptor γ (PPARγ). J. Biol. Chem. 270, 12953–12956 [DOI] [PubMed] [Google Scholar]
- 14. Sharma A. M., Staels B. (2007) Review. Peroxisome proliferator-activated receptor γ and adipose tissue. Understanding obesity-related changes in regulation of lipid and glucose metabolism. J. Clin. Endocrinol. Metab. 92, 386–395 [DOI] [PubMed] [Google Scholar]
- 15. Trujillo M. E., Scherer P. E. (2006) Adipose tissue-derived factors. Impact on health and disease. Endocr. Rev. 27, 762–778 [DOI] [PubMed] [Google Scholar]
- 16. Lipscombe L. L., Gomes T., Lévesque L. E., Hux J. E., Juurlink D. N., Alter D. A. (2007) Thiazolidinediones and cardiovascular outcomes in older patients with diabetes. JAMA 298, 2634–2643 [DOI] [PubMed] [Google Scholar]
- 17. Schorling S., Vallée B., Barz W. P., Riezman H., Oesterhelt D. (2001) Lag1p and Lac1p are essential for the Acyl-CoA-dependent ceramide synthase reaction in Saccharomyces cerevisae. Mol. Biol. Cell 12, 3417–3427 [DOI] [PMC free article] [PubMed] [Google Scholar]
- 18. Mizutani Y., Kihara A., Igarashi Y. (2005) Mammalian Lass6 and its related family members regulate synthesis of specific ceramides. Biochem. J. 390, 263–271 [DOI] [PMC free article] [PubMed] [Google Scholar]
- 19. Venkataraman K., Riebeling C., Bodennec J., Riezman H., Allegood J. C., Sullards M. C., Merrill A. H., Jr., Futerman A. H. (2002) Upstream of growth and differentiation factor 1 (uog1), a mammalian homolog of the yeast longevity assurance gene 1 (LAG1), regulates N-stearoyl-sphinganine (C18-(dihydro)ceramide) synthesis in a fumonisin B1-independent manner in mammalian cells. J. Biol. Chem. 277, 35642–35649 [DOI] [PubMed] [Google Scholar]
- 20. Riebeling C., Allegood J. C., Wang E., Merrill A. H., Jr., Futerman A. H. (2003) Two mammalian longevity assurance gene (LAG1) family members, trh1 and trh4, regulate dihydroceramide synthesis using different fatty acyl-CoA donors. J. Biol. Chem. 278, 43452–43459 [DOI] [PubMed] [Google Scholar]
- 21. Mizutani Y., Kihara A., Igarashi Y. (2006) LASS3 (longevity assurance homologue 3) is a mainly testis-specific (dihydro)ceramide synthase with relatively broad substrate specificity. Biochem. J. 398, 531–538 [DOI] [PMC free article] [PubMed] [Google Scholar]
- 22. Pan H., Qin W. X., Huo K. K., Wan D. F., Yu Y., Xu Z. G., Hu Q. D., Gu K. T., Zhou X. M., Jiang H. Q., Zhang P. P., Huang Y., Li Y. Y., Gu J. R. (2001) Cloning, mapping, and characterization of a human homologue of the yeast longevity assurance gene LAG1. Genomics 77, 58–64 [DOI] [PubMed] [Google Scholar]
- 23. Wang B., Shi G., Fu Y., Xu X. (2007) Cloning and characterization of a LASS1-GDF1 transcript in rat cerebral cortex. Conservation of a bicistronic structure. DNA Seq. 18, 92–103 [DOI] [PubMed] [Google Scholar]
- 24. Perry D. K., Hannun Y. A. (1998) The role of ceramide in cell signaling. Biochim. Biophys. Acta 1436, 233–243 [DOI] [PubMed] [Google Scholar]
- 25. Gulbins E. (2003) Regulation of death receptor signaling and apoptosis by ceramide. Pharmacol. Res. 47, 393–399 [DOI] [PubMed] [Google Scholar]
- 26. Marchesini N., Hannun Y. A. (2004) Acid and neutral sphingomyelinases. Roles and mechanisms of regulation. Biochem. Cell Biol. 82, 27–44 [DOI] [PubMed] [Google Scholar]
- 27. Irizarry R. A., Bolstad B. M., Collin F., Cope L. M., Hobbs B., Speed T. P. (2003) Summaries of Affymetrix GeneChip probe level data. Nucleic Acids Res. 31, e15. [DOI] [PMC free article] [PubMed] [Google Scholar]
- 28. Mizuno Y., Yagi K., Tokuzawa Y., Kanesaki-Yatsuka Y., Suda T., Katagiri T., Fukuda T., Maruyama M., Okuda A., Amemiya T., Kondoh Y., Tashiro H., Okazaki Y. (2008) miR-125b inhibits osteoblastic differentiation by down-regulation of cell proliferation. Biochem. Biophys. Res. Commun. 368, 267–272 [DOI] [PubMed] [Google Scholar]
- 29. Morita S., Kojima T., Kitamura T. (2000) Plat-E. An efficient and stable system for transient packaging of retroviruses. Gene Ther. 7, 1063–1066 [DOI] [PubMed] [Google Scholar]
- 30. Chalfant C. E., Kishikawa K., Mumby M. C., Kamibayashi C., Bielawska A., Hannun Y. A. (1999) Long chain ceramides activate protein phosphatase-1 and protein phosphatase-2A. Activation is stereospecific and regulated by phosphatidic acid. J. Biol. Chem. 274, 20313–20317 [DOI] [PubMed] [Google Scholar]
- 31. Wakabayashi K., Okamura M., Tsutsumi S., Nishikawa N. S., Tanaka T., Sakakibara I., Kitakami J., Ihara S., Hashimoto Y., Hamakubo T., Kodama T., Aburatani H., Sakai J. (2009) The peroxisome proliferator-activated receptor γ/retinoid X receptor α heterodimer targets the histone modification enzyme PR-Set7/Setd8 gene and regulates adipogenesis through a positive feedback loop. Mol. Cell. Biol. 29, 3544–3555 [DOI] [PMC free article] [PubMed] [Google Scholar]
- 32. Tomaru T., Steger D. J., Lefterova M. I., Schupp M., Lazar M. A. (2009) Adipocyte-specific expression of murine resistin is mediated by synergism between peroxisome proliferator-activated receptor γ and CCAAT/enhancer-binding proteins. J. Biol. Chem. 284, 6116–6125 [DOI] [PMC free article] [PubMed] [Google Scholar]
- 33. Tokuzawa Y., Yagi K., Yamashita Y., Nakachi Y., Nikaido I., Bono H., Ninomiya Y., Kanesaki-Yatsuka Y., Akita M., Motegi H., Wakana S., Noda T., Sablitzky F., Arai S., Kurokawa R., Fukuda T., Katagiri T., Schönbach C., Suda T., Mizuno Y., Okazaki Y. (2010) Id4, a new candidate gene for senile osteoporosis, acts as a molecular switch promoting osteoblast differentiation. PLoS Genet. 6, e1001019. [DOI] [PMC free article] [PubMed] [Google Scholar]
- 34. Yagi K., Kondo D., Okazaki Y., Kano K. (2004) A novel preadipocyte cell line established from mouse adult mature adipocytes. Biochem. Biophys. Res. Commun. 321, 967–974 [DOI] [PubMed] [Google Scholar]
- 35. Chavez J. A., Summers S. A. (2003) Characterizing the effects of saturated fatty acids on insulin signaling and ceramide and diacylglycerol accumulation in 3T3-L1 adipocytes and C2C12 myotubes. Arch. Biochem. Biophys. 419, 101–109 [DOI] [PubMed] [Google Scholar]
- 36. Kim J. Y., Tillison K., Lee J. H., Rearick D. A., Smas C. M. (2006) The adipose tissue triglyceride lipase ATGL/PNPLA2 is downregulated by insulin and TNF-α in 3T3-L1 adipocytes and is a target for transactivation by PPARγ. Am. J. Physiol. Endocrinol. Metab. 291, E115–E127 [DOI] [PubMed] [Google Scholar]
- 37. Nakachi Y., Yagi K., Nikaido I., Bono H., Tonouchi M., Schönbach C., Okazaki Y. (2008) Identification of novel PPARγ target genes by integrated analysis of ChIP-on-chip and microarray expression data during adipocyte differentiation. Biochem. Biophys. Res. Commun. 372, 362–366 [DOI] [PubMed] [Google Scholar]
- 38. Fiorito M., Torrente I., De Cosmo S., Guida V., Colosimo A., Prudente S., Flex E., Menghini R., Miccoli R., Penno G., Pellegrini F., Tassi V., Federici M., Trischitta V., Dallapiccola B. (2007) Interaction of DIO2 T92A and PPARγ2 P12A polymorphisms in the modulation of metabolic syndrome. Obesity 15, 2889–2895 [DOI] [PubMed] [Google Scholar]
- 39. Christianson J. L., Nicoloro S., Straubhaar J., Czech M. P. (2008) Stearoyl-CoA desaturase 2 is required for peroxisome proliferator-activated receptor γ expression and adipogenesis in cultured 3T3-L1 cells. J. Biol. Chem. 283, 2906–2916 [DOI] [PubMed] [Google Scholar]
- 40. Neve E. P., Nordling A., Andersson T. B., Hellman U., Diczfalusy U., Johansson I., Ingelman-Sundberg M. (2012) Amidoxime reductase system containing cytochrome b5 type B (CYB5B) and MOSC2 is of importance for lipid synthesis in adipocyte mitochondria. J. Biol. Chem. 287, 6307–6317 [DOI] [PMC free article] [PubMed] [Google Scholar]
- 41. Xu L., Mirnics K., Bowman A. B., Liu W., Da J., Porter N. A., Korade Z. (2012) DHCEO accumulation is a critical mediator of pathophysiology in a Smith-Lemli-Opitz syndrome model. Neurobiol Dis. 45, 923–929 [DOI] [PMC free article] [PubMed] [Google Scholar]
- 42. Wang J. L., Ren Z. Y., Xia J. B., Huang S., Qi M. H., Wang L. M., Ye J. (2011) [The mechanism of airway inflammation in eosinophilic bronchitis and cough variant asthma]. Zhonghua Jie He He Hu Xi Za Zhi 34, 433–437 [PubMed] [Google Scholar]
- 43. Nair S., Lee Y. H., Rousseau E., Cam M., Tataranni P. A., Baier L. J., Bogardus C., Permana P. A. (2005) Increased expression of inflammation-related genes in cultured preadipocytes/stromal vascular cells from obese compared with non-obese Pima Indians. Diabetologia 48, 1784–1788 [DOI] [PMC free article] [PubMed] [Google Scholar]
- 44. Horie M., Okutomi K., Taniguchi Y., Ohbuchi Y., Suzuki M., Takahashi E. (1998) Isolation and characterization of a new member of the human Ly6 gene family (LY6H). Genomics 53, 365–368 [DOI] [PubMed] [Google Scholar]
- 45. Poli M., Luscieti S., Gandini V., Maccarinelli F., Finazzi D., Silvestri L., Roetto A., Arosio P. (2010) Transferrin receptor 2 and HFE regulate furin expression via mitogen-activated protein kinase/extracellular signal-regulated kinase (MAPK/Erk) signaling. Implications for transferrin-dependent hepcidin regulation. Haematologica 95, 1832–1840 [DOI] [PMC free article] [PubMed] [Google Scholar]
- 46. Hintsch G., Zurlinden A., Meskenaite V., Steuble M., Fink-Widmer K., Kinter J., Sonderegger P. (2002) The calsyntenins. A family of postsynaptic membrane proteins with distinct neuronal expression patterns. Mol. Cell Neurosci. 21, 393–409 [DOI] [PubMed] [Google Scholar]
- 47. Winter E., Ponting C. P. (2002) TRAM, LAG1 and CLN8. Members of a novel family of lipid-sensing domains?. Trends. Biochem. Sci. 27, 381–383 [DOI] [PubMed] [Google Scholar]
- 48. Hirokawa T., Boon-Chieng S., Mitaku S. (1998) SOSUI. Classification and secondary structure prediction system for membrane proteins. Bioinformatics 14, 378–379 [DOI] [PubMed] [Google Scholar]
- 49. Xu F., Yang C. C., Gomillion C., Burg K. J. (2010) Effect of ceramide on mesenchymal stem cell differentiation toward adipocytes. Appl. Biochem. Biotechnol. 160, 197–212 [DOI] [PubMed] [Google Scholar]
- 50. Yang G., Badeanlou L., Bielawski J., Roberts A. J., Hannun Y. A., Samad F. (2009) Central role of ceramide biosynthesis in body weight regulation, energy metabolism, and the metabolic syndrome. Am. J. Physiol. Endocrinol. Metab. 297, E211–E224 [DOI] [PMC free article] [PubMed] [Google Scholar]
- 51. Samad F., Badeanlou L., Shah C., Yang G. (2011) Adipose tissue and ceramide biosynthesis in the pathogenesis of obesity. Adv. Exp. Med. Biol. 721, 67–86 [DOI] [PubMed] [Google Scholar]
- 52. Choi K. M., Lee Y. S., Choi M. H., Sin D. M., Lee S., Ji S. Y., Lee M. K., Lee Y. M., Yun Y. P., Hong J. T., Yoo H. S. (2011) Inverse relationship between adipocyte differentiation and ceramide level in 3T3-L1 cells. Biol. Pharm. Bull. 34, 912–916 [DOI] [PubMed] [Google Scholar]
- 53. Sprott K. M., Chumley M. J., Hanson J. M., Dobrowsky R. T. (2002) Decreased activity and enhanced nuclear export of CCAAT-enhancer-binding protein beta during inhibition of adipogenesis by ceramide. Biochem. J. 365, 181–191 [DOI] [PMC free article] [PubMed] [Google Scholar]
- 54. Holland W. L., Brozinick J. T., Wang L. P., Hawkins E. D., Sargent K. M., Liu Y., Narra K., Hoehn K. L., Knotts T. A., Siesky A., Nelson D. H., Karathanasis S. K., Fontenot G. K., Birnbaum M. J., Summers S. A. (2007) Inhibition of ceramide synthesis ameliorates glucocorticoid-, saturated-fat-, and obesity-induced insulin resistance. Cell. Metab. 5, 167–179 [DOI] [PubMed] [Google Scholar]
- 55. Choi J. H., Banks A. S., Estall J. L., Kajimura S., Boström P., Laznik D., Ruas J. L., Chalmers M. J., Kamenecka T. M., Blüher M., Griffin P. R., Spiegelman B. M. (2010) Anti-diabetic drugs inhibit obesity-linked phosphorylation of PPARγ by Cdk5. Nature 466, 451–456 [DOI] [PMC free article] [PubMed] [Google Scholar]