

Background: Mn(II) plays a role in cellular defense against oxidative stress.
Results: The Mn(II) speciation in D. radiodurans cells has been determined in situ.
Conclusion: Manganese superoxide dismutase is the predominant Mn(II) species and is likely to be more important than small Mn(II) complexes for regulating superoxide.
Significance: This work establishes a method for studying Mn(II) speciation and homeostasis in intact cells.
Keywords: Electron Paramagnetic Resonance (EPR), ENDOR Spectroscopy, Manganese, Oxidative Stress, Superoxide Dismutase (SOD), Deinococcus radiodurans, High Field EPR, Manganese Homeostasis, Radiation Resistance
Abstract
High magnetic field high frequency electron paramagnetic resonance techniques were used to measure in situ Mn(II) speciation in Deinococcus radiodurans, a radiation-resistant bacteria capable of accumulating high concentrations of Mn(II). It was possible to identify and quantify the evolution of Mn(II) species in intact cells at various stages of growth. Aside from water, 95-GHz high field electron nuclear double resonance showed that the Mn(II) ions are bound to histidines and phosphate groups, mostly from fructose-1,6-bisphosphate but also inorganic phosphates and nucleotides. During stationary growth phase, 285-GHz continuous wave EPR measurements showed that histidine is the most common ligand to Mn(II) and that significant amounts of cellular Mn(II) in D. radiodurans are bound to peptides and proteins. As much as 40% of the total Mn(II) was in manganese superoxide dismutase, and it is this protein and not smaller manganese complexes, as has been suggested recently, that is probably the primary defense against superoxide.
Introduction
Although metallomics has become a well established field, there are only a few methods for measuring in situ cellular metal speciation. We have used high magnetic field (3 and 10 teslas) high microwave frequency (95–285 GHz) electron paramagnetic resonance (HFEPR)3 spectroscopy to identify and measure Mn(II) species in intact cells of Deinococcus radiodurans, a bacteria well known for its resistance to ionizing radiation (1–4). D. radiodurans belongs to a group of diverse organisms that are capable of accumulating very high concentrations of Mn(II), as much as 30 mm (5–8). This high manganese content is thought to be associated with nonenzymatic reactions that protect the organisms against toxic reactive oxygen species (6–8). For example, in vitro Mn(II) carbonate exhibits catalase-like activity (9), whereas Mn(II) phosphates can dismutate superoxide (10, 11). However, an understanding of the in vivo relevance of such reactions has been elusive because little is known about the cellular Mn(II) speciation. Daly et al. (12) examined how manganese is distributed in various cellular fractions of D. radiodurans. They found that the majority of cellular Mn(II) existed as small complexes, but were unable to address the identity and quantity of the Mn(II) bound to proteins and other macromolecules. They found that Mn(II)-containing protein-free cellular extracts of D. radiodurans protect Escherichia coli and human cells against γ-radiation. This has led to the proposal that radioresistance is mediated by Mn(II)-(inorganic) phosphate-metabolite complexes that specifically protect cytosolic proteins against ionizing radiation (12). Such ex vivo approaches can help identify potential complexes that may be present in the cells, but they disrupt cellular integrity, which invariably leads to changes in intracellular equilibrium concentrations affecting manganese speciation. This is a general problem that plagues metal speciation and homeostasis studies that can be avoided by direct spectroscopic measurements on intact organisms (13).
Electron paramagnetic resonance (EPR) techniques are particularly effective at detecting and discriminating Mn(II) species. McNaughton et al. (14) recently demonstrated that Mn(II) ions with inorganic phosphate and water ligands could be detected in viable yeast cells using 35-GHz pulse electron nuclear double resonance (ENDOR). Manganese ENDOR detects the magnetic nuclei, such as proton, phosphorus, and nitrogen, around the metal center. We have used 95-GHz ENDOR and 285-GHz EPR to measure Mn(II) speciation in intact D. radiodurans cells. The use of higher frequencies and magnetic fields not only has the advantage of increased sensitivity and resolution, but also leads to the simplification of Mn(II) EPR and ENDOR spectra (15). The in vivo Mn(II) distribution was conserved by rapid freezing to liquid nitrogen temperatures and measurements made at 6 or 23 K. In this way, it has been possible to measure Mn(II) speciation in situ at different phases of growth. These growth phase-dependent differences also helped us to assign more precisely the species involved.
EXPERIMENTAL PROCEDURES
Samples
D. radiodurans R1 cells were grown at 30 °C in 2× TGY medium, and the optical density (OD) was followed at 600 nm (16). The cells were harvested by centrifugation (5 min, 3000 × g) and washed three times with 50 mm Tris-HCl, pH 7.8, and 150 mm NaCl. The cell suspension was then loaded into the appropriate sample holder. For the 285-GHz measurements, it was place in a plastic sample tube (Nalgene, 2-ml cryotube) and centrifuged (5 min, 3000 × g) in a fixed angle rotor. The supernatant was discarded, and the cell pellet (∼400 μl) was resuspended with 200 μl of buffer to achieve optimal volume and geometry. For the 95-GHz measurements, a standard quartz sample tube (Bruker, bottom-beaded 95-GHz sample tube) was completely filled with the cell suspension. The cells were compacted by placing the sample tube in a larger 15-ml plastic tube and centrifuging (2 min, 1000 × g) in a fixed angle rotor. Because the resulting cell pellet (∼2 μl) optimally filled the microwave cavity, there was no need to remove the supernatant. The quartz sample tube was then mounted onto its holder. In both cases, the samples were immediately frozen in liquid nitrogen and stored at 200 K until use. They were submersed into liquid nitrogen before being loaded in the usual manner (17) into the precooled spectrometer cryostats (see below) poised below 100 K. In this way, the cell samples remained well frozen at all times. To test freezing resistance, samples from exponential and stationary phase cultures were thawed back to room temperature and plated on 1% agar-TGY medium. After 48 h, the number of colonies was counted and compared with control samples treated in the same way but kept in ice instead of frozen. Viability after freezing and thawing was more that 80%.
Manganese solutions were prepared using Mn(ClO4)2·6H2O, contained 10–20% glycerol, 100 mm NaCl, and were adjusted to pH 7.0 ± 0.5. Glycerol significantly improved the resolution of the EPR spectra. For in vitro studies on DNA, E. coli genomic DNA (8.5 ± 1.7-bp fragments, contaminant-free, Sigma-Aldrich) was used. It was washed several times with 5 mm EDTA in water followed by a water wash to eliminate the EDTA. DNA with an effective nucleotide concentration of ∼5 mm was incubated 10 min with 100 μm Mn(II) and 10% glycerol and frozen in liquid nitrogen. Mn(II) concentration in the 2× TGY medium was estimated to be ∼2 μm by EPR spin quantification.
HFEPR
The 285-GHz CW-HFEPR spectra were taken at 23 K on a locally built HFEPR spectrometer (17) under nonsaturating conditions using 2–10-Gauss modulations depending on the nature of the species. The 95-GHz ENDOR spectra were taken at 6 K using a Bruker ELEXSYS II 680 EPR spectrometer equipped with a Bruker Power Upgrade 2, 500-watt Amplifier Research radiofrequency amplifier and an Oxford Instruments CF935 flow cryostat. The ENDOR spectra were obtained by microwave excitation of the highest field hyperfine line. Davies ENDOR (18) measurements were composed of a 200-ns microwave preparation and 20-μs radiofrequency pulses followed by a two-pulse echo detection (100- and 200-ns microwave pulses separated by 600 ns). Phase cycled three-pulse Mims ENDOR (19) measurements were composed of two 20-ns microwave pulses separated by 300 ns followed by a 20-μs radiofrequency pulse and a final 20-ns microwave pulse. ENDOR spectra were obtained by exciting the highest Mn(II) hyperfine resonance.
31P Ligand Quantitation
Using the ligand counting method described by Potapov and Goldfarb (20), we reproduced their results for the 1:1 MnADP and the 1:1 MnATPγS complexes, using instead ATP (100 μm Mn(II) and 100 μm ATP) for the latter (32). These corresponded to one and two 31P nuclei, respectively. The intensities of 31P resonances normalized to the integrated intensities of their respective 55Mn resonances were consistent with the Potapov and Goldfarb (20) ligand counting method.
SOD Quantitation
Before the MnSOD contributions to the D. radiodurans 285-GHz CW-HFEPR spectra were determined, a gaussian fit of a broad background contribution was subtracted from each. The resulting spectra were normalized to their double integrals (the data were obtained as derivatives of the absorption). An E. coli MnSOD spectrum (21) was used as a model to calculate by least squares analysis the MnSOD content of each spectrum.
RESULTS AND DISCUSSION
Fig. 1A shows the broadband NMR spectra, obtained by 95-GHz ENDOR spectroscopy, of phosphorus and proton nuclei near the Mn(II) ions in intact cells of D. radiodurans from cultures at exponential (OD600 = 0.4) or stationary (OD600 = 2.0) growth phase. As a consequence of the high magnetic fields used and judicious selection of temperatures (22), they are simpler and more resolved than the previous 35-GHz yeast spectra (14). At the 31P resonance frequency (58 MHz), the 95-GHz D. radiodurans Davies ENDOR spectra had an intense pair of resonances split by 4.3 MHz, similar to the pair reported for yeast (14) (Fig. 1, A and B). This splitting is caused by the interaction between the magnetic moments of the 31P nuclei and Mn(II) unpaired electrons, known as the hyperfine interaction. Its magnitude was consistent with direct phosphate ligation (23). A small 280-kHz hyperfine coupling was also detected corresponding to more distant (>5 Å) 31P nuclei probably residing on nearby nonligating phosphate groups. These resonances were more clearly seen using the Mims ENDOR technique (Fig. 1B, inset) (19). The ENDOR spectra of a number of different Mn(II) phosphates (Fig. 1B) were separately measured to identify the chemical origin of the cell resonances. These included orthophosphate, pyrophosphate, glucose 6-phosphate, fructose 6-phosphate, fructose 1,6-bisphosphate (Fru-1,6-BP), ADP, and ATP. Only the 31P resonances of Mn(II) bound to Fru-1,6-BP, one of the most abundant phosphate metabolites in the cell (24), matched both the large and the small hyperfine splittings. However, it did not completely account for the shape of the cell resonances. The inner part required Mn(II) bound to an orthophosphate-like component. The outer shoulders of the cell spectra corresponded to a relatively large hyperfine coupling of 7 MHz. In biological samples, such a large splitting has only been observed for Mn(II) bound to hammerhead ribozyme (23). A similar coupling could be reproduced using isolated DNA (Fig. 1B, purple trace). Hence, it appears to be unique to Mn(II) bound to nucleotides. The DNA spectrum also had a smaller coupling (∼250 kHz). Least squares fits of cell ENDOR spectra using only the spectra Fru-1,6-BP, DNA, and orthophosphate yielded excellent results that even accounted for the amplitude of the smaller hyperfine couplings (Fig. 1B). The relative contribution was 52% Fru-1,6-BP, 24% DNA, and 20% orthophosphates. The orthophosphate component very likely included the various other inorganic phosphate complexes, including those of polyphosphates and ATP, because their ENDOR spectra were nearly indistinguishable. From ligand counting analysis, each cellular Mn(II) was found to have an average of 0.8 ± 0.5 phosphate ligands during exponential growth phase (OD = 0.4) that increased to 1.8 ± 0.8 in late stationary phase (OD = 2.0).
FIGURE 1.

95-GHz Mn(II) ENDOR spectra of D. radiodurans. A, the broadband spectra of intact cells from cultures grown to OD = 0.4 and 2.0 and their difference spectrum. The labels indicate the resonance position of the detected nuclei. B, the 31P region of OD = 0.4 cells and its least squares fit composed of the frozen solution spectra of 50 μm Mn(II): in 100 mm Fru-1,6-BP (52%, green); in 10 mm orthophosphate (20%, orange); and with DNA (24%, purple). The OD = 0.4 sample Mims ENDOR spectrum of the small 280-kHz resonance is shown in the inset. C and D, the 1H regions and their decomposition into their respective water and imidazole components as compared with those of 50 μm Mn(II) by itself ([Mn(H2O)6]2+) (dotted trace over the water component) and in 500 mm imidazole ([Mn(imidazole)n]2+) (dotted trace over the imidazole component). The arrow indicates the region used to quantitate the number of water ligands.
By contrast, the intensity of the 1H region, centered at 144 MHz, of the ENDOR spectra (Fig. 1A) decreased as cells went from exponential to stationary growth phase. The outer shoulders of 1H ENDOR spectra of the cells closely resembled those of [Mn(H2O)6]2+, extending beyond ±3.7 MHz about the center (Fig. 1, C and D). For this reason, these regions were assigned to water ligands. The spectra of the cells were normalized to that of the [Mn(H2O)6]2+ at the position indicated by the arrow in Fig. 1, C and D. The intensity at this position corresponded to 4.5 ± 0.5 water ligands per detected Mn(II) in OD = 0.4 cells and 3.8 ± 0.5 in OD = 2.0 cells. Using this information, it was possible to arithmetically decompose the cell spectra into two components (Fig. 1, C and D, cyan and green traces). As expected, the broader component was essentially the same as the spectrum of [Mn(H2O)6]2+, whereas the narrower one closely resembled the 1H ENDOR spectrum of [Mn(imidazole)n]2+ obtained from a solution of 50 μm Mn(II) in 500 mm imidazole. Consequently, this latter component was assigned to histidine ligands. Histidine ligation appeared to steadily increase, but the change was within the estimated error, and on average, each detected Mn(II) ion had about 0.7 ± 0.5 histidine ligands regardless of the culture OD.
Significant histidine ligation was also confirmed by 285-GHz CW-HFEPR spectroscopy. Exponential growth phase spectra were dominated by a single set of six sharp 55Mn hyperfine lines that closely resembled those of [Mn(H2O)6]2+ (Fig. 2A) centered at a g-value of 2.00107 ± 0.00004 with a 55Mn hyperfine coupling, A55Mn, of 263 ± 5 MHz. As the cells entered stationary phase, a second set of six resonances, with g = 2.00100 ± 0.00004 and A55Mn = 256 ± 5 MHz, appeared that became nearly as intense as the first. This stationary phase spectrum could be closely mimicked by the combined spectra of Mn(II) in Fru-1,6-BP and Mn(II) in imidazole solutions (Fig. 2B). The sharp cellular imidazole resonances could not be replicated with any other common metabolites or free amino acids and were absent in the spectrum of Mn(II) ions in a solution containing both Fru-1,6-BP and imidazole (or histidine). This strongly suggested that the stationary phase centers were not due to simple free histidine ligation. Because the ENDOR spectra showed that imidazole ligands were present at all stages of growth, the appearance of these centers during stationary phase was probably the result of a redistribution of histidine ligands. Preliminary imidazole titration measurements show that the 285-GHz CW-EPR spectra progressively changed as more imidazoles ligate the Mn(II) ions, the new species in the OD = 2.0 cells having about two imidazoles bound to each Mn(II) ion.
FIGURE 2.
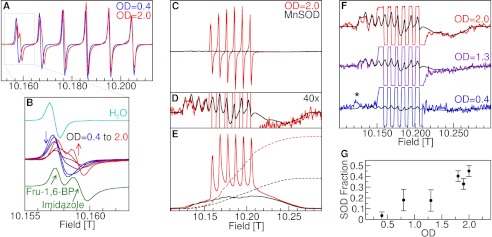
The 285-GHz CW-HFEPR Mn(II) spectra of intact cells of D. radiodurans. A, the progression from OD = 0.4–2.0 of the sharp six-line component. B, the shape of the lowest field hyperfine line (centered at 10.158 teslas) of the same component as compared with the spectra of [Mn(H2O)6]2+ and a sample containing physically separate solutions of Mn(II) (50 μm) in 100 mm Fru-1,6-BP and 30 mm imidazole. C, the complete Mn(II) spectra of D. radiodurans (red) and the least squares fit of the E. coli MnSOD spectrum to its broad component. D, 40× vertical expansion of both better showing the broad MnSOD spectrum. E, the corresponding absorption spectra obtained by numerical integration and their integrals (dashed lines) showing the relative Mn(II) content in both. F, the least squares fits of the E. coli MnSOD spectrum to the D. radiodurans broad components at different growth stages. The OD = 0.4 fit in panel F represents the upper limit or about 5% of the total observed Mn(II) HFEPR intensity, and the asterisk indicates a reproducible non-Mn(II) signal that has yet to be assigned. G, the MnSOD fraction as a function growth stage.
More remarkable was the progressive growth of a much broader set of resonances that exactly matched the unique fingerprint of the five-coordinate manganese center in MnSOD (Fig. 2, C–E) (21, 25). Because the 285-GHz CW-HFEPR spectra were obtained as derivatives of the absorption with respect to magnetic field, the sharp six-line component visually dominated the cell spectra because each of the six lines was over 20 times narrower than the SOD component (Fig. 2, C and D). However, integrating the spectrum to obtain the absorption spectra corrected for this bias (Fig. 2E), showing the true intensity relationship between the two components. At OD = 0.4, the MnSOD signal was just at the detection limit constituting at most 5% of total HFEPR Mn(II) intensity, but afterward rapidly increased to about 40% (Fig. 2, F–G).
This level of MnSOD in D. radiodurans in exponential phase cells is consistent with previous measurements. Intracellular E. coli Fe/MnSOD has been estimated to be 3500 units/ml (26) or about 40 μm of MnSOD monomer (4500 units/mg, molecular mass 20,500 Da). Because D. radiodurans has been shown to express at least five times more SOD than E. coli (2), it is expected to have about 200 μm MnSOD or about 7% of the total cellular Mn(II), measured to be about 3 mm (6). This amounts to ∼7000 copies of SOD per cell out of the ∼1.1 × 10⁵ manganese atoms present in a cell (6) as compared with the 10–60 times larger E. coli cell (27) that holds about 20,000 copies of FeSOD and 10,000 of MnSOD (28).
Fig. 3 summarizes how the ligand sphere around Mn(II) ions evolves. In early phases, water is the dominant ligand. It is steadily replaced by phosphates and, more importantly, histidines coming from MnSOD and an as yet unidentified peptide or protein possessing the distinct CW-HFEPR spectrum. ENDOR spectra show that histidine ligation is present at all stages of growth, whereas the progression in the CW-HFEPR spectra suggests a change from predominantly single histidine to two histidine-bound centers.4 Because these centers as well as those that have phosphate ligands are also likely to have water ligands, there was little room for any significant amounts of free [Mn(H2O)6]2+ ions in the stationary phase cells.
FIGURE 3.

Schematic representation of the Mn(II) ligand sphere in D. radiodurans cells. A, growth curve of D. radiodurans. B, the Mn(II) ligand sphere as a function of the OD. Each plot is divided into regions showing the average ligand fraction per Mn(II) “(see under ”Results and Discussion“). The inner green circle represents the fraction of MnSOD.
Regardless of the exact nature of these Mn(II) species, the freezing process itself did not affect their concentrations. Thawing and refreezing a sample of stationary phase cells demonstrated this. After thawing, the cells were 80% viable (see “Experimental Procedures”), and the 285-GHz spectra taken after refreezing were essentially the same as the originally frozen ones. However, we cannot rule out the possibility that the equilibria involving the smaller species shifted in response to lower temperatures. This is unlikely to be an issue for the tightly bound manganese in MnSOD, the major manganese species in stationary cells. What is missing from our analysis is absolute quantitation of the species involved. The total Mn(II) concentration of the samples was estimated to be 200 μm, consistent with previous measurements for whole cells (12). The integrated intensities of the spectra of acid-digested and intact cells indicated that the amount of unobserved pools of Mn(II), if any, was insignificant. Moreover, it has been shown (29) that no significant levels of Mn(III) or Mn(IV) are present in D. radiodurans. Therefore our measurements accounted for the vast majority of the manganese present inside the cell.
The results summarized in Fig. 3 provide a global picture of Mn(II) speciation. There is clear evidence that although Mn(II) binds to phosphates and other low molecular weight ligands as reported previously (12, 14), a significant amount is bound to proteins. In particular, MnSOD accounts for 10–40% of the total Mn(II) present in D. radiodurans. This raises the question whether small Mn(II) complexes play a major role as superoxide scavengers in vivo in this and other organisms. Given the considerably lower superoxide scavenging efficiency of Mn(II) phosphates (10, 11) as compared with MnSOD, it seems unlikely that this is the case. They may, however, be involved in other antioxidant processes, which may explain why protein-free extracts of D. radiodurans (12) have a protective effect. Sod-null mutants of D. radiodurans are 3–90 times more sensitive to ionizing radiation than the wild type (30). Increases in superoxide concentration are, however, only one of a number of consequences of ionizing radiation (31). Therefore other enzymes and smaller molecular complexes may be required to achieve full resistance. This is consistent with the finding that Mn(II) is essential for this process (6). In addition to MnSOD, the cells produce significant amounts of a histidine-ligated Mn(II) metallopeptide/protein that is specific to the stationary phase. Its identity and importance, if any, require further investigation. Because so much of the Mn(II) is bound to protein, it may be difficult to discern the contribution of small molecular weight Mn(II) complexes by measuring radio resistance as a function of Mn(II) concentration because this would also affect Mn(II) protein levels.
The detection of manganese bound to Fru-1,6-BP and nucleotides was somewhat unexpected. However, in fact, cellular Fru-1,6-BP concentration is very high as compared with other phosphates (24). More intriguingly, its concentration reflects both the pentose phosphate and the glycolytic pathways. The former has been shown to be an antioxidant sensor (32). Hence, the levels of Mn(II) Fru-1,6-BP may reflect the cellular oxidative balance. Nucleotides in the form of DNA are also present in a high concentration, and isolated D. radiodurans DNA has been found to contain significant amounts of Mn(II) (5). Crystallographic studies show that the Mn(II) can bind to DNA directly to phosphate backbone or the N-7 of atoms of guanosines or indirectly to the phosphates through intervening water molecules (33, 34). The large observed 31P coupling in the cell ENDOR spectra is consistent with direct binding to phosphate groups. Whether this is indicative of binding to DNA or other nucleotides requires further investigation and comparison with other organisms.
Such a detailed accounting of a metal ion in situ has rarely been achieved. By coupling ENDOR and CW-HFEPR and high magnetic fields, a unique in situ view of manganese speciation has been obtained. The magnetic resonance techniques we have described are generalizable to other organisms. We are obtaining similar quality data even from intact seeds. Beyond speciation, one intriguing prospect is the use of these techniques in conjunction with transport and regulatory mutants (35, 36) to probe manganese regulatory mechanisms. An intriguing possibility is to couple the ex vivo and in situ approaches in conjunction with classical metallomic methods to obtain a more comprehensive quantitative outcome. This is being undertaken.
Acknowledgments
The D. radiodurans strain was a generous gift of S. Sommer. We are grateful to G. W. Canters, A. Krieger-Liszkay, S. Thomine, and F. Leach for useful comments and discussions. We also thank E. Bruch for the viability assays. We are especially grateful to Pierre Legrain for the support and encouragement without which this project would not have been possible.
This work was partially financed by the Agence Nationale de la Recherche (Contract Number 2011 BSV5 013 01) and CNRS (Programme “Interface PCB”) and the spectrometers were funded by the Région Ile-de-France (Programme Sesame), CEA, and CNRS.
MnSOD spectrum at 95 GHz is much broader than at 285 GHz; consequently and for other technical reasons, MnSOD does not contribute to the ENDOR spectra.
- HFEPR
- high field electron paramagnetic resonance
- CW-HFEPR
- continuous wave HFEPR
- ENDOR
- electron nuclear double resonance
- SOD
- superoxide dismutase
- Fru-1,6-BP
- fructose 1,6-bisphosphate
- ATPγS
- adenosine 5′-O-(thiotriphosphate)
- OD
- optical density
- TGY
- Triptone glucose yeast extract.
REFERENCES
- 1. Daly M. J. (2009) A new perspective on radiation resistance based on Deinococcus radiodurans. Nat. Rev. Microbiol. 7, 237–245 [DOI] [PubMed] [Google Scholar]
- 2. Slade D., Radman M. (2011) Oxidative stress resistance in Deinococcus radiodurans. Microbiol. Mol. Biol. Rev. 75, 133–191 [DOI] [PMC free article] [PubMed] [Google Scholar]
- 3. Blasius M., Sommer S., Hübscher U. (2008) Deinococcus radiodurans: what belongs to the survival kit? Crit. Rev. Biochem. Mol. Biol. 43, 221–238 [DOI] [PubMed] [Google Scholar]
- 4. Cox M. M., Battista J. R. (2005) Deinococcus radiodurans – the consummate survivor. Nat. Rev. Microbiol. 3, 882–892 [DOI] [PubMed] [Google Scholar]
- 5. Leibowitz P. J., Schwartzberg L. S., Bruce A. K. (1976) The in vivo association of manganese with the chromosome of micrococcus radiodurans. Photochem. Photobiol. 23, 45–50 [DOI] [PubMed] [Google Scholar]
- 6. Daly M. J., Gaidamakova E. K., Matrosova V. Y., Vasilenko A., Zhai M., Venkateswaran A., Hess M., Omelchenko M. V., Kostandarithes H. M., Makarova K. S., Wackett L. P., Fredrickson J. K., Ghosal D. (2004) Accumulation of Mn(II) in Deinococcus radiodurans facilitates γ-radiation resistance. Science 306, 1025–1028 [DOI] [PubMed] [Google Scholar]
- 7. Horsburgh M. J., Wharton S. J., Karavolos M., Foster S. J. (2002) Manganese: elemental defence for a life with oxygen. Trends Microbiol. 10, 496–501 [DOI] [PubMed] [Google Scholar]
- 8. Archibald F. S., Fridovich I. (1981) Manganese and defenses against oxygen toxicity in Lactobacillus plantarum. J. Bacteriol. 145, 442–451 [DOI] [PMC free article] [PubMed] [Google Scholar]
- 9. Berlett B. S., Chock P. B., Yim M. B., Stadtman E. R. (1990) Manganese(II) catalyzes the bicarbonate-dependent oxidation of amino acids by hydrogen peroxide and the amino acid-facilitated dismutation of hydrogenperoxide. Proc. Natl. Acad. Sci. U.S.A. 87, 389–393 [DOI] [PMC free article] [PubMed] [Google Scholar]
- 10. Barnese K., Gralla E. B., Cabelli D. E., Valentine J. S. (2008) Manganous phosphate acts as a superoxide dismutase. J. Am. Chem. Soc. 130, 4604–4606 [DOI] [PubMed] [Google Scholar]
- 11. Barnese K., Gralla E. B., Valentine J. S., Cabelli D. E. (2012) Biologically relevant mechanism for catalytic superoxide removal by simple manganese compounds. Proc. Natl. Acad. Sci. U.S.A. 109, 6892–6897 [DOI] [PMC free article] [PubMed] [Google Scholar]
- 12. Daly M. J., Gaidamakova E. K., Matrosova V. Y., Kiang J. G., Fukumoto R., Lee D.-Y., Wehr N. B., Viteri G. A., Berlett B. S., Levine R. L. (2010) Small-molecule antioxidant proteome-shields in Deinococcus radiodurans. PLoS ONE 5, e12570. [DOI] [PMC free article] [PubMed] [Google Scholar]
- 13. Mounicou S., Szpunar J., Lobinski R. (2009) Metallomics: the concept and methodology. Chem. Soc. Rev. 38, 1119–1138 [DOI] [PubMed] [Google Scholar]
- 14. McNaughton R. L., Reddi A. R., Clement M. H. S., Sharma A., Barnese K., Rosenfeld L., Gralla E. B., Valentine J. S., Culotta V. C., Hoffman B. M. (2010) Probing in vivo Mn2+ speciation and oxidative stress resistance in yeast cells with electron-nuclear double resonance spectroscopy. Proc. Natl. Acad. Sci. U.S.A. 107, 15335–15339 [DOI] [PMC free article] [PubMed] [Google Scholar]
- 15. Bennati M., Prisner T. F. (2005) New developments in high field electron paramagnetic resonance with applications in structural biology. Rep. Prog. Phys. 68, 411–448 [Google Scholar]
- 16. Bonacossa de Almeida C., Coste G., Sommer S., Bailone A. (2002) Quantification of RecA protein in Deinococcus radiodurans reveals involvement of RecA, but not LexA, in its regulation. Mol. Genet. Genomics 268, 28–41 [DOI] [PubMed] [Google Scholar]
- 17. Un S., Dorlet P., Rutherford A. W. (2001) A high-field EPR tour of radicals in photosystems I and II. Appl. Magn. Reson. 21, 341–361 [Google Scholar]
- 18. Davies E. (1974) A new pulse ENDOR technique. Phys. Lett. A 47, 1–2 [Google Scholar]
- 19. Mims W. (1965) Pulsed ENDOR experiments. Proc. R. Soc. Lond. A 283, 452–457 [Google Scholar]
- 20. Potapov A., Goldfarb D. (2006) Quantitative characterization of the Mn2+ complexes of ADP and ATPγS by W-band ENDOR. Appl. Magn. Reson. 30, 461–472 [Google Scholar]
- 21. Un S., Tabares L. C., Cortez N., Hiraoka B. Y., Yamakura F. (2004) Manganese(II) zero-field interaction in cambialistic and manganese superoxide dismutases and its relationship to the structure of the metal binding site. J. Am. Chem. Soc. 126, 2720–2726 [DOI] [PubMed] [Google Scholar]
- 22. Tabares L. C., Gätjens J., Hureau C., Burrell M. R., Bowater L., Pecoraro V. L., Bornemann S., Un S. (2009) pH-dependent structures of the manganese binding sites in oxalate decarboxylase as revealed by high-field electron paramagnetic resonance. J. Phys. Chem. B 113, 9016–9025 [DOI] [PMC free article] [PubMed] [Google Scholar]
- 23. Schiemann O., Carmieli R., Goldfarb D. (2007) W-band 31 P-ENDOR on the high-affinity Mn2+ binding site in the minimal and tertiary stabilized hammerhead ribozymes. Appl. Magn. Reson. 31, 543–552 [Google Scholar]
- 24. Bennett B. D., Kimball E. H., Gao M., Osterhout R., Van Dien S. J., Rabinowitz J. D. (2009) Absolute metabolite concentrations and implied enzyme active site occupancy in Escherichia coli. Nat. Chem. Biol. 5, 593–599 [DOI] [PMC free article] [PubMed] [Google Scholar]
- 25. Tabares L. C., Gätjens J., Un S. (2010) Understanding the influence of the protein environment on the Mn(II) centers in superoxide dismutases using high-field electron paramagnetic resonance. Biochim. Biophys. Acta 1804, 308–317 [DOI] [PubMed] [Google Scholar]
- 26. Imlay J. A., Fridovich I. (1991) Assay of metabolic superoxide production in Escherichia coli. J. Biol. Chem. 266, 6957–6965 [PubMed] [Google Scholar]
- 27. Volkmer B., Heinemann M. (2011) Condition-dependent cell volume and concentration of Escherichia coli to facilitate data conversion for systems biology modeling. PLoS ONE 6, e23126. [DOI] [PMC free article] [PubMed] [Google Scholar]
- 28. Lu P., Vogel C., Wang R., Yao X., Marcotte E. M. (2007) Absolute protein expression profiling estimates the relative contributions of transcriptional and translational regulation. Nat. Biotechnol. 25, 117–124 [DOI] [PubMed] [Google Scholar]
- 29. Daly M. J., Gaidamakova E. K., Matrosova V. Y., Vasilenko A., Zhai M., Leapman R. D., Lai B., Ravel B., Li S.-M. W., Kemner K. M., Fredrickson J. K. (2007) Protein oxidation implicated as the primary determinant of bacterial radioresistance. PLoS Biol. 5, e92. [DOI] [PMC free article] [PubMed] [Google Scholar]
- 30. Markillie L. M., Varnum S. M., Hradecky P., Wong K. K. (1999) Targeted mutagenesis by duplication insertion in the radioresistant bacterium Deinococcus radiodurans: radiation sensitivities of catalase (katA) and superoxide dismutase (sodA) mutants. J. Bacteriol. 181, 666–669 [DOI] [PMC free article] [PubMed] [Google Scholar]
- 31. Robinson C. K., Webb K., Kaur A., Jaruga P., Dizdaroglu M., Baliga N. S., Place A., Diruggiero J. (2011) A major role for nonenzymatic antioxidant processes in the radioresistance of Halobacterium salinarum. J. Bacteriol. 193, 1653–1662 [DOI] [PMC free article] [PubMed] [Google Scholar]
- 32. Krüger A., Grüning N.-M., Wamelink M. M. C., Kerick M., Kirpy A., Parkhomchuk D., Bluemlein K., Schweiger M.-R., Soldatov A., Lehrach H., Jakobs C., Ralser M. (2011) The pentose phosphate pathway is a metabolic redox sensor and regulates transcription during the antioxidant response. Antioxid. Redox Signal. 15, 311–324 [DOI] [PubMed] [Google Scholar]
- 33. Davey C. A., Richmond T. J. (2002) DNA-dependent divalent cation binding in the nucleosome core particle. Proc. Natl. Acad. Sci. U.S.A. 99, 11169–11174 [DOI] [PMC free article] [PubMed] [Google Scholar]
- 34. Millonig H., Pous J., Gouyette C., Subirana J. A., Campos J. L. (2009) The interaction of manganese ions with DNA. J. Inorg. Biochem. 103, 876–880 [DOI] [PubMed] [Google Scholar]
- 35. Sun H., Li M., Xu G., Chen H., Jiao J., Tian B., Wang L., Hua Y. (2012) Regulation of MntH by a dual Mn(II)- and Fe(II)-dependent transcriptional repressor (DR2539) in Deinococcus radiodurans. PLoS ONE 7, e35057. [DOI] [PMC free article] [PubMed] [Google Scholar]
- 36. Chen H., Wu R., Xu G., Fang X., Qiu X., Guo H., Tian B., Hua Y. (2010) DR2539 is a novel DtxR-like regulator of Mn/Fe ion homeostasis and antioxidant enzyme in Deinococcus radiodurans. Biochem. Biophys. Res. Commun. 396, 413–418 [DOI] [PubMed] [Google Scholar]