

Abstract
Molecular diffusion and transport processes are fundamental in physical, chemical, and biological systems. Current approaches to measuring molecular transport in cells and tissues based on perturbation methods, e.g., fluorescence recovery after photobleaching, are invasive; single-point fluctuation correlation methods are local; and single-particle tracking requires the observation of isolated particles for relatively long periods of time. We discuss here the detection of molecular transport by exploiting spatiotemporal correlations measured among points at large distances (>1 μm). We illustrate the evolution of the conceptual framework that started with single-point fluorescence fluctuation analysis based on the transit of fluorescent molecules through a small volume of illumination. This idea has evolved to include the measurement of fluctuations at many locations in the sample using microscopy imaging methods. Image fluctuation analysis has become a rich and powerful technique that can be used to extract information about the spatial distribution of molecular concentration and transport in cells and tissues.
Keywords: pair correlation, molecular flow, anisotropic diffusion
INTRODUCTION
This review illustrates chronologically and conceptually the evolution of the field of fluorescence correlation spectroscopy (FCS) from the initial experiments to the current stage. For the purpose of this review it is useful to discuss ideas from a mathematical framework using figures and tables containing information on specific aspects of the technology and to show a few application examples. This review is a lesson from the fluctuation spectroscopy field about the conception and application of ideas and its influence as a technology in the biological and biophysical fields. A large number of researchers have contributed to this evolution, and it is impossible to cover all their important work.
FCS has emerged as a powerful method to study the motions of fluorescent molecules in solution, in cells and tissues. It provides information at the single-molecule level by averaging the behavior of many molecules, thus achieving very good statistics. Single-particle tracking (SPT) is also a highly sensitive technique to measure particle movement. The single-point FCS method only provides information about the measured point in the sample, making it difficult to map the flow of molecules in a complex volume such as that of a cell, whereas the SPT technique only allows tracking in cells of isolated large particles. We describe here a conceptual history of the FCS approach by explaining not only its powerful principle, but also its limitations. At the end of this review we describe a proposed paradigm change in which one overcomes some of these limitations by using spatial pair cross-correlation functions (pCFs). The pCF approach measures the time a particle takes to go from one location to another by correlating the intensity fluctuations at specific points on a grid, independent of the number of particles in the imaging field. Therefore, one can trace the average path of particles. For example, this method could be used to detect the time at which a protein passes the nuclear barrier and the location of the passage. This information cannot be obtained with the fluorescence recovery after photobleaching technique or any other image correlation spectroscopy method. Instead, this method builds on some recent work using dual-foci FCS (1) and bridges the two technologies (FCS and SPT), providing single-molecule sensitivity and information about the path of molecules, but in the presence of many molecules. This method has much broader applicability than solely for the study of membrane organization and dynamics described in Reference 2 as it works in three dimensions and could be applied to the interior of a cell.
SINGLE-POINT FLUORESCENCE CORRELATION SPECTROSCOPY: THE ORIGINAL APPROACH
The FCS field was developed after the dynamic light scattering (DLS) technology, also known as photon correlation spectroscopy (3–7). Although the technology for the measurement and analysis of fluctuations in FCS was originally derived from the DLS field, the physical principle producing fluctuations in FCS is quite different. DLS depends on the scattered light interference from an ensemble of particles (5). The fluctuations in scattering intensity from molecules in a volume defined by the wavelength of light are caused by reflection and interference among particles (5). An advantage of DLS is that it does not require a fluorescent molecule. Instead, the FCS signal originates from fluorescent molecules passing through a very small illumination volume generally defined by a confocal volume or due to a change in their fluorescent properties. Single molecules in the volume of excitation are sufficient to produce a signal. More importantly, the selectivity of fluorescence allows only the molecule of interest to be detected. The FCS field was originally started by Magde et al. (8) in 1972 for the determination of binding of ethidium bromide to double-stranded DNA. In this original work the fluorescence fluctuations resulted from the difference in fluorescence quantum yield when ethidium bromide binds to DNA (high quantum yield) with respect to the unbound state (Figure 1). The original purpose was to study chemical kinetics. Later the effect of diffusion on the fluorescence fluctuations was discussed (4, 9–12). A few years after its introduction, most of the theory of single-point FCS was developed together with the understanding of the technology needed to record and analyze the fluctuations (13). Briefly, the FCS analysis is traditionally done using correlation functions, although other approaches have been proposed (14–16). In a fluctuation record there are two aspects that are usually analyzed (Figure 2). One is the temporal spectrum of the fluctuation, which is obtained using the autocorrelation function (ACF) approach, and the other is the analysis of the amplitude spectrum, which is obtained using the photon-counting histogram approach or fluctuation intensity distribution analysis (Figure 3) (17–24). Both the ACF and photon-counting histogram approaches are adequate to analyze relatively simple systems in chemical equilibrium. In a typical experiment we extract the characteristic time of the fluctuations, which can result from the diffusion of chemical species across the illumination volume or from changes in quantum yield due to transitions between possible states of the system.
Figure 1.

Sketch of the fluorescence correlation spectroscopy (FCS) principle. (Left column) Molecules diffusing through the volume of observation (red oval ). (Right column) Molecules binding to the DNA scaffold, resulting in a change in their fluorescence intensity. Fluorescence intensity is changing only when a molecule is in the volume of excitation or when the molecule binds to the DNA. (Upper row) The dynamics of diffusion and/or binding processes, generating fluctuations in fluorescence intensity. (Middle row) Spatial and temporal dimensions. For diffusion, changing the size of the volume of excitation changes the duration of the fluctuation. For binding equilibria, changing the volume of excitation does not change the duration of the fluctuations. It is assumed that the DNA is not moving during the time of the experiment. PSF, point-spread function. (Bottom row) Scanning along a line. Each point of the line samples a different location at a different time. If the particles move slowly with respect to the line-scanning time, at each point of the line we can observe intensity fluctuations. The same particle could appear at adjacent locations but at different times. In the case of binding equilibria, the intensity will change at a given location if binding occurs. This location will be the same, and there will not be a correlation with changes in intensity at adjacent points.
Figure 2.
Fluctuation time series due to single particles passing through the excitation volume. In single-point fluorescence correlation spectroscopy, we measure the average duration of a fluctuation at a point in space (or in two dimensions). Intensity fluctuations can originate from molecules moving in and out of the observation volume or from molecules fluctuating in intensity due to photophysical processes such as blinking, changes in orientation, or conformational transitions. For translational diffusion, the average duration of a fluctuation t is determined by the diffusion coefficient D and by the waist of the observation volume W0. This duration is essentially given by . A lower limit for the duration of the fluctuations for a typical beam waist is approximately 25 ms for D 400 μm2 s−1 and W0 = 0.2 μm. For the cellular environment, when the diffusion coefficient is in the range of D = 20 μm2 s− = 1 the lower limit is approximately 500 μs. These figures determine the speed of data acquisition. For binding, the average duration is determined by kon and koff. Whereas koff is dependent on the affinity for binding, kon depends also on the ligand concentration and other variables such as local viscosity.
Figure 3.

Fluorescence correlation spectroscopy analysis. Fluorescence fluctuations are analyzed using the autocorrelation function G(τ) and photon-counting histogram analysis, which is the histogram of photon counts during the sampling period. Brackets in the equation for the autocorrelation function indicate the average over all time sequences.
Although most of the FCS literature uses the ACF approach, the fluctuation record is a time series, and other approaches based, for example, on hidden Markov chains and other statistical analysis methods have been successfully used to extract information about the states and the rates of transition between states of a chemical system (25–32).
Originally, the FCS technique had limitations that required further technical and conceptual advancements before the method could become popular. A technical problem was the realization of a sufficiently small volume of illumination so that the fluctuations due to the passage of molecules were large and easily detected (Table 1). This technical limitation was removed by the pioneering work of Eigen & Rigler (33) using confocal pinholes. Another technical problem was the lack of sensitive, low-noise detectors based on the photon-counting approach, which became available during the 1990s. Perhaps a major conceptual approach was the change of point of view from the description of fluctuations based on changes in concentration, typical of the DLS approach, to the single-molecule description, typical of the FCS field (33). Although in the 1990s the single-molecule field became popular, researchers also exploited other methods of obtaining small volumes of illumination such as the two-photon excitation volume approach. Fast low-noise detectors became available, and the entire field received a strong impetus. The evolution of FCS, which included the availability of commercial hardware for researchers, had begun.
Table 1. Orders of magnitude (for 1-μM solution, small molecule, water).
Typical volumes obtained by common devices. For the calculation of the time, the diffusion coefficient was assumed to be approximately 300 μm2 s−1. The fluctuation is the normalized value of the autocorrelation function at τ = 0. For molecular concentration typical of proteins in cells, volumes on the order of femtoliters and fast sampling are needed to observe molecular fluctuations due to cytoplasmic diffusion.
| Volume | Device | Size (μm) | Molecules | Time (s) | Fluctuation |
|---|---|---|---|---|---|
| Milliliter | Cuvette | 10,000 | 6 × 10¹⁴ | 104 | 10−15 |
| Microliter | Plate well | 1,000 | 6 × 10¹¹ | 102 | 10−12 |
| Nanoliter | Microfabrication | 100 | 6 × 10⁸ | 1 | 10−8 |
| Picoliter | Typical cell | 10 | 6 × 10⁵ | 10−2 | 10−6 |
| Femtoliter | Confocal volume | 1 | 6 × 10² | 10−4 | 10−3 |
| Attoliter | Nanofabrication | 0.1 | 6 × 10⁻¹ | 10−6 | 1 |
The technology for recording fluorescence fluctuations at a single point has reached a high level of sophistication. Essentially, we can measure processes that occur in a very broad timescale from picoseconds to many seconds, covering a range of at least 12 or more decades in time. This range is adequate to study processes such as molecular rotations, rapid molecular internal relaxations, energy transfer, diffusion, and chemical reactions.
Physical processes that have been measured using FCS are listed in a sidebar. Given the richness of the field, the sidebar cannot include all applications. As result of the developments in many labs, single-point FCS is today a mature technology. We understand the statistics of a photon’s time of arrival and how these statistics relate to underlying chemical and physical processes (19). There is a relatively good understanding of measurement artifacts arising from limitations of the detection, processing electronics, and unwanted chemical reactions such as photobleaching that inevitably occur during data acquisition (13).
An important modality associated with single-point FCS is dual- (or multiple-) channel data acquisition. This is normally referred to as cross-correlation FCS. This concept is similar to that of coincidence detection commonly used in many physics experiments. In the context of FCS it is used to measure the simultaneous occurrence of fluctuations in two (or more) channels (Figure 4). The cross-correlation method is also common in DLS, but the use of coincidence analysis to detect the formation of molecular complexes is unique to FCS (34–43).
Figure 4.

Sketch of the cross-correlation experiment. A sample contains molecules emitting in two colors, some of them forming a complex. After passing through filters so that only one color is selected, the fluorescence fluctuation is measured by two independent detectors. The cross-correlation function defined at the top of the figure is calculated. Only fluctuations that occur simultaneously in both channels due to the passage of the complex in the illumination volume contribute to the cross-correlation.
SCANNING TECHNIQUES: THE EVOLUTION OF THE SPATIO-TEMPORAL CONCEPT IN FLUCTUATION SPECTROSCOPY
The Spatial Correlation Traditional Approach: The Carpet Idea
A substantial limitation of the single-point FCS technique is the lack of information about fluctuations occurring in the proximity of the measured point. Many processes in chemistry, physics, and biology have a spatial scale. Since the earlier days of FCS it has been well-known that diffusion processes have spatial structures that depend on the size of the volume of illumination. The larger the volume is, the longer it will take for a molecule to cross the illumination volume. The timescale of other processes such as binding to immobile locations or blinking and rotational motions is independent of the size of the illumination volume (Figure 1). This difference in the spatial extent of the fluctuation was used to distinguish among processes. However, this approach, i.e., the dependency of the timescale on the size of the illumination volume, still uses an illumination volume that has cylindrical symmetry. With this approach it is difficult to produce illumination volumes that are large and of an arbitrary shape.
Early in the field’s development, it was understood that by moving the illumination volume in a periodic pattern in the sample at a rate such that the molecules will not move much during a period, the record of the intensity fluctuations along the path will contain spatial information about the location where the fluctuation occurred (44, 45). The analysis of the fluctuations at successive periods will contain information about the time course of the fluctuations of the points along the path (46). This approach is called scanning FCS, and it is practiced today in several labs (47–51). Conceptually, scanning FCS is different from the use of an arbitrary shape or size for the volume of illumination such as the dual-foci method (1, 52), as different volumes are excited at different times in scanning FCS. Scanning introduces a time and spatial structure to the observation that we could exploit to best match the spatial and temporal structure of the physical process we are investigating (Figure 1).
One advantage of scanning FCS is that current confocal microscopes have the capability to send the laser beam along a path (either line or circular orbit) at a very high rate. As this method is the basic element for the introduction of spatiotemporal correlations, let us examine from a conceptual point of view the various ways that the information is encoded when a laser beam performs a periodic path in the sample. Every point along the path is visited once per period. The size of the point is defined by the point-spread function (PSF). If molecules remain in a given point for a time comparable with the period, then the intensity fluctuation at that point decays between successive periods. Because data are available at many points along the path, this experiment is equivalent to performing many single-point FCS measurements simultaneously. In this case, the time resolution of the experiment is the period, which can be a fraction of a millisecond, short enough to correlate the motion of small proteins in the cellular environment. However, if we consider two adjacent points in the path, the time difference of sampling these two points is equal to the period divided by the number of sampling points along the path. The time from point to point is then in the microsecond range, which is typical of the single-point FCS method. For reasons that are explained below, the correlation in time of one point of the path is called the carpet approach, whereas the correlation in time among neighboring points along the path is called the raster image correlation spectroscopy approach.
Taken together, the spatial and temporal correlation approaches strongly increase the information content of the fluctuation measurement. Although this principle was known since the early days, the technical realization of a practical system based on rapidly scanning a path in the sample made the technology easy to implement (46).
Technically, the path can have a complicated spatial and temporal sequence, such as the rasterscan path obtained in confocal microscopy. One crucial consideration is the rate of sampling along the path and the location of points along the path. This concept is different than the original idea of using images to obtain spatial correlations, which is the basis of image correlation spectroscopy.
Image Correlation Spectroscopy
The field of image correlation started with the idea to correlate in space the fluorescence distribution in one image. Petersen and colleagues (53–55) exploited this principle to obtain the average size of large protein aggregates in biological membranes. If protein aggregates are larger or comparable in size to the PSF, the spatial correlation operation applied to the pixels of an image is used to obtain the average aggregate size and its distribution (Figure 5). It was soon realized that images taken at different times could provide the time evolution of the aggregate size. Moreover, the intensity at one point (pixel) could be correlated in time with the intensity at the same point in the next frame so that the intensity at one pixel as a function of time could be represented as a time series (Table 2). This is the same concept as the carpet approach in scanning FCS, and it is called time image correlation spectroscopy. However, in the case of the acquisition of entire frames, the sampling rate at the same pixel is equal to the frame rate (seconds). This time is generally much slower than the diffusion (pixel to pixel) of molecules in membranes or in the cytoplasm. Therefore, this idea had applications only for very slowly moving particles. By this time, the idea of exploiting spatio-temporal correlation to determine diffusion and aggregation was in full development, mainly because of the efforts of the group of Petersen and Wiseman (56–68). Several variants of image correlation spectroscopy were developed with the purpose of extracting correlations that result from different processes such as diffusion, flow, and binding. For example, time image correlation spectroscopy, spatio-temporal image correlation spectroscopy, and inverse-space image correlation spectroscopy were developed at that time (Table 2). During the same period, in our lab we exploited the concept of rapidly scanning a path in the sample so that the time and the space variables can be simultaneously sampled (69, 70).
Figure 5.

Spatial correlation operation. (a) Given an image, one displaces the frame by Dx, multiplies the intensity at each pixel of the original frame with the intensity of the pixels in the frame displaced by Dx, and then sums all these products and divides by the average intensity squared. This value is assigned to the position (1,0) of a new image called the correlation image. This process is repeated for all possible delays in the x and y directions to produce the spatial correlation, which is half the size of the original image. In the case of autocorrelation, four quadrants are stitched together for the correlation image. For the operation of a cross-correlation, all four quadrants are calculated. (b) Smaller image features produce a small region of correlation. Large features produce a correlation of larger size. In the equation for the spatial correlation function, the variables ξ and ψ represent spatial increments in the x and y directions, respectively. A two-dimensional spatial correlation can be computed efficiently using fast Fourier transform methods.
Table 2.
Image correlation spectroscopy methods
| Method | Description |
|---|---|
| Image correlation spectrosocpy (ICS) |
Images are spatially correlated only. Method is used to measure the size and number of aggregates. The spatial coordinate is averaged over the entire image or a part of the image. |
| Number and brightness (N&B) |
The average and variance of the fluctuations at each pixel of the image are measured. Method is used to determine the number and brightness of the molecules at each pixel of the image. |
| Time image correlation spectrosocpy (tICS) |
Images are temporally correlated only. Method is used to measure the changes in intensity at each pixel. |
| Spatio-temporal image correlation spectroscopy (STICS) |
Images taken at different times are spatially cross-correlated. The time between the images is varied. The spatial correlation is averaged over the entire image. Method is used to measure flow. |
| Inverse space image correlation spectroscopy (kICS) |
Images are spatially Fourier transformed. The spatial transform is used for the correlation. After correlation, the resulting function is inverse Fourier transformed. Method is used to distinguish between dynamic processes that depend on the spatial scale (diffusion) and processes that are independent on the spatial scale (binding). The correlation is averaged over the entire image. |
| Raster image correlation spectroscopy (RICS) |
Images are acquired in a raster-scan mode. Because the image contains spatial and temporal information, the spatial correlation of the image also contains spatial and temporal information. Method is used to measure diffusion and binding in images. The spatial coordinate is averaged over a region of interest. |
| Particle image correlation spectroscopy (PICS) |
This is not a true image correlation method. First, information about the location and the intensity/size of the particle is determined, and then the particles so detected are correlated in space and time. |
There is a substantial difference in acquiring an image as a snapshot and then correlating the intensity at each point with the successive images by comparing with a raster scan of an image with a specific path. The time resolution of the image correlation method is limited by the frame rate (which is on the order of seconds to milliseconds), whereas in the raster-scan method successive points along a line are measured with microsecond resolution and points in successive lines are measured with millisecond delays (Figure 6) (69–78).
Figure 6.

Raster image correlation spectroscopy and number and brightness methods. (Top left) MEF cell expressing paxillin-EGFP. Paxillin is found in the cytoplasm and in focal adhesions. Three regions are analyzed, in the focal adhesion where paxillin diffuses slowly and in some regions of the focal adhesion, and aggregates form, as shown in green in the brightness (B) map (lower left). In the perinuclear region paxillin also diffuses slowly and is monomeric. In the extended protruding lamella in the bottom right part of the cell, paxillin diffuses much faster and is monomeric. A stack of 100 images at a pixel dwell time of 12.5 μs was acquired. Both analyses were performed using the SimFCS program (Laboratory for Fluorescence Dynamics, http://www.lfd.uci.edu).
It is important to realize that, in all these image correlation spectroscopy methods, the spatial correlation function averages all spatial coordinates so that the spatial information at the pixel level is lost. One way to partially overcome the reduction in the spatial resolution is to average over smaller areas, so that some sort of spatial information can be maintained (Figure 6).
Above we discuss methods that have pixel resolution and very-high time resolution (single-point FCS), methods that have good time resolution and pixel resolutions but on many pixels (the carpet approach), and methods that exploit spatial and temporal correlations but average relatively large areas (the image correlation spectroscopy methods). It is noteworthy to mention that we have developed the number and brightness approach, which is based on pixel resolution for methods used to extract information on the amplitude of the fluctuations (69–71, 76–79).
Observing the Same Molecule
To advance to the next level of complexity in the spatial and temporal understanding of the intensity fluctuations, we need to further develop the concept of molecular fluctuations. The chronology of the development of this concept required a maturation of an underlying idea in FCS. As we report in the Introduction, in the initial development of FCS there was a change in focus from the consideration of fluctuations in molecular concentrations to the description of fluctuations in terms of single molecules. The observation of temporal antibunching was definitive in this regard. The antibunching experiments demonstrated that there was an anticorrelation during a brief time following excitation that proved that the same molecule could not be excited until it returned to the ground state. It was also at this particular time that the technology for SPT was also developed. A requirement for SPT is that the particle (or molecule) being tracked is far from other particles so that the single-particle observation condition is achieved. In SPT we are always observing the same particle. In FCS the concept of fluctuations due to the same molecule was only raised recently by the pioneering work of Földes-Papp and colleagues (80–84). Under dilution conditions in which only one molecule is present in the proximity of the volume being sampled, these authors have shown that it is possible to measure correlations due to the re-entry of the same molecule in the volume of illumination (Figure 7). Although simulations of particles undergoing random walk predicted this behavior Földes-Papp and colleagues obtained the result experimentally. Once the observation of the same molecule was established experimentally, we learned some characteristic signatures of this processes such as spatial antibunching, which results in the anticorrelation of spatial fluctuations at a distance. This understanding leads to a new concept in fluctuation spectroscopy in which the correlation of fluctuations due to the same molecule at different locations can be identified. There is still a profound difference between SPT, in which we follow in great detail the movement of one particle, and the detection of the passage of the same particle at two distant points. Remarkably, we are witnessing an evolution of the original idea of extracting information from fluctuations due to the passage of single molecules in the volume of observation (single-point FCS) to that of detecting the same molecule at different locations (the pCF approach).
Figure 7.
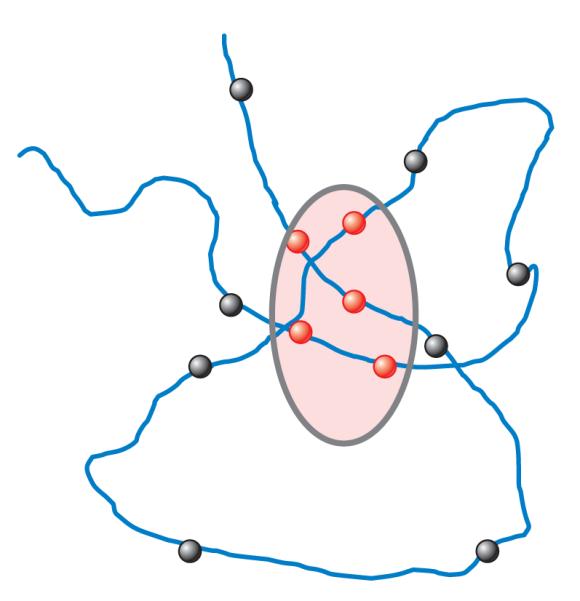
Schematic representation of the same molecule re-entering of the volume of observation.
Spatial Pair Cross-Correlation Functions
The basic idea of the pCF method is to statistically follow the same fluorescent molecule diffusing in the cell (2, 85). Figure 8 schematically shows the principle of the method. The fluorescence intensity is rapidly sampled (compared to the motion of the particle) at several points in a grid. As particles migrate, they appear at different points in the grid (Figure 8a).
Figure 8.
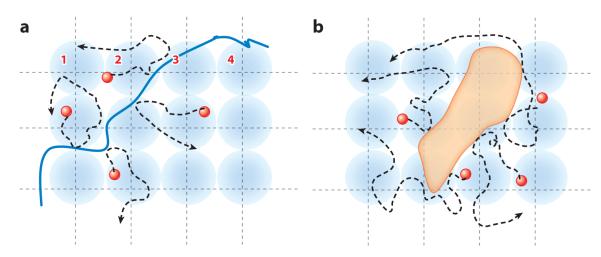
Principle of the spatial pair correlation approach. (a) Particles diffusing on one side of the space with a barrier (solid blue line) cannot cross-correlate with particles on the other side. (b) If there is an obstacle (orange feature), the average cross-correlation time will be longer than in the absence of the obstacle.
Although the example in Figure 8 depicts a particle diffusing in two dimensions, the principle of the method is valid for diffusion in any dimension. By detecting the same molecule at two different locations, we measure the average time the same molecule takes to move between those two locations. Because the measurement is exquisitely local to a pair of points, if there is a delay from the expected average time to diffuse the distance between the two points (expected on the basis of the mean-square displacement law of diffusion), then we can make inferences about the existence of diffusion barriers between these two points or about regions in the cell with slow diffusion. By repeating the calculation at several pairs of adjacent locations, we can trace the contour of the barrier, if it exists. One important consequence of the proposed pCF method is that diffusion is measured by the average time particles (molecules) take to travel between two points. As the position of the two points is arbitrary, the anisotropy of the motion can also be measured. This method is substantially different from the conventional FCS method in which the duration of the intensity fluctuation is measured as the molecule transits across a focused laser beam. In the pCF approach, the calibration of the exact volume of the PSF is not crucial, as we only need to know its average location.
Measuring the correlation between two separate points is not new. Traditionally, the two points are obtained by focusing two laser beams at a distance (fixed or variable). Using this approach, accurate measurements of diffusion coefficients have been achieved and the flow of molecules between the two points has been measured (1, 86). However, the information obtained is local and is obtained one pair of points at a time. In our approach we use a laser beam that is moved rapidly to different locations in a repeated pattern, generally a line, circle, or grid. The entire pattern is repeated in approximately 1 to 10 ms. We measure the correlation between every pair of points in the grid pattern. The result is a map of molecular flow and therefore a map of barriers to flow. Furthermore, our approach is applicable to conventional laser scanning microscopes that are readily available in most biology labs.
Demonstration of the Pair Correlation Function Principle
To introduce the mathematics and concepts necessary to understand the pCF idea, we schematically show in Figure 9 the expected intensity profile at two locations due to diffusion (Equation 1; see the sidebar Derivation of the Expression for the Pair Correlation Function for Diffusing Particles). A molecule at time t = 0 is at a given position. Due to diffusion there is a probability of finding the molecule at any given distance from the original position. A section of the fluorescence intensity at different distances (from the origin) and times is shown in Figure 9b.
Figure 9.

Conceptual description of the pair correlation technique (pCF). (a) A particle initially at a location indicated by 0 (blue sphere) can be found at a given time at a distance from this location (shaded parabolic area) with a probability that depends on the square root of the distance. This is the mean-square displacement concept. The size of the dot schematically indicates the size of the point-spread function. (b) At a given distance r from the initial position, the average intensity changes as a function of time. At a large distance, the intensity is zero at short times, increases at a later time, and then decreases at very long times. (c) Collecting data along a line (line scanning) produces the so-called carpet. (d ) The intensity at different points along the line correlates with the intensity fluctuation at a distant point when the same particle appears at that distance. At very short times the correlation between adjacent points is large because fluctuations occur within the same volume of illumination. Because the line scan is fast, particles move little during the scan. This gives rise to the concept of the autocorrelation function of the carpet. At larger distances, a particle appears with a delay. The cross-correlation of points along the line at a given distance gives rise to the concept of a pCF at a distance. (e) Depending on the diffusion coefficient, for a given distance, particles will take different times. pCF(10) occurs at a different time depending on the diffusion coefficient. The size of the pixel is 50 nm in this figure. If there are two type of particles, one diffusing slowly and the other diffusing fast, there will be two bumps in pCF(10). ( f ) For particles moving in a plane, the amplitude of the pCF decreases linearly with distance as the probability to detect the particle along the line depends on the ratio of the size of the illumination spot to the length of the circumference at a given distance. Figure redrawn with permission from Reference 2, figure 9.
In our original proof-of-principle setup, we acquire data by rapidly moving a diffraction-limited laser beam focused on the surface of the membrane of a cell (87). In our example, the fluorescence intensity is sampled at a rate such that spatial locations along the orbit are oversampled with respect to the waist of the laser beam. For example, if the waist of the diffraction-limited spot is 200 nm (typical of a confocal microscope), then we sample the intensity approximately every 100 nm as this spot moves on the plane of the membrane (in a linear or circular pattern). The exact distance is not important provided we can sample several times during the motion of the laser beam along a distance comparable to the beam waist. For example, in our setup we scan one orbit in approximately 1 ms. If the intensity is sampled every 15.62 μs, we have 64 points per orbit in 1 ms. If the distance between successive points is 100 nm, we can collect points in a line that is approximately 6.4 μm long. This length scale is adequate for studying spatial heterogeneity from approximately 200 nm to micrometers and on a timescale from microseconds to several minutes or hours. The parameters used for this example are typical, and their values could be adapted to different experimental situations. We note that contrary to raster image correlation spectroscopy, which requires oversampling, the pCF approach will work with pixels separated by distances that are larger than the pixel size. Actually, by increasing the distance, we also increase the time it will take for a molecule to go from one point to another, which makes both fast and slow diffusing processes equally measurable.
Simulated Data: Isotropic Diffusion in a Membrane
Figure 9c shows simulated data collected along an orbit approximately 10 μm long with a sampling rate of 15.62 μs per pixel. Data are presented under the form of a carpet in which the x coordinate represents the positions along the orbit and the vertical coordinate corresponds to successive orbits. Because the laser beam moves at a constant velocity along the scan line, there is a direct relationship between the position of a point in the carpet representation and the time the intensity is acquired at that point. If we extract a column of the carpet, this column will correspond to the intensity fluctuations at that location. Along the orbit, points are sampled every 15.62 μs in our simulations and in our instrument. During that time, a molecule in the membrane will only diffuse a few nanometers (assuming a diffusion coefficient of 0.1 μm2 s−1), and when the same position is sampled again after 1 ms, the particle has moved on the average approximately 20 nm. If we perform the pair cross-correlation calculation of the fluctuations occurring at two points along the orbit, we could determine the average time necessary to reach that distance. Figure 9d shows the pCF calculated between points at a distance of 1, 2, 3, 4, 5, and 6 pixels along the orbital scan. When the distance between the two points is small, points are within the PSF, which produces a correlation of the intensity fluctuations at very short times. As the distance increases, the amplitude of the pCF starts with very low (even negative) amplitude and then increases at a later time. Figure 9e shows results of a simulation using particles with different diffusion coefficients and a combination of these particles. The figure shows the pCF at a distance of 10 points along the orbit for three different diffusion coefficients (D = 10, 1, and 0.2 μm2 s−1) and for a sample containing two types of particles diffusing at 10 and 0.2 μm2 s−1. The average time at which the maximum of the correlation is reached increases as the diffusion coefficient decreases. The width of the time of passage distribution is relatively constant (in the log axis plot), and it is approximately 1 decade in time. We anticipate that if two molecular species differ in their diffusion coefficients by more than a decade, they will appear as separate peaks in the pCF. The sample containing the two species that are separated by a factor of 50 in diffusion coefficient is indeed well separated. We also show that the pCF can be negative at short times (Figure 9e). The characteristic anticorrelation at short times and then the increase in the correlation at longer times are the signatures for the detection of the same molecule at a later time. This is the spatial equivalent of the time-antibunching principle. At longer times we have a maximum in amplitude of the cross-correlation curve, which results from the average transit time (diffusive or not) between the two locations. At very long distances the cross-correlation function decreases because the particle has a smaller chance to be detected at one specific point along a circle surrounding the particle, as previously described. Figure 9d shows that the amplitude of the correlation decreases with distance, but Figure 9e shows that for the same distance, the amplitude of the correlation is independent of the diffusion coefficient. This results from the same particle with a spot the size of the PSF being measured at different distances (Figure 9f). The ratio between the size of the spot and a hypothetical line surrounding the particle decreases linearly as we go further from the original position of the particle (Figure 9f). Neglecting bleaching, the time-integrated probability of detecting the same molecule at any given distance from its origin is independent of the diffusion constant and of the direction, if the diffusion is isotropic. Briefly, if we trace a hypothetical circle around a particle, the particle will cross this circle at some time (Figure 9f). If we only measure a segment of this hypothetical circle, the probability that a particles passes through that segment will depend on the ratio between the size of the segment and the length of the circle. If this region of observation is kept constant in size (e.g., the size of the PSF), then as we go further from the center of the circle (Figure 9f), the probability that a particles is detected in this small region will decrease linearly with distance. Instead the average time at which the particle will be detected depends on the (square of the) distance, as predicted by this example in the case of three dimensions. This probability has been previously evaluated by several authors (88, 89). For example, Saxton & Jacobson (88) obtained a closed expression in the context of the diffusion of molecules in membranes.
Detecting Obstacles to Diffusion
In the previous section we show that the same particle can be detected at a given distance from the original starting point. If the space is isotropic, the average time to reach a given location is independent of the direction. To detect anisotropy of diffusion, in Figure 10 we plot the values of the pCF, for example, pCF(10), and we compare the position of the maximum of the function in different directions or as a function of location. If there is a barrier to diffusion at any given location, the only way to reach the other side of the barrier is if the particle goes around the obstacle or passes over the barrier. The maximum of the correlation will be found at a longer time than in the absence of a barrier. By mapping the time of the maximum of the pCF for every pair of points in the image, we can establish the location and the size of the obstacles.
Figure 10.

Simulation of beads moving in a plane within a region: autocorrelation function (ACF) carpet and pair correlation function [pCF(10)]. Beads diffuse in a membrane in which two impenetrable barriers were placed (red dashed lines). The diffusion coefficient is the same everywhere (1 μm2 s−1). A line scan (with 2 ms per line) was performed at the center of the region between the two boundaries and perpendicular to the boundaries. The waist of the point-spread function was 0.2 μm. The intensity carpet shows a slight decrease in intensity in the region between the barriers indicated by the red dashed lines because in the simulation fewer molecules were placed in that region. The ACF is the same everywhere with a maximum at short times, except at the boundaries where the particle appears to move slower because it bounces on the barrier. pCF(10) shows a discontinuity at the barriers because the particle cannot cross the boundary. In the regions without boundaries, the maximum of the ACF occurs at approximately 12 ms due to the time it takes the beads to move 10 pixels. The pixel size is 50 nm. The expected time for diffusion in two dimensions (time = distance2/2D) is 0.012 s. The amplitude of the pCF(10) is about a factor of 12 less than the amplitude of the ACF, as predicted by the model shown in Figure 9. Simulations, calculations, and plots were obtained with the SimFCS program.
In this proof of principle of Figure 10 we performed correlation measurements along a line scan rather than for every point in a plane. The obstacles are on the plane, but the measurement is performed only along one line. Although we cannot detect all obstacles to diffusion, only those along the line or close to the line, we can illustrate the principle of the method and interpret experiments performed on membranes. If we plot the pCF between two points at a given distance (10 pixels) for every point along the line, we see a delay of the time of the maximum of the pCF, if there is a barrier nearby, as shown in Figure 10. Figure 10 shows simulated data in which particles are confined to particular regions and an impenetrable barrier exists among these. As the line of measurement crosses these barriers, the same particle cannot be found on the other side of the barrier. The barrier produces a delay of the time for the maximum correlation (in this case to infinity) as the barrier cannot be crossed. The pattern of the pCF shown in Figure 10, projected on the image, gives directly the location of the barriers along the line.
EXAMPLE OF APPLICATIONS OF THE CONCEPT OF PAIR CORRELATION FUNCTION TO DETECT OBSTACLES TO DIFFUSION
Figure 11 shows an example of a measurement of diffusion of EGFP, which has a nuclear localization signal for the nucleus. The complete analysis of this case has recently been published (85). The line-scan measurement is performed along a line going from the nucleus to the cytoplasm. In this direction, there is only diffuse motion, as opposed to the reverse direction in which the motion is directed and much faster. Figure 11a shows the conceptual setup. Figure 11b shows the carpet obtained along the line going from the nucleus to the cytoplasm. Depending on the region of analysis, determined by the point along the line scan, we can detect fast diffusion in the nucleus (pixels 1–12), relatively slow diffusion in the cytoplasm (pixels 16–32) (Figure 11c), and a delayed correlation due to the passage through the nuclear envelope for analysis through pixel 14 (Figure 11d). In the reverse direction, from cytoplasm to nucleus, the active transport results in a much faster (than diffusion) transport across the nuclear pore envelope. These data are shown in Reference 85. Figure 11 demonstrates the richness of information obtained by the pCF approach. This information is similar in content to that obtained with SPT but here is obtained on single proteins in the presence of many proteins in the volume of observation.
Figure 11.

Molecules moving from the nucleus to the cytoplasm. (a) Schematic representation of the experiment. (b) From the total intensity carpet we select the nuclear compartment, calculate the autocorrelation function (ACF) (right panel ), and (c) the pair correlation function (pCF) function at a distance that entirely correlates with the cytoplasm [in this case pCF(12) for columns 3–12]. (d ) pCF(9) yields different average delays depending on the column chosen for analysis. This experiment shows the delay in the pCF due to an obstacle to diffusion. C, cytoplasm; N, nucleus; and NE, nuclear envelope.
CONCLUSIONS AND FUTURE PROSPECTS
The evolution of the FCS has occurred in parallel with advances in the single-molecule field of which it shares many conceptual aspects and methods for statistical analysis. The understanding that FCS signals originate from single molecules came much earlier than the development of the single-molecule field. However, there is a major distinction between the single-molecule field, in which only one molecule is observed at a time, and FCS, in which the statistical behavior of individual molecules is obtained from the observation of a relatively small ensemble. An important observation that provided a new perspective for FCS was the realization that fluctuations due to single molecules can be observed in cells. Image correlation spectroscopy was specifically conceived for the biological environment. However, the original approach was based on averaging over a relatively large volume. Recent conceptual and technical developments are in the direction of reducing the spatial averaging to the minimum. There are still important limitations of this approach due to signal-to-noise considerations when a single molecule is observed in a cell in a sea of many molecules. Future advances will involve the development of better detection methods and the development of techniques for three-dimensional correlations for the cellular environment.
PHYSICAL PROCESSES STUDIED BY FLUORESCENCE CORRELATION SPECTROSCOPY.
Physical processes studied by FCS include diffusion (multidimensional, anomalous, restricted), chemical reactions, conformational changes, molecular rotations, fluorescence lifetime, FRET, and blinking. Fluctuations such as changes in molecular orientation (in the picosecond range), blinking-triplet state (in microseconds), and binding-unbinding (in the millisecond or longer range) occur on a wide time range. The development of hardware and software to analyze different types of fluctuations must consider these timescales. Single-point detectors can acquire data up to subnanosecond sampling (or dwell time) in the direct mode, and modern fast high-sensitivity cameras are limited to approximately 1 ms.
DERIVATION OF THE EXPRESSION FOR THE PAIR CORRELATION FUNCTION FOR DIFFUSING PARTICLES.
The diffusion propagator is given by
| (1) |
where C(r, t) can be interpreted as being proportional to the probability of finding a particle at position r and time t if the particle was at position 0 at t = 0. The fluorescence intensity at any given time and position δr from the origin is given by
| (2) |
where it is assumed that the fluorescence is proportional to the concentration, quantum yield Q, excitation-emission laser power, filter combination, and the position of the particle in the profile of illumination described by W(r). The pCF for two points at a distance δr as a function of the delay time τ is calculated using the following expression:
| (3) |
As in normal FCS, the pCF can be calculated analytically only for special cases of the profile of illumination function. For the simulations described in this article, it was assumed that the illumination profile was described by a symmetric two-dimensional Gaussian function. We also note that the diffusion propagator described by Equation 1 should be used with care. The propagator of Equation 1 cannot properly describe diffusion at very short times because it violates the causality principle. Simulations described in this article used a Monte Carlo approach, which does not suffer from this limitation, although it does not give a closed form for the correlation function.
SUMMARY POINTS.
In the single-point FCS section, we describe the classic approach to the principle of fluorescence fluctuation analysis.
The spatio-temporal concept has evolved in fluctuation spectroscopy through scanning techniques.
The traditional spatial correlation approach involves the carpet idea for the organization of measurements in space and time
In the ICS section we describe the mathematical approach to spatial correlation.
The “same” molecule correlates with itself in different spatial locations.
Spatial pCFs can detect anisotropic molecular flow.
The pCF principle has been demonstrated in simple systems.
Obstacles to diffusion have been detected using pCF analysis.
ACKNOWLEDGMENTS
This work was supported in part by the National Institutes of Health grants CMC U54-GM064346, LFD P41-RRO3155, and CCBS P50-GM076516.
Glossary
- FCS
fluorescence correlation spectroscopy
- SPT
single-particle tracking
- pCF
pair correlation function
- DLS
dynamic light scattering
- PSF
point-spread function
Footnotes
DISCLOSURE STATEMENT The authors are not aware of any affiliations, memberships, funding, or financial holdings that might be perceived as affecting the objectivity of this review.
LITERATURE CITED
- 1.Dertinger T, Loman A, Ewers B, Müller CB, Krämer B, Enderlein J. The optics and performance of dual-focus fluorescence correlation spectroscopy. Opt. Express. 2008;16:14353–68. doi: 10.1364/oe.16.014353. [DOI] [PubMed] [Google Scholar]
- 2.Digman MA, Gratton E. Imaging barriers to diffusion by pair correlation functions. Biophys. J. 2009;97:665–73. doi: 10.1016/j.bpj.2009.04.048. [DOI] [PMC free article] [PubMed] [Google Scholar]
- 3.Berne BJ, Pecora R. Dynamic Light Scattering. Wiley; New York: 1976. [Google Scholar]
- 4.Elson EL, Webb WW. Concentration correlation spectroscopy: a new biophysical probe based on occupation number fluctuations. Annu. Rev. Biophys. Bioeng. 1975;4:311–34. doi: 10.1146/annurev.bb.04.060175.001523. [DOI] [PubMed] [Google Scholar]
- 5.Koppel DE. Study of Escherichia coli ribosomes by intensity fluctuation spectroscopy of scattered laser light. Biochemistry. 1974;13:2712–19. doi: 10.1021/bi00710a009. [DOI] [PubMed] [Google Scholar]
- 6.Camerini-Otero RD, Pusey PN, Koppel DE, Schaefer DW, Franklin RM. Intensity fluctuation spectroscopy of laser light scattered by solutions of spherical viruses: R17, Q beta, BSV, PM2, and T7. II. Diffusion coefficients, molecular weights, solvation, and particle dimensions. Biochemistry. 1974;13:960–70. doi: 10.1021/bi00702a021. [DOI] [PubMed] [Google Scholar]
- 7.Pusey PN, Koppel DE, Schaefer DW, Camerini-Otero RD, Koenig SH. Intensity fluctuation spectroscopy of laser light scattered by solutions of spherical viruses: R17, Q beta, BSV, PM2, and T7. I. Light-scattering technique. Biochemistry. 1974;13:952–60. doi: 10.1021/bi00702a020. [DOI] [PubMed] [Google Scholar]
- 8.Magde D, Elson E, Webb WW. Thermodynamic fluctuations in a reacting system: measurement by fluorescence correlation spectroscopy. Phys. Rev. Lett. 1972;29:705–8. [Google Scholar]
- 9.Koppel DE, AD, Schlessinger J, Elson EL, Webb WW. Dynamics of fluorescence marker concentration as a probe of mobility. Biophys. J. 1976;16:1315–29. doi: 10.1016/S0006-3495(76)85776-1. [DOI] [PMC free article] [PubMed] [Google Scholar]
- 10.Magde D, Elson EL, Webb WW. Fluorescence correlation spectroscopy. II. An experimental realization. Biopolymers. 1974;13:29–61. doi: 10.1002/bip.1974.360130103. [DOI] [PubMed] [Google Scholar]
- 11.Elson EL, Magde D. Fluorescence correlation spectroscopy. I. Conceptual basis and theory. Biopolymers. 1974;13(1):1–27. doi: 10.1002/bip.1974.360130103. [DOI] [PubMed] [Google Scholar]
- 12.Elson EL. Quick tour of fluorescence correlation spectroscopy from its inception. J. Biomed. Opt. 2004;9:857–64. doi: 10.1117/1.1779234. [DOI] [PubMed] [Google Scholar]
- 13.Koppel DE. Statistical accuracy in fluorescence correlation spectroscopy. Phys. Rev. A. 1974;10:1938–45. [Google Scholar]
- 14.Palmer AG, Thompson NL. Molecular aggregation characterized by high order autocorrelation in fluorescence correlation spectroscopy. Biophys. J. 1987;52:257–70. doi: 10.1016/S0006-3495(87)83213-7. [DOI] [PMC free article] [PubMed] [Google Scholar]
- 15.Palmer AG, 3rd, Thompson NL. Molecular aggregation characterized by high order autocorrelation in fluorescence correlation spectroscopy. Biophys. J. 1987;52:257–70. doi: 10.1016/S0006-3495(87)83213-7. [DOI] [PMC free article] [PubMed] [Google Scholar]
- 16.Palmer AG, 3rd, Thompson NL. Theory of sample translation in fluorescence correlation spectroscopy. Biophys. J. 1987;511:339–43. doi: 10.1016/S0006-3495(87)83340-4. [DOI] [PMC free article] [PubMed] [Google Scholar]
- 17.Chen Y, Müller JD, Ruan Q, Gratton E. Molecular brightness characterization of EGFP in vivo by fluorescence fluctuation spectroscopy. Biophys. J. 2002;82:133–44. doi: 10.1016/S0006-3495(02)75380-0. [DOI] [PMC free article] [PubMed] [Google Scholar]
- 18.Van Rompaey E, Chen Y, Müller JD, Gratton E, Van Craenenbroeck E, et al. Fluorescence fluctuation analysis for the study of interactions between oligonucleotides and polycationic polymers. Biol. Chem. 2001;382:379–86. doi: 10.1515/BC.2001.046. [DOI] [PubMed] [Google Scholar]
- 19.Chen Y, Müller JD, So PT, Gratton E. The photon counting histogram in fluorescence fluctuation spectroscopy. Biophys. J. 1999;77:553–67. doi: 10.1016/S0006-3495(99)76912-2. [DOI] [PMC free article] [PubMed] [Google Scholar]
- 20.Hillesheim LN, Chen Y, Müller JD. Dual-color photon counting histogram analysis of mRFP1 and EGFP in living cells. Biophys. J. 2006;91:4273–84. doi: 10.1529/biophysj.106.085845. [DOI] [PMC free article] [PubMed] [Google Scholar]
- 21.Chen Y, Wei LN, Müller JD. Probing protein oligomerization in living cells with fluorescence fluctuation spectroscopy. Proc. Natl. Acad. Sci. USA. 2003;100:15492–97. doi: 10.1073/pnas.2533045100. [DOI] [PMC free article] [PubMed] [Google Scholar]
- 22.Palo K, Brand L, Eggeling C, Jäger S, Kask P, Gall K. Fluorescence intensity and lifetime distribution analysis: toward higher accuracy in fluorescence fluctuation spectroscopy. Biophys. J. 2002;83:605–18. doi: 10.1016/S0006-3495(02)75195-3. [DOI] [PMC free article] [PubMed] [Google Scholar]
- 23.Palo K, Mets U, Jäger S, Kask P, Gall K. Fluorescence intensity multiple distributions analysis: concurrent determination of diffusion times and molecular brightness. Biophys. J. 2000;79:2858–66. doi: 10.1016/S0006-3495(00)76523-4. [DOI] [PMC free article] [PubMed] [Google Scholar]
- 24.Kask P, et al. Two-dimensional fluorescence intensity distribution analysis: theory and applications. Biophys. J. 2000;78:1703–13. doi: 10.1016/S0006-3495(00)76722-1. [DOI] [PMC free article] [PubMed] [Google Scholar]
- 25.McKinney SA, Joo C, Ha T. Analysis of single molecule FRET trajectories using hidden Markov modeling. Biophys. J. 2006;91:1941–51. doi: 10.1529/biophysj.106.082487. [DOI] [PMC free article] [PubMed] [Google Scholar]
- 26.Sisamakis E, Valeri A, Kalinin S, Rothwell PJ, Seidel CA. Accurate single-molecule FRET studies using multiparameter fluorescence detection. Methods Enzymol. 2010;475:455–514. doi: 10.1016/S0076-6879(10)75018-7. [DOI] [PubMed] [Google Scholar]
- 27.Kalinin S, Valeri A, Antonik M, Felekyan S, Seidel CA. Detection of structural dynamics by FRET: a photon distribution and fluorescence lifetime analysis of systems with multiple states. J. Phys. Chem. B. 2010;114:7983–95. doi: 10.1021/jp102156t. [DOI] [PubMed] [Google Scholar]
- 28.Weidtkamp-Peters S, Felekyan S, Bleckmann A, Simon R, Becker W, et al. Multiparameter fluorescence image spectroscopy to study molecular interactions. Photochem. Photobiol. Sci. 2009;8:470–80. doi: 10.1039/b903245m. [DOI] [PubMed] [Google Scholar]
- 29.Kalinin S, Felekyan S, Valeri A, Seidel CA. Characterizing multiple molecular states in single-molecule multiparameter fluorescence detection by probability distribution analysis. J. Phys. Chem. B. 2008;112:8361–74. doi: 10.1021/jp711942q. [DOI] [PubMed] [Google Scholar]
- 30.Kalinin S, Felekyan S, Antonik M, Seidel CA. Probability distribution analysis of single-molecule fluorescence anisotropy and resonance energy transfer. J. Phys. Chem. B. 2007;111:10253–62. doi: 10.1021/jp072293p. [DOI] [PubMed] [Google Scholar]
- 31.Gaiduk A, Kühnemuth R, Felekyan S, Antonik M, Becker W, et al. Fluorescence detection with high time resolution: from optical microscopy to simultaneous force and fluorescence spectroscopy. Microsc. Res. Tech. 2007;70:433–41. doi: 10.1002/jemt.20430. [DOI] [PubMed] [Google Scholar]
- 32.Widengren J, Kudryavtsev V, Antonik M, Berger S, Gerken M, Seidel CA. Single-molecule detection and identification of multiple species by multiparameter fluorescence detection. Anal. Chem. 2006;78:2039–50. doi: 10.1021/ac0522759. [DOI] [PubMed] [Google Scholar]
- 33.Eigen M, Rigler R. Sorting single molecules: application to diagnostics and evolutionary biotechnology. Proc. Natl. Acad. Sci. USA. 1994;91:5740–47. doi: 10.1073/pnas.91.13.5740. [DOI] [PMC free article] [PubMed] [Google Scholar]
- 34.Lord SJ, Lee HL, Moerner WE. Single-molecule spectroscopy and imaging of biomolecules in living cells. Anal. Chem. 2010;82:2192–203. doi: 10.1021/ac9024889. [DOI] [PMC free article] [PubMed] [Google Scholar]
- 35.Bacia K, Schwille P. Fluorescence correlation spectroscopy. Methods Mol. Biol. 2007;398:73–84. doi: 10.1007/978-1-59745-513-8_7. [DOI] [PubMed] [Google Scholar]
- 36.Kim SA, Heinze KG, Schwille P. Fluorescence correlation spectroscopy in living cells. Nat. Methods. 2007;4:963–73. doi: 10.1038/nmeth1104. [DOI] [PubMed] [Google Scholar]
- 37.Haustein E, Schwille P. Fluorescence correlation spectroscopy: novel variations of an established technique. Annu. Rev. Biophys. Biomol. Struct. 2007;36:151–69. doi: 10.1146/annurev.biophys.36.040306.132612. [DOI] [PubMed] [Google Scholar]
- 38.Bacia K, Kim SA, Schwille P. Fluorescence cross-correlation spectroscopy in living cells. Nat. Methods. 2006;3:83–89. doi: 10.1038/nmeth822. [DOI] [PubMed] [Google Scholar]
- 39.Burkhardt M, Heinze KG, Schwille P. Four-color fluorescence correlation spectroscopy realized in a grating-based detection platform. Opt. Lett. 2005;30:2266–68. doi: 10.1364/ol.30.002266. [DOI] [PubMed] [Google Scholar]
- 40.Kim SA, Heinze KG, Bacia K, Waxham MN, Schwille P. Two-photon cross-correlation analysis of intracellular reactions with variable stoichiometry. Biophys. J. 2005;88:4319–36. doi: 10.1529/biophysj.104.055319. [DOI] [PMC free article] [PubMed] [Google Scholar]
- 41.Heinze KG, Jahnz M, Schwille P. Triple-color coincidence analysis: one step further in following higher order molecular complex formation. Biophys. J. 2004;86:506–16. doi: 10.1016/S0006-3495(04)74129-6. [DOI] [PMC free article] [PubMed] [Google Scholar]
- 42.Bacia K, Schwille P. A dynamic view of cellular processes by in vivo fluorescence auto- and cross-correlation spectroscopy. Methods. 2003;29:74–85. doi: 10.1016/s1046-2023(02)00291-8. [DOI] [PubMed] [Google Scholar]
- 43.Schwille P, Meyer-Almes FJ, Rigler R. Dual-color fluorescence cross-correlation spectroscopy for multicomponent diffusional analysis in solution. Biophys. J. 1997;72:1878–86. doi: 10.1016/S0006-3495(97)78833-7. [DOI] [PMC free article] [PubMed] [Google Scholar]
- 44.Weissman M, Schindler H, Feher G. Determination of molecular weights by fluctuation spectroscopy: application to DNA. Proc. Natl. Acad. Sci. USA. 1976;73:2776–80. doi: 10.1073/pnas.73.8.2776. [DOI] [PMC free article] [PubMed] [Google Scholar]
- 45.Koppel DE, Morgan F, Cowan A, Carson JH. Scanning concentration correlation spectroscopy using the confocal laser microscope. Biophys. J. 1994;66:502–7. doi: 10.1016/s0006-3495(94)80801-x. [DOI] [PMC free article] [PubMed] [Google Scholar]
- 46.Berland KM, So PT, Chen Y, Mantulin WW, Gratton E. Scanning two-photon fluctuation correlation spectroscopy: particle counting measurements for detection of molecular aggregation. Biophys. J. 1996;71:410–20. doi: 10.1016/S0006-3495(96)79242-1. [DOI] [PMC free article] [PubMed] [Google Scholar]
- 47.Petrásek Z, Hoege C, Mashaghi A, Ohrt T, Hyman AA, Schwille P. Characterization of protein dynamics in asymmetric cell division by scanning fluorescence correlation spectroscopy. Biophys. J. 2008;95:5476–86. doi: 10.1529/biophysj.108.135152. [DOI] [PMC free article] [PubMed] [Google Scholar]
- 48.Petrásek Z, Schwille P. Photobleaching in two-photon scanning fluorescence correlation spectroscopy. Chemphyschem. 2008;9:147–58. doi: 10.1002/cphc.200700579. [DOI] [PubMed] [Google Scholar]
- 49.Ries J, Chiantia S, Schwille P. Accurate determination of membrane dynamics with line-scan FCS. Biophys. J. 2009;96:1999–2008. doi: 10.1016/j.bpj.2008.12.3888. [DOI] [PMC free article] [PubMed] [Google Scholar]
- 50.Ries J, Yu SR, Burkhardt M, Brand M, Schwille P. Modular scanning FCS quantifies receptor-ligand interactions in living multicellular organisms. Nat. Methods. 2009;6:643–45. doi: 10.1038/nmeth.1355. [DOI] [PubMed] [Google Scholar]
- 51.Krishnan K, Holub O, Gratton E, Clayton AHA, Cody S, Moens PDJ. Profilin interaction with phosphatidylinositol (4,5)-bisphosphate destabilizes the membrane of giant unilamellar vesicles. Biophys. J. 2009;96:5112–21. doi: 10.1016/j.bpj.2009.03.034. [DOI] [PMC free article] [PubMed] [Google Scholar]
- 52.Dertinger T, Pacheco V, von der Hocht I, Hartmann R, Gregor I, Enderlein J. Two-focus fluorescence correlation spectroscopy: a new tool for accurate and absolute diffusion measurements. Chemphyschem. 2007;8:433–43. doi: 10.1002/cphc.200600638. [DOI] [PubMed] [Google Scholar]
- 53.Petersen NO, Brown C, Kaminski A, Rocheleau J, Srivastave M, Wiseman PW. Analysis of membrane protein cluster densities and sizes in situ by image correlation spectroscopy. Faraday Discuss. 1998;111:289–305. doi: 10.1039/a806677i. [DOI] [PubMed] [Google Scholar]
- 54.Petersen NO. Scanning fluorescence correlation spectroscopy. I. Theory and simulation of aggregation measurements. Biophys. J. 1986;49:809–15. doi: 10.1016/S0006-3495(86)83709-2. [DOI] [PMC free article] [PubMed] [Google Scholar]
- 55.Petersen NO, Höddelius PL, Wiseman PW, Seger O, Magnusson KE. Quantitation of membrane receptor distributions by image correlation spectroscopy: concept and application. Biophys. J. 1993;165:1135–46. doi: 10.1016/S0006-3495(93)81173-1. [DOI] [PMC free article] [PubMed] [Google Scholar]
- 56.Kolin DL, Wiseman PW. Advances in image correlation spectroscopy: measuring number densities, aggregation states, and dynamics of fluorescently labeled macromolecules in cells. Cell Biochem. Biophys. 2007;49:141–64. doi: 10.1007/s12013-007-9000-5. [DOI] [PubMed] [Google Scholar]
- 57.Durisic N, Bachir AI, Kolin DL, Hébert B, Lagerholm BC, et al. Detection and correction of blinking bias in image correlation transport measurements of quantum dot tagged macromolecules. Biophys. J. 2007;93:1338–46. doi: 10.1529/biophysj.107.106864. [DOI] [PMC free article] [PubMed] [Google Scholar]
- 58.Brown CM, Hébert B, Kolin DL, Zareno J, Whitmore L, et al. Probing the integrin-actin linkage using high-resolution protein velocity mapping. J. Cell Sci. 2006;119:5204–14. doi: 10.1242/jcs.03321. [DOI] [PubMed] [Google Scholar]
- 59.Kolin DL, Ronis D, Wiseman PW. k-Space image correlation spectroscopy: a method for accurate transport measurements independent of fluorophore photophysics. Biophys. J. 2006;91:3061–75. doi: 10.1529/biophysj.106.082768. [DOI] [PMC free article] [PubMed] [Google Scholar]
- 60.Bates IR, Hébert B, Luo Y, Liao J, Bachir AI, et al. Membrane lateral diffusion and capture of CFTR within transient confinement zones. Biophys. J. 2006;91:1046–58. doi: 10.1529/biophysj.106.084830. [DOI] [PMC free article] [PubMed] [Google Scholar]
- 61.Kolin DL, Costantino S, Wiseman PW. Sampling effects, noise, and photobleaching in temporal image correlation spectroscopy. Biophys. J. 2006;90:628–39. doi: 10.1529/biophysj.105.072322. [DOI] [PMC free article] [PubMed] [Google Scholar]
- 62.Costantino S, Comeau JW, Kolin DL, Wiseman PW. Accuracy and dynamic range of spatial image correlation and cross-correlation spectroscopy. Biophys. J. 2005;89:1251–60. doi: 10.1529/biophysj.104.057364. [DOI] [PMC free article] [PubMed] [Google Scholar]
- 63.Hébert B, Costantino S, Wiseman PW. Spatiotemporal image correlation spectroscopy (STICS) theory, verification, and application to protein velocity mapping in living CHO cells. Biophys. J. 2005;88:3601–14. doi: 10.1529/biophysj.104.054874. [DOI] [PMC free article] [PubMed] [Google Scholar]
- 64.Wiseman PW, Brown CM, Webb DJ, Hébert B, Johnson NL, et al. Spatial mapping of integrin interactions and dynamics during cell migration by image correlation microscopy. J. Cell Sci. 2004;117:5521–34. doi: 10.1242/jcs.01416. [DOI] [PubMed] [Google Scholar]
- 65.Wiseman PW, Capani F, Squier JA, Martone ME. Counting dendritic spines in brain tissue slices by image correlation spectroscopy analysis. J. Microsc. 2002;205:177–86. doi: 10.1046/j.0022-2720.2001.00985.x. [DOI] [PubMed] [Google Scholar]
- 66.Wiseman PW, Squier JA, Ellisman MH, Wilson KR. Two-photon image correlation spectroscopy and image cross-correlation spectroscopy. J. Microsc. 2000;200:14–25. doi: 10.1046/j.1365-2818.2000.00736.x. [DOI] [PubMed] [Google Scholar]
- 67.Wiseman PW, Petersen NO. Image correlation spectroscopy. II. Optimization for ultrasensitive detection of preexisting platelet-derived growth factor-beta receptor oligomers on intact cells. Biophys. J. 1999;76:963–77. doi: 10.1016/S0006-3495(99)77260-7. [DOI] [PMC free article] [PubMed] [Google Scholar]
- 68.Wiseman PW, Höddelius P, Petersen NO, Magnusson KE. Aggregation of PDGF-beta receptors in human skin fibroblasts: characterization by image correlation spectroscopy (ICS) FEBS Lett. 1997;401:43–48. doi: 10.1016/s0014-5793(96)01429-9. [DOI] [PubMed] [Google Scholar]
- 69.Digman MA, Brown CM, Sengupta P, Wiseman PW, Horwitz AR, Gratton E. Measuring fast dynamics in solutions and cells with a laser scanning microscope. Biophys. J. 2005;89:1317–27. doi: 10.1529/biophysj.105.062836. [DOI] [PMC free article] [PubMed] [Google Scholar]
- 70.Digman MA, Sengupta P, Wiseman PW, Brown CM, Horwitz AR, Gratton E. Fluctuation correlation spectroscopy with a laser-scanning microscope: exploiting the hidden time structure. Biophys. J. 2005;88:L33–36. doi: 10.1529/biophysj.105.061788. [DOI] [PMC free article] [PubMed] [Google Scholar]
- 71.Digman MA, Wiseman PW, Choi C, Horwitz AR, Gratton E. Stoichiometry of molecular complexes at adhesions in living cells. Proc. Natl. Acad. Sci. USA. 2009;106:2170–75. doi: 10.1073/pnas.0806036106. [DOI] [PMC free article] [PubMed] [Google Scholar]
- 72.Digman MA, Wiseman PW, Horwitz AR, Gratton E. Detecting protein complexes in living cells from laser scanning confocal image sequences by the cross correlation raster image spectroscopy method. Biophys. J. 2009;96:707–16. doi: 10.1016/j.bpj.2008.09.051. [DOI] [PMC free article] [PubMed] [Google Scholar]
- 73.Digman MA, Gratton E. Analysis of diffusion and binding in cells using the RICS approach. Microsc. Res. Tech. 2009;72:323–32. doi: 10.1002/jemt.20655. [DOI] [PMC free article] [PubMed] [Google Scholar]
- 74.Sanabria H, Digman MA, Gratton E, Waxham MN. Spatial diffusivity and availability of intracellular calmodulin. Biophys. J. 2008;95:6002–15. doi: 10.1529/biophysj.108.138974. [DOI] [PMC free article] [PubMed] [Google Scholar]
- 75.Brown CM, Dalal RB, Hébert B, Digman MA, Horwitz AR, Gratton E. Raster image correlation spectroscopy (RICS) for measuring fast protein dynamics and concentrations with a commercial laser scanning confocal microscope. J. Microsc. 2008;229:78–91. doi: 10.1111/j.1365-2818.2007.01871.x. [DOI] [PMC free article] [PubMed] [Google Scholar]
- 76.Digman MA, Dalal R, Horwitz AF, Gratton E. Mapping the number of molecules and brightness in the laser scanning microscope. Biophys. J. 2008;94:2320–32. doi: 10.1529/biophysj.107.114645. [DOI] [PMC free article] [PubMed] [Google Scholar]
- 77.Digman MA, Brown CM, Horwitz AR, Mantulin WW, Gratton E. Paxillin dynamics measured during adhesion assembly and disassembly by correlation spectroscopy. Biophys. J. 2008;94:2819–31. doi: 10.1529/biophysj.107.104984. [DOI] [PMC free article] [PubMed] [Google Scholar]
- 78.Dalal RB, Digman MA, Horwitz AF, Vetri V, Gratton E. Determination of particle number and brightness using a laser scanning confocal microscope operating in the analog mode. Microsc. Res. Tech. 2008;71:69–81. doi: 10.1002/jemt.20526. [DOI] [PubMed] [Google Scholar]
- 79.Ossato G, Digman MA, Aiken C, Lukacsovich T, Marsh JL, Gratton E. A two-step path to inclusion formation of Huntingtin peptides revealed by number and brightness analysis. Biophys. J. 2010;98:3078–85. doi: 10.1016/j.bpj.2010.02.058. [DOI] [PMC free article] [PubMed] [Google Scholar]
- 80.Földes-Papp Z. Fluorescence fluctuation spectroscopic approaches to the study of a single molecule diffusing in solution and a live cell without systemic drift or convection: a theoretical study. Curr. Pharm. Biotechnol. 2007;8:261–73. doi: 10.2174/138920107782109930. [DOI] [PubMed] [Google Scholar]
- 81.Földes-Papp Z. ‘True’ single-molecule molecule observations by fluorescence correlation spectroscopy and two-color fluorescence cross-correlation spectroscopy. Exp. Mol. Pathol. 2007;82:147–55. doi: 10.1016/j.yexmp.2006.12.002. [DOI] [PubMed] [Google Scholar]
- 82.Földes-Papp Z. What it means to measure a single molecule in a solution by fluorescence fluctuation spectroscopy. Exp. Mol. Pathol. 2006;80:209–18. doi: 10.1016/j.yexmp.2006.01.001. [DOI] [PubMed] [Google Scholar]
- 83.Földes-Papp Z, Demel U, Tilz GP. A new concept for ultrasensitive fluorescence measurements of molecules in solution and membrane: 2. The individual immune molecule. J. Immunol. Methods. 2004;286:13–20. doi: 10.1016/j.jim.2004.01.007. [DOI] [PubMed] [Google Scholar]
- 84.Földes-Papp Z, Baumann G, Demel U, Tilz GP. Counting and behavior of an individual fluorescent molecule without hydrodynamic flow, immobilization, or photon count statistics. Curr. Pharm. Biotechnol. 2004;5:163–72. doi: 10.2174/1389201043376986. [DOI] [PubMed] [Google Scholar]
- 85.Cardarelli F, Gratton E. In vivo imaging of single-molecule translocation through nuclear pore complexes by pair correlation functions. PLoS One. 2010;5:e10475. doi: 10.1371/journal.pone.0010475. [DOI] [PMC free article] [PubMed] [Google Scholar]
- 86.Korlann Y, Dertinger T, Michalet X, Weiss S, Enderlein J. Measuring diffusion with polarization-modulation dual-focus fluorescence correlation spectroscopy. Opt. Express. 2008;16:14609–16. doi: 10.1364/oe.16.014609. [DOI] [PMC free article] [PubMed] [Google Scholar]
- 87.Ruan Q, Chen Y, Gratton E, Glaser M, Mantulin WW. Cellular characterization of adenylate kinase and its isoform: two-photon excitation fluorescence imaging and fluorescence correlation spectroscopy. Biophys. J. 2002;83:3177–87. doi: 10.1016/S0006-3495(02)75320-4. [DOI] [PMC free article] [PubMed] [Google Scholar]
- 88.Saxton MJ, Jacobson K. Single-particle tracking: applications to membrane dynamics. Annu. Rev. Biophys. Biomol. Struct. 1997;26:373–99. doi: 10.1146/annurev.biophys.26.1.373. [DOI] [PubMed] [Google Scholar]
- 89.Schmidt T, Schutz GJ, Baumgartner W, Gruber HJ, Schindler H. Imaging of single molecule diffusion. Proc. Natl. Acad. Sci. USA. 1996;93:2926–29. doi: 10.1073/pnas.93.7.2926. [DOI] [PMC free article] [PubMed] [Google Scholar]