

Abstract
Changes in gene expression were examined by microarray analysis during development of the eyed surface dwelling (surface fish) and blind cave-dwelling (cavefish) forms of the teleost Astyanax mexicanus De Filippi, 1853. The cross-species microarray used surface and cavefish RNA hybridized to a DNA chip prepared from a closely related species, the zebrafish Danio rerio Hamilton, 1822. We identified a total of 67 differentially expressed probe sets at three days post-fertilization: six upregulated and 61 downregulated in cavefish relative to surface fish. Many of these genes function either in eye development and/or maintenance, or in programmed cell death. The upregulated probe set showing the highest mean fold change was similar to the human ubiquitin specific protease 53 gene. The downregulated probe sets showing some of the highest fold changes corresponded to genes with roles in eye development, including those encoding gamma crystallins, the guanine nucleotide binding proteins Gnat1 and Gant2, a BarH-like homeodomain transcription factor, and rhodopsin. Downregulation of gamma-crystallin and rhodopsin was confirmed by in situ hybridization and immunostaining with specific antibodies. Additional downregulated genes encode molecules that inhibit or activate programmed cell death. The results suggest that cross-species microarray can be used for identifying differentially expressed genes in cavefish, that many of these genes might be involved in eye degeneration via apoptotic processes, and that more genes are downregulated than upregulated in cavefish, consistent with the predominance of morphological losses over gains during regressive evolution.
Keywords: apoptosis, blind cavefish, cross-species microarray, differentially expressed genes, eye development
INTRODUCTION
The teleost Astyanax mexicanus De Filippi, 1853 is an emerging model system for studying the evolution of development (Jeffery 2008). This species consists of a pigmented surface dwelling form with eyes (surface fish) and a blind albinitic cave dwelling (cavefish) form (Fig. 1A, B). Many traits have been gained and lost during the evolution of cavefish from its surface fish ancestor, but the most prominent regressive features are the absence of eyes and pigmentation. Recent studies have shown that melanin-containing pigment cells do not develop because of a mutation in the oca2 gene (Protas et al. 2006). The oca2 gene normally functions in supplying sufficient amounts of L-DOPA, a tyrosinase substrate and melanin precursor. Loss of oca2 function causes a block in melanin synthesis and failure of melanophores to differentiate. Eye degeneration is a more complex phenotype controlled by at least 12 different genes (Protas et al. 2007). None of these mutated eye genes have been identified. Therefore, development of effective means to identify the genes involved in eye degeneration is of major importance in understanding blind cavefish evolution and development.
Figure 1.

(A–D) Astyanax surface fish (A,C) and cavefish (B,D) adults (A,B) and 3-days post-fertilization larvae (C, D). Cavefish have no eyes and lack body melanin pigmentation. Cavefish larvae have small degenerating eye primordia lacking pigmentation. Arrows: eye primordia. Arrowheads:body pigment cells in surface fish. Scale bar in (C): 200 μm; magnification is the same in (C) and (D). (E) Diagram showing eye development in surface fish and eye degeneration in cavefish. Left: similar eye primordia are formed in surface fish (above) and cavefish (below) embryos. Middle and right: eyes differentiate and grow continuously during surface fish development; whereas they initially increase in size, subsequently degenerate and eventually sink into the orbit in cavefish.
Despite the absence of eyes in adults, embryonic cavefish develop eye primordia consisting of a lens and optic cup (Fig. 1E). Instead of differentiating, the cavefish lens undergoes massive apoptosis and eventually disappears (Jeffery & Martasian 1998; Soares et al. 2004). Normal lens fiber differentiation involves the removal of nuclei and other organelles during an abbreviated apoptosis-like event (Wride 1996; Dalm 1999). In the cavefish lens, however, apoptosis runs to completion with degraded nuclei being retained in lens fiber cell progenitors arrested prior to terminal differentiation. The development of other optic tissues is also affected in cavefish: the retina becomes disorganized and ceases to grow, photoreceptor cells degenerate, and the cornea, iris and ciliary body are not induced (Langecker et al. 1993; Yamamoto & Jeffery 2000; Alunni et al. 2007; Strickler et al. 2007a). The microophthalmic cavefish eye eventually sinks into the orbit and is overgrown by connective tissue and epidermis. Eye formation can be rescued during embryo-genesis by transplantation of a surface fish lens into the cavefish optic cup (Yamamoto & Jeffery 2000), suggesting an important role for the lens in normal eye development.
Thus far, three different genes or gene systems have been implicated in controlling cavefish eye degeneration: two whose expression is upregulated and one whose expression is downregulated. Expression of hedgehog and downstream target genes is increased along the anterior midline in cavefish embryos, resulting in decreased activity of the negatively controlled pax6 gene in eye primordia (Yamamoto et al. 2004). Hyperactivity of the Hedgehog signaling pathway appears to be a cause of eye degeneration because lens apoptosis can be specifically induced by sonic hedgehog overexpression in surface fish embryos (Yamamoto et al. 2004). In addition, hsp90α, which encodes a molecular chaperone, is activated in the cavefish lens (Hooven et al. 2004). Thus far, the only known downregulated gene during cavefish eye development encodes the anti-apoptotic factor αA-crystallin (Behrens et al. 1998; Strickler et al. 2007b).
High throughput searches for genes showing a change in expression levels compared to surface fish is one way to identify genes underlying the loss of eyes and other trait changes in cavefish. DNA microarray technology is useful in identifying differentially expressed genes within a single species (Chauhan et al. 2002; Michaut et al. 2003). However, producing DNA chips for microarray analysis involves isolation of a large number of transcribed sequences, limiting its application to organisms for which many genes have already been identified: namely, human, yeast, mouse, Drosophila and Danio rerio Hamilton, 1822 (zebrafish), a teleost closely related to Astyanax. However, microarray analyses have also been successful when the research organism does not match the organism used to produce the microarray chip (Kayo et al. 2001). Here we report the results of a cross-species microarray approach that has successfully identified many differentially expressed genes in blind cavefish.
MATERIALS AND METHODS
Biological materials
Astynanx surface fish were originally collected at Balmorhea State Park, Texas, USA. Cavefish were collected from Cueva de El Pachón, Tamaulipas, Mexico. Fish were maintained in the laboratory on a 14:10 h L:D photoperiod at 25°C and spawned naturally. Embryos were collected and raised at 25°C.
RNA isolation
Total RNA was extracted from 3-day post-fertilization (dpf) surface fish and cavefish larvae using the RiboPure RNA Isolation kit (Ambion, Austin, Texas, USA). RNA was converted into double stranded cDNA, as described previously (Strickler et al. 2007b). Biotin labeled antisense cRNA was produced from cDNA to use as a microarray probe.
Microarray analysis
Surface fish and cavefish cRNA was hybridized to Affymetrix Zebrafish Genome Array chips with 16 oligonucleotide pairs representing approximately 14900 transcripts (Affymetrix, Santa Clara, California, USA). Five separate pair-wise hybridizations were performed. The pair-wise hybridizations used surface fish and cavefish cRNA extracted from three different clutches of 3-dpf larvae. The three pairs of cRNA probes were used individually for the first three hybridizations. In the last two hybridizations, cRNA probes prepared from equal amounts of each of the three-paired RNA samples were combined. The probes were hybridized to the arrays overnight at 45°C and subsequently washed, stained and scanned according to the Affymetrix Gene Chip Expression Analysis Technical Manual. Array chip scans were stored as digital cell intensity (CEL) files for analysis purposes.
Microarray chip analysis was performed using the DNA-Chip Analyzer (dChip; Li & Wong 2001a). Surface fish and cavefish CEL images from each of the five replications were loaded into dChip. CEL files were read and normalized using the invariant set normalization method (Li & Wong 2001a). Samples were then analyzed by applying the model-based expression method using the PM/MM difference model (Li & Wong 2001b). A comparison analysis was performed using the five cavefish chip arrays as the baseline and the five surface fish arrays as the experimental samples. To perform the analysis, group means of intensity with standard error for each probe set were determined for both baseline (surface fish) and experimental (cavefish) samples. Comparison criteria of at least a two fold change (FC) between the means using the lower 90% confidence bound of FC were used. During the analysis, a random permutation comparison was run 50 times to determine the false discovery rate of putative significant genes. This 50-permutation analysis, represented as a mean percentage value, was repeated 20 times, yielding a mean false discovery rate value of 13.4%.
The main analysis results were further interpreted by entering the probe set identification numbers into an expression batch query to determine known gene homologies (http://www.affymetrix.com/index.affx). This analysis provided gene ontology information, including descriptions of biological processes and molecular and cellular functions. Probe sets not identified by the Affymetrix expression batch query were subjected to further analysis. Similarities or possible homologies for these probe sets were determined by performing a BlastX analysis on genome and probe sequences from the Affymetrix website.
Polymerase chain reaction amplification of gene sequences
RNA extraction, cDNA synthesis, and reverse transcription polymerase chain reaction (PCR) amplification techniques were performed according to Strickler et al. (2007b). Gamma-M crystallin DNA was amplified using the degenerate oligonucleotide primers γC1 (5′-TCA TCTTCTACGAGGAYAAGG-3) and γC2 (5′-TGAT ACGCCTCATGCTCATG-3′) designed from carp (M2 and M3), Xenopus, rat (γA), mouse (γF) crystallin sequences deposited in GenBank. The Astyanax rhodopsin gene sequence (GenBank U12328), originally cloned by Yokoyama et al. (1995), was used to design the oligonucelotide primers Rho1 (5′-ATGAA CGGGACAGAGGGTCCATAC-3′) and Rho2 (5′-TTATGCCGG GGACACGGAGGAGAC-3′). The PCR products were purified by agarose gel electrophoresis. Bands of the expected size were sequenced, subjected to Blast analysis to verify their identity, and inserted into the pPCR-Script AMP SK(+) vector (Stratagene, La Jolla, California, USA) to prepare RNA probes for in situ hybridization (Strickler et al. 2007b).
In situ hybridization
In situ hybridization was performed on whole mounts of larvae fixed in 4% paraformaldehyde, as described by Strickler et al. (2007b). After hybridization, the stained larvae were postfixed overnight at 4°C in 4% paraformaldehyde, dehydrated through an ethanol series, embedded in Paraplast, and sectioned at 8 μm. The sections were mounted on glass slides and viewed by light microscopy.
Immunostaining
For immunostaining, larvae were fixed in 4% paraformaldehyde overnight at 4°C, dehydrated through an ethanol series, embedded in Paraplast, and sectioned at 8μm. Sections were incubated with a polyclonal antibody to gamma crystallin (kindly provided by Dr Robert Grainger, University of Virginia) or rhodopsin (Leinco Technologies, St. Louis, Missouri, USA), and staining was visualized using DAB substrate, as described by Yamamoto and Jeffery (2000). The sections were counterstained with hematoxylin, mounted, and viewed by light microscopy.
RESULTS AND DISCUSSION
Microarray analysis
To identify differentially expressed genes, RNA from 3-dpf surface fish and cavefish larvae was hybridized to Affymetrix Zebrafish Genome Array chips. This stage of development was selected for analysis because it is the first time that widespread eye degeneration and growth arrest is visibly apparent in cavefish (Fig. 1C–E). Microarray analysis revealed 67 differentially expressed probe sets: 6 whose expression is increased and 61 whose expression is decreased. In Table 1, each probe set is listed according to its change in level of expression, with positive values indicating upregulation and negative values indicating downregulation. According to the Affymetrix sequence database, 31 probe sets have homologies or similarities to previously identified zebrafish genes. The 36 remaining probe sets that could not be identified using the Affymetrix database were further investigated by BLAST and web searching, which yielded information on the identity of 14 additional probe sets. Therefore, microarray analysis identified 50 known and 17 unknown genes that are potentially subject to differential regulation in cavefish embryos.
Table 1.
Differentially expressed genes in 3-days post-fertilization cavefish relative to surface fish determined by microarray analysis
| Gene homology | Probe set | GenBank Accession Number | Fold change |
|---|---|---|---|
| Upregulation | |||
| Ubiquitin specific protease 53 | Dr.14618.1.A1_at | BM185013 | +1474.3 |
| Unknown | Dr.20823.1.A1_at | BI326634 | +42.0 |
| Transmembrane protein 33 | Dr.7488.1.S1_at | BC044544.1 | +10.8 |
| Neuroligin | Dr.18973.1.A1_at | BI709496 | +8.5 |
| Unknown | Dr.18477.1.A1_at | BM154222 | +4.0 |
| Unknown | Dr.16871.3.A1_at | AI544824 | +2.8 |
| Downregulation | |||
| Similar to gamma B crystallin | Dr.25729.1.S1_at | BM573934 | −61.2 |
| Gamma M4 crystallin | Dr.19583.1.S1_at | AL915133 | −33.5 |
| Guanosine nucleotide binding protein 1 | Dr.9899.1.S1_at | NM_131868.1 | −29.5 |
| Similar to BarH | Dr.16934.1.A1_at | BI325578 | −25.9 |
| Rhodopsin | Dr.354.1.S1_at | NM_131084.1 | −23.0 |
| Guanosine nucleotide binding protein 2 | Dr.9881.1.S1_at | NM_131869.1 | −17.2 |
| Unknown | Dr.11355.1.A1_at | BG308730 | −15.5 |
| Werner helicase interacting protein 1 | Dr.16690.1.A1_at | BI980401 | −13.5 |
| Neurofilament protein M | Dr.19653.1.S1_at | AL919725 | −12.3 |
| Unknown | Dr.3789.1.A1_at | BI890279 | −9.8 |
| Similar to Six3/Six6/Optx2. | Dr.26486.1.S1_at | BC053123.1 | −9.1 |
| Similar to F-actin capping protein | Dr.10440.1.A1_at | BE605864 | −8.0 |
| Heparain binding EGF-like growth factor protein alpha–1 | Dr.16053.1.S1_at | BM531631 | −7.6 |
| Topoisomerase I | Dr.7467.1.S1_at | BC044159.1 | −7.5 |
| c-Fos interacting transcription Factor 2 | Dr.2401.1.A1_at | CD604147 | −7.0 |
| Bobby sox homolog | Dr.22157.1.A1_at | AW019059 | −7.0 |
| Cytokine inducible SH2-containing protein | Dr.9911.1.A1_at | AW826769 | −6.7 |
| egl-9 homolog 3 | Dr.9457.1.A1_at | BI671269 | −6.2 |
| Unknown | Dr.25949.1.A1_at | CD605589 | −6.3 |
| Gamma M2c crystallin | Dr.20815.2.S1_at | BQ783659 | −6.2 |
| Protocadherin A | Dr.21025.1.A1_at | AF043903.1 | −6.1 |
| Unknown | Dr.12482.1.S1_x_at | BM036408 | −6.0 |
| Bromodomain-containing protein 8 | Dr.11534.2.A1_at | AL729194 | −6.0 |
| APTase type 13A | Dr.11388.1.S1_at | BI889248 | −5.9 |
| Unknown | Dr.16478.1.A1_at | BI705297 | −5.9 |
| Similar to F-box leucine rich repeat protein 2 | Dr.7543.1.A1_at | AW019494 | −5.9 |
| Stomal cell derived factor receptor I isoform a/3 | Dr.10103.1.A1_at | CB890995 | −5.9 |
| Unknown | Dr.11073.1.A1_at | AI588427 | −5.8 |
| Clathrin H chain | Dr.26329.1.A1_at | BG728815 | −5.8 |
| Unknown | Dr.16610.1.S1_at | BI983598 | −5.5 |
| ATPase V1–D | Dr.14072.1.S1_at | BC045370.1 | −5.4 |
| Unknown from retina cDNA | Dr.12806.1.A1_at | BI879720 | −5.3 |
| RAD54-like DNA repair protein | Dr.5408.1.S1_at | BC046050.1 | −5.1 |
| Unknown | Dr.2197.1.A1_at | AI721729 | −4.9 |
| Similar to RAD 21 homolog | Dr.15478.1.A1_at | BM316135 | −4.8 |
| Putative XXC 177 protein | Dr.19902.2.A1_x_at | AW116196 | −4.8 |
| ATP binding cassette transporter G-2a | Dr.22153.1.A1_at | AW019053 | −4.7 |
| cGMP-gated cation channel rod photoreceptor | Dr.4773.1.A1_at | AL715316 | −4.7 |
| Hepatic transcription factor 2 | Dr.14662.1.S2_at | NM_131880.1 | −4.6 |
| Polyhomeotic pH 1 homolog | Dr.19425.1.S1_at | AB064939.1 | −4.5 |
| Signal recognition particle receptor B | Dr.9914.1.S1_at | BM181827 | −4.3 |
| Jun B proto-onocgene | Dr.10326.1.S1_at | BC053234.1 | −4.3 |
| Unknown | Dr.1002.1.S1_at | BM858769 | −4.2 |
| Unknown | Dr.14191.1.A1_at | BQ109774 | −4.2 |
| Unknown | Dr.22021.1.A1_at | AI957759 | −4.1 |
| Geranyl diphosphatesythetase 1 | Dr.25151.1.S1_at | BC052115.1 | −4.0 |
| F-box leucine rich repeat protein | Dr.16658.1.S1_at | BF937803 | −4.0 |
| Unknown | Dr.12300.1.A1_at | BG728602 | −3.9 |
| Similar to Hsp90α | Dr.25536.1.A1_at | BG306502 | −3.8 |
| MHC class II receptor activity | Dr.9662.1.S1_at | BQ261450 | −3.8 |
| Unknown | Dr.14840.1.A1_at | BM071859 | −3.8 |
| Unknown | Dr.18540.3.A1_at | BI883285 | −3.8 |
| Hydroxymethylbilanesynthetase | Dr.3338.1.S1_at | BC053268.1 | −3.6 |
| Unknown | Dr.26420.1.A1_at | CD606196 | −3.5 |
| Adducin 3 | Dr.10904.1.S1_a_at | BC050486.1 | −3.4 |
| Similar to SRR1-like protein | Dr.16362.1.A1_at | BI430090 | −3.4 |
| Similar to acetyl-coenzyme A dehyrdogenase VL | Dr.3523.1.A1_at | AI964241 | −3.3 |
| Similar to protein tyrosine phosphatase CRYP–2 | Dr.9411.1.A1_at | AL909228 | −3.3 |
| Synaptophysin-like protein | Dr.25595.1.A1_at | BM958030 | −3.2 |
| Similar to phophodiesterase 4B | Dr.16127.1.S1_at | BI887495 | −3.2 |
| Zinc finger protein subfamily 1A5 | Dr.25707.1.A1_at | CD605002 | −3.1 |
The upper list shows probe sets predicted to be upregulated in cavefish (positive values). The lower list shows probe sets predicted to be downregulated in cavefish (negative values). Entries are listed in descending order by absolute value fold change (FC) with the first entry representing the probe set with the highest positive FC and the last entry representing the probe set with the highest negative FC. EGF, epidermal growth factor.
To be certain that genes identified by microarray analysis are actually differentially expressed, it is necessary to use additional means to quantify their mRNA levels. Thus far, two of these genes, gamma crystallin and rhodopsin, have been confirmed in this way (see below), suggesting that cross-species microarray analysis can predict differentially expressed genes in Astyanax. The genes identified by microarray analysis are not a random selection: a large number are known to be associated with two processes: eye development and programmed cell death. The identification of genes involved in these two processes account for some of the major differences between cavefish and surface fish. As might be expected in cases of regressive evolution, the microarray analysis detected mostly downregulated genes. Indeed, 61 out of 67 genes (91%) are downregulated in 3-dpf cavefish relative to surface fish embryos. Together, these results suggest that microarray analysis using a DNA chip from the closely related zebrafish is useful for discovering genes that are differentially expressed during cavefish evolution and development.
We next describe further studies on two of the genes predicted to be downregulated in cavefish that confirm the microarray analysis. Then, in the succeeding paragraphs, we discuss some of the most important genes identified in the microarray analysis and their potential roles in cavefish.
Gamma crystallin and hsp90α downregulation in the cavefish lens
According to microarray analysis, three different gamma crystallin genes may be downregulated in cavefish. Confirmation of this result was sought by investigating mRNA levels by in situ hybridization and protein accumulation by immunostaining. As expected, the cloned gamma-M crystallin gene and gamma crystallin protein are expressed only in the Astyanax lens (Fig. 2). Gamma crystallin transcripts are prevalent in the epithelial layer of the 2-dpf and 3-dpf surface fish lens (Fig. 2A, C). Although transcripts are also detectable in cavefish at these developmental stages, they are confined to a small area within the lens core, which may contain undifferentiated lens fiber cells (Fig. 2B, D). By 3dpf, the lens core area in which gamma crystallin-M mRNA is expressed has become even smaller, this explaining its downregulation. Immunostaining with a gamma crystallin antibody also shows lower amounts of protein accumulation in the cavefish lens, particularly by 3 dpf (Fig. E–H). These results support the microarray analysis in showing that a gamma-M crystallin gene is differentially expressed in cavefish.
Figure 2.
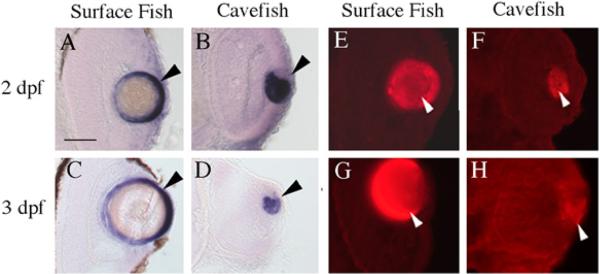
Gamma crystallin mRNA and protein expression. Surface fish. (A, C, E, G) Cavefish (B, D, F, H). Sections showing gamma-M crystallin mRNA expression in the surface fish and cavefish lens determined by whole mount in situ hybridization at 2 (A, B) and 3-days post-fertilization (dpf) (C, D). (E–H) Sections showing gamma crystallin protein expression in the surface fish and cavefish lens (arrowheads) determined by anti body staining at 2 (E, F) and 3 dpf (G, H). Scale bar in A is 50 μ; magnification is the same in each frame. A–D after Strickler et al. (2007b).
Our data, in conjunction with other studies (Behrens et al. 1998; Strickler et al. 2007b), indicates that at least three (αA-crystallin, ß-crystallin, and gamma-M crystallin) and possibly as many as six (including the three gamma crystallin genes predicted to be downregulated by microarray analysis) crystallin genes are downregulated during cavefish lens development. Therefore, there might be widespread downregulation of lens structural proteins during cavefish eye primordium development. This downregulation is interesting in light of the case of hsp90α, a gene previously shown to be upregulated in the cavefish lens (Hooven et al. 2004), and provides further support that the latter gene may be important in eye degeneration.
The hsp90α gene was predicted by microarray to be downregulated rather than upregulated (Table 1), as would have been expected from previous results (Hooven et al. 2004). Perhaps the peak of hsp90α expression in the lens, which occurs at approximately 1.5–2 dpf (Hooven et al. 2004), has subsided by 3 dpf. Alternatively, because this gene is expressed in many tissues under non-stress conditions (Sass et al. 1996), including most of the developing musculature, its overall large signal in microarray analysis might mask smaller changes in the lens.
Rhodopsin downregulation
Microarray analysis predicted that the rhodopsin gene, which encodes a key visual pigment in the photoreceptor layer of the retina, is downregulated in cavefish. The microarray results were confirmed by in situ hybridization. At 3 dpf, an appreciable number of rhodopsin mRNA expressing cells were observed in the surface fish photoreceptor layer (Fig. 3A). In contrast, only a few photoreceptor cells containing rhodopsin mRNA were detected in 3 dpf cavefish (Fig. 3B). At 10 dpf, an uninterrupted layer of rhodopsin mRNA-expressing cells was observed in the photoreceptor layer of the surface fish retina (Fig. 3C). Only a few cells containing rhodopsin mRNA could be found in the cavefish retina at this stage (Fig. 3D). Immunostaining studies provided similar results to those obtained for mRNA distribution: rhodopsin was present in many cells distributed throughout the photoreceptor layer in surface fish (Fig. 3E), whereas it was restricted to just a few widely spaced clusters of cells in the cavefish retina (Fig. 3F). The results show that rhodopsin downregulation can be explained by much fewer numbers of rod cells in the cavefish retina.
Figure 3.

Rhodopsin mRNA and protein expression. (A, C, E) Surface fish. (B,D,F) Cavefish. (A–D) Sections are shown of 3-(A, B) and 10- (C, D) days post-fertilization (dpf) larvae in which rhodopsin mRNA was determined by whole mount in situ hybridization. (E, F) Sections of 10-dpf larvae in which rhodopsin protein was determined by antibody staining. Arrowheads indicate cells stained for rhodopsin mRNA (A–D) or protein (E,F). OL, retinal outer nuclear (photoreceptor) layer. Scale bar in (A): 100μ; magnification is the same in (A) and (B). Scale bar in (C): 200μ; magnification is the same in (C) and (E). Scale bar in (D): 100μ; magnification is the same in (E) and (F).
Eye development and maintenance genes
Many additional genes predicted by microarray analysis to be downregulated in cavefish are known to function in eye development and/or maintenance. Several of the genes with high-fold downregulation in cavefish are involved in photoreceptor function (Table 1). The gnat1 and gnat2 genes that encode guanine nucleotide binding proteins comprise the transducing subunit of the rod and cone G-proteins, respectively (Ray et al.1997; Shen & Raymond 2004) and a differentially expressed gene encodes a protein similar to the receptor cGMP -gated cation channel in rod cells. The gene encoding protocadherin was also identified as downregulated in cavefish. Protocadherin is necessary for the intercalation of photoreceptor cells with the retinal pigment epithelium (Seiler et al. 2005). The genes encoding BarH and Six3/Six6/Optx2 homeodomain transcription factors were recognized as downregulated in cavefish by microarray analysis. In the developing mammalian eye, BarH is expressed in a subset of retinal cells including photoreceptors (Saito et al. 1998). The six3, six6 and optx genes, members of the Six3 gene family, have been im plicated in lens development, retina development, or both processes (Lopez-Rios et al. 1999). It is possible that one or more of these genes might be a cause or consequence of eye degeneration.
Two other downregulated genes are of interest with regard to eye development, protein tyrosine phosphatase (CRYP-2) and the middle molecular weight neurofilament gene (NF-M), which function in axon outgrowth and guidance (Stepanek et al. 2001). NF-M expression has been correlated with projection length and neural arborization (Zopf et al. 1990).
There are significantly fewer axon bundles in the cavefish optic nerve (Soares et al. 2004). Therefore, these genes may be downregulated in cavefish as a cause of or a response to the existence of fewer retinal-tectal projections.
Programmed cell death genes
Microarray analysis resulted in the identification of many differentially expressed genes involved in programmed cell death. Of the genes with highest FC, five are downregulated, and one (ubiquitin specific protease 53) is upregulated. Because of massive apoptosis in the lens (Jeffery and Martasian 1998), it seems that programmed cell death genes would be downregulated rather than upregulated in cavefish. However, genes have been discovered that promote as well as inhibit programmed cell death (St. Clair et al. 1997). Accordingly, the pro-apoptotic genes are expected to be upregulated, whereas anti-apoptotic genes may be downregulated in cavefish. One of the latter, αA-crystallin, has already been identified by other means (Strickler et al. 2007b), although it was not highlighted in the microarray analysis.
The five genes related to apoptosis that microarray analysis predict to be downregulated in cavefish are: RAD21, phosphodiesterase 4B, HB-EGF, Egl- 9/SM-20 and Rad54. RAD21 was the highest-fold downregulated of all genes linked with programmed cell death. The precise role of the RAD21 gene in apoptosis is unclear, but it appears to be involved in DNA stabilization and DNA strand break repair, which are both required for normal cell maintenance as well as programmed cell death (Pati et al. 2002). The gene encoding phosphodiesterase 4B was also predicted to be downregulated in cavefish. Suppression of this gene has been linked to growth inhibition and apoptosis (Ogawa et al. 2002). Cells with more phosphodiesterase might be resistant to programmed cell death, and conversely a decrease in expression of this gene might lead to apoptosis in cavefish. A gene encoding heparin-binding epidermal growth factor (HB-EGF) also showed appreciable downregulation. This gene has been shown to prevent apoptosis (Zhang et al. 2004). HB-EGF can be activated by reactive oxygen species as a result of oxidative stress (Kim et al. 2005), an event leading to programmed cell death. Furthermore, HB-EGF is important in nervous system development, including cell migration, survival and differentiation (Xian & Zhou 1999). Presumptive neural cells of the cavefish retina die by programmed cell death (Strickler et al. 2007a), and downregulation of HB-EGF could be important in this process. Elg-9 is a homolog of the vertebrate SM-20 gene, which has been implicated in caspase-dependent cell death (Straub et al. 2003). Rad54 is involved in DNA stabilization (Wesoly et al. 2006). DNA damage and fragmentation can be a direct cause, as well as an effect, of apoptosis (Belyaev 2005; Janssens et al. 2005). It is possible that RAD54 is instrumental in controlling DNA fragmentation during cavefish apoptosis. Perhaps cavefish have a natural propensity for undergoing programmed cell death as a result of stress encountered in the cave environment.
The gene showing the highest FC of any probe set in this study codes for ubiquitin specific protease 53 (Table 1). Ubiquitin tags proteins for degradation (Li et al. 2002), and protein degradation by the ubiquitin-mediated proteasome is the major form of eukaryotic proteolysis. One of the functions of the ubiquitin proteasome system is the breakdown of proteins that have already been cleaved by caspases during apoptosis (Melino 2005). Therefore, genes that function in this system could be upregulated during massive programmed cell death in the cavefish lens.
CONCLUSIONS
Several conclusions can be drawn from the present study. First, cross-species microarray analysis using a zebrafish gene chip and Astyanax RNA can be used to discover differentially expressed genes during cavefish development. Second, based on microarray, in situ hybridization and immunological analysis, the expression of gamma-M crystallin and rhodopsin are strongly downregulated in the cavefish lens and photoreceptor layers of the retina, respectively. These results are consistent with apoptotic cell death of lens pre-fiber cells and the inhibition of photoreceptor cell differentiation in the cavefish retina. Third, the microarray results suggest that the vast majority of differentially expressed genes are downregulated in cavefish. This is in contrast to what has been described for the few differentially expressed genes identified by other means, such as in situ hybridization and quantitative PCR, which are upregulated in cavefish (Hooven et al. 2004; Yamamoto et al. 2004; Jeffery 2005). Fourth, a large proportion of the downregulated genes have roles in eye development and/or in programmed cell death. Finally, the present study has provided a large number of candidate genes that can be tested for possible roles in eye degeneration. Although many of these candidates may not be the mutated genes themselves, they could be part of the downstream pathways affected by these genes and, therefore, provide insights into their identity.
ACKNOWLEDGMENTS
We thank Deidre Heyser, Amy Parkhurst and Laura Reed for maintenance of the cavefish facility. This research was supported by grants from the National Insitute of Health (EY-014619) and the National Science Foundation (IBN-052384).
REFERENCES
- Alunni A, Menuet A, Candal E, Pénigault J-P, Jeffery WR, Rétaux S. Developmental mechanisms for retinal degeneration in the blind cavefish Astyanax mexicanus. Journal of Comparative Neurology. 2007;505:221–33. doi: 10.1002/cne.21488. [DOI] [PubMed] [Google Scholar]
- Behrens M, Wilkens H, Schmale H. Cloning of the αA-crystallin genes of the blind cave form and the epigean form of Astyanax fasciatus: a comparative analysis of structure, expression and evolutionary conservation. Gene. 1998;216:319–26. doi: 10.1016/s0378-1119(98)00346-1. [DOI] [PubMed] [Google Scholar]
- Belyaev IY. DNA loop organization and DNA fragmentation during radiation-induced apoptosis in human lymphocytes. Radiation Biology Radioecology. 2005;45:541–8. [PubMed] [Google Scholar]
- Chauhan BK, Reed NA, Zhang W, Duncan MK, Kilimann MW, Cveki A. Identification of genes downstream of Pax6 in the mouse lens using cDNA microarray. Journal of Biological Chemistry. 2002;277:11539–48. doi: 10.1074/jbc.M110531200. [DOI] [PubMed] [Google Scholar]
- Dahm R. Lens fibre cell differentiation – a link with apoptosis? Ophthalmology Research. 1999;31:163–83. doi: 10.1159/000055530. [DOI] [PubMed] [Google Scholar]
- Hooven TA, Yamamoto Y, Jeffery WR. Blind cavefish and heat shock protein chaperones: a novel role for hsp90α in lens apoptosis. International Journal of Developmental Biology. 2004;48:731–8. doi: 10.1387/ijdb.041874th. [DOI] [PubMed] [Google Scholar]
- Janssens S, Tinel A, Lippens S, Tschopp J. PIDD mediates NF-kappaB activation in response to DNA damage. Cell. 2005;123:1079–92. doi: 10.1016/j.cell.2005.09.036. [DOI] [PubMed] [Google Scholar]
- Jeffery WR. Adaptive evolution of eye degeneration in the Mexican blind cavefish. Journal of Heredity. 2005;96:185–96. doi: 10.1093/jhered/esi028. [DOI] [PubMed] [Google Scholar]
- Jeffery WR. Emerging systems in evo-devo: cavefish and mechanisms of microevolution. Evolution & Development. 2008;10:265–72. doi: 10.1111/j.1525-142X.2008.00235.x. [DOI] [PMC free article] [PubMed] [Google Scholar]
- Jeffery WR, Martasian DP. Evolution of eye degeneration in the cavefish Astyanax: apoptosis and the pax6 gene. The American Zoologist. 1998;38:685–96. [Google Scholar]
- Kayo T, Allison DB, Weindruch R, Prolla TA. Influences of aging and caloric restriction on the transcriptional profile of skeletal muscle from rhesus monkeys. Proceedings of the National Academy of Sciences of the United States of America. 2001;98:5093–8. doi: 10.1073/pnas.081061898. [DOI] [PMC free article] [PubMed] [Google Scholar]
- Kim J, Adam RM, Freeman MR. Trafficking of nuclear heparin-binding epidermal growth factor-like protein into an epidermal growth factor receptor-dependent autocrine loop in response to oxidative stress. Cancer Research. 2005;65:8242–9. doi: 10.1158/0008-5472.CAN-05-0942. [DOI] [PubMed] [Google Scholar]
- Langecker TG, Schamle H, Wilkens H. Transcription of the opsin gene in degenerate eyes of cave dwelling Astyanax fasciatus (Teleostei, Characidae) and its conspecific ancestor during early ontogeny. Cell & Tissue Research. 1993;273:183–92. [Google Scholar]
- Li C, Wong WH. Model based analysis of oligonucleotides arrays: model validation, design issues, and standard error application. Genome Biology. 2001a;2:0032.1–0032.11. doi: 10.1186/gb-2001-2-8-research0032. [DOI] [PMC free article] [PubMed] [Google Scholar]
- Li C, Wong WH. Model based analysis of oligonucleotides arrays: expression index computation and outlier detection. Proceedings of the National Academy of Sciences of the United States of America. 2001b;98:31–6. doi: 10.1073/pnas.011404098. [DOI] [PMC free article] [PubMed] [Google Scholar]
- Li M, Chen D, Shiloh A, Luo J, Nikolaev AY, Qin J, Gu W. Deubiquitination of p53 by HAUSP is an important pathway for p53 stabilization. Nature. 2002;416:648–53. doi: 10.1038/nature737. [DOI] [PubMed] [Google Scholar]
- Melino G. Discovery of the ubiquitin proteasome system and its involvement in apoptosis. Cell Death Differentiation. 2005;12:1155–7. doi: 10.1038/sj.cdd.4401740. [DOI] [PubMed] [Google Scholar]
- Michaut LF, Flister S, Neeb M, White KP, Certa U, Gehring WJ. Analysis of the eye developmental pathway in Drsosophila using DNA microarrays. Proceedings of the National Academy of Sciences of the United States of America. 2003;100:4024–9. doi: 10.1073/pnas.0630561100. [DOI] [PMC free article] [PubMed] [Google Scholar]
- Ogawa R, Streiff MB, Bugayenko A, Kato GJ. Inhibition of PDE4 phosphodiesterase activity induces growth suppression, apoptosis, glucocorticoid sensitivity, p53, and p21 (WAF1/CIP1) proteins in human acute lymphoblastic leukemia cells. Blood. 2002;99:3390–7. doi: 10.1182/blood.v99.9.3390. [DOI] [PubMed] [Google Scholar]
- Pati D, Zhang N, Plon SE. Linking sister chromatid cohesion and apoptosis: role of Rad21. Molecular and Cellular Biology. 2002;22:8267–77. doi: 10.1128/MCB.22.23.8267-8277.2002. [DOI] [PMC free article] [PubMed] [Google Scholar]
- Protas ME, Hersey C, Kochanek D, et al. Genetic analysis of cavefish reveals molecular convergence in the evolution of albinism. Nature Genetics. 2006;38:107–11. doi: 10.1038/ng1700. [DOI] [PubMed] [Google Scholar]
- Protas M, Conrad M, Gross JB, Tabin C, Borowsky R. Regressive evolution in the Mexican cave tetra, Astyanax mexicanus. Current Biology. 2007;17:462–4. doi: 10.1016/j.cub.2007.01.051. [DOI] [PMC free article] [PubMed] [Google Scholar]
- Ray PS, Martin JL, Swanson EA, Otani H, Dillmann WH, Das DK. Transgene overexpression of alphaB-crystallin confers simultaneous protection against cardiomyocyte apoptosis and necrosis during myocardial ischemia and reperfusion. Federation of American Societies for Experimental Biology Journal. 2001;15:393–402. doi: 10.1096/fj.00-0199com. [DOI] [PubMed] [Google Scholar]
- Saito T, Sawamoto K, Okano H, Anderson DJ, Mikoshiba K. Mammalian BarH homologue is a potential regulator of neural bHLH genes. Developmental Biology. 1998;199:216–25. doi: 10.1006/dbio.1998.8889. [DOI] [PubMed] [Google Scholar]
- Sass JB, Weinberg ES, Krone PH. Specific localization of zebrafish hsp90α mRNA to myo-D-expressing cells suggests a role for Hsp90α during normal muscle development. Mechanisms of Development. 1996;54:195–204. doi: 10.1016/0925-4773(95)00476-9. [DOI] [PubMed] [Google Scholar]
- Seiler C, Finger-Baier KC, Rinner O, et al. Duplicated genes with split functions: independent roles of protocadherin15 orthologues in zebrafish hearing and vision. Development. 2005;132:615–23. doi: 10.1242/dev.01591. [DOI] [PubMed] [Google Scholar]
- Shen YC, Raymond PA. Zebrafish cone-rod (crx) homeobox gene promotes retinogenesis. Developmental Biology. 2004;269:237–51. doi: 10.1016/j.ydbio.2004.01.037. [DOI] [PubMed] [Google Scholar]
- Soares D, Yamamoto Y, Strickler AG, Jeffery WR. The lens has a specific influence on optic nerve and tectum development in the blind cavefish Astyanax. Developmental Neuroscience. 2004;26:308–17. doi: 10.1159/000082272. [DOI] [PubMed] [Google Scholar]
- St Clair EG, Anderson SJ, Oltvai ZN. Bcl-2 counters apoptosis by Bax heterodimerization-dependent and -independent mechanisms in the T-cell lineage. Journal of Biological Chemistry. 1997;272:29347–55. doi: 10.1074/jbc.272.46.29347. [DOI] [PubMed] [Google Scholar]
- Stepanek L, Sun QL, Wang J, Wang C, Bixby JL. CRYP-2/cPTPRO is a neurite inhibitory repulsive guidance cue for retinal neurons in vitro. Journal of Cell Biology. 2001;154:867–78. doi: 10.1083/jcb.200105019. [DOI] [PMC free article] [PubMed] [Google Scholar]
- Straub JA, Lipscomb EA, Yoshida ES, Freeman RS. Induction of SM-20 in PC12 cells leads to in-creased cytochrome c levels, accumulation of cy tochrome c in the cytosol, and caspase-dependent cell death. Journal of Neurochemistry. 2003;85:318–28. doi: 10.1046/j.1471-4159.2003.01688.x. [DOI] [PubMed] [Google Scholar]
- Strickler AG, Yamamoto Y, Jeffery WR. The lens controls cell survival in the retina: evidence from the blind cavefish Astyanax. Developmental Biology. 2007a;311:512–23. doi: 10.1016/j.ydbio.2007.08.050. [DOI] [PMC free article] [PubMed] [Google Scholar]
- Strickler AG, Byerly MS, Jeffery WR. Lens gene expression analysis reveals downregulation of the anti-apoptotic chaperone αA-crystallin during cavefish eye degeneration. Development Genes & Evolution. 2007b;217:771–82. doi: 10.1007/s00427-007-0190-z. [DOI] [PubMed] [Google Scholar]
- Wesoly J, Agarwal S, Sigurdsson S, et al. Differential contributions of mammalian Rad54 paralogs to recombination, DNA damage repair, and meiosis. Molecular and Cellular Biology. 2006;26:976–89. doi: 10.1128/MCB.26.3.976-989.2006. [DOI] [PMC free article] [PubMed] [Google Scholar]
- Wride MA. Cellular and molecular features of lens differentiation: a review of recent advances. Differentiation. 1996;61:77–93. doi: 10.1046/j.1432-0436.1996.6120077.x. [DOI] [PubMed] [Google Scholar]
- Xian CJ, Zhou XF. Roles of transforming growth factor-alpha and related molecules in the nervous system. Molecular Neurobiology. 1999;20:157–83. doi: 10.1007/BF02742440. [DOI] [PubMed] [Google Scholar]
- Yamamoto Y, Jeffery WR. Central role for the lens in cavefish eye degeneration. Science. 2000;289:631–3. doi: 10.1126/science.289.5479.631. [DOI] [PubMed] [Google Scholar]
- Yamamoto Y, Stock DW, Jeffery WR. Hedgehog signaling controls eye degeneration in blind cavefish. Nature. 2004;431:844–7. doi: 10.1038/nature02864. [DOI] [PubMed] [Google Scholar]
- Yokoyama R, Knox BE, Yokoyama S. Rhodopsin from the fish, Astyanax: role of tyrosine 261 in the red shift. Investigative Ophthalmology & Visual Science. 1995;36:939–45. [PubMed] [Google Scholar]
- Zhang J, Li H, Wang J, Dong Z, Mian S, Yu FS. Role of EGFR transactivation in preventing apoptosis in Pseudomonas aeruginosa-infected human corneal epithelial cells. Investigative Ophthalmology & Visual Science. 2004;45:2569–76. doi: 10.1167/iovs.03-1323. [DOI] [PMC free article] [PubMed] [Google Scholar]
- Zopf D, Dineva B, Betz H, Gundelfinger ED. Isolation of the chicken middle-molecular weight neurofilament (NF-M) gene and characterization of its promoter. Nucleic Acids Research. 1990;18:521–9. doi: 10.1093/nar/18.3.521. [DOI] [PMC free article] [PubMed] [Google Scholar]