

Abstract
NPAS3 is a developmentally important transcription factor that has been associated with psychiatric illness. Our aim is to better define the regulation of NPAS3 mRNA (messenger RNA) levels during normal human prefrontal cortical development and in schizophrenia. Utilizing postmortem tissue from 134 human brains, we assessed: 60 normal brains ranging in age from birth to adulthood, 37 chronic individuals with schizophrenia, and 37 matched controls. mRNA and microRNA (miRNA) expressions were measured by microarray and quantitative real-time PCR. Protein expression was measured by Western blotting. During human postnatal cortical development (neonate to adult), we found decreased NPAS3 mRNA yet increased NPAS3 protein expression, suggesting the involvement of posttranscriptional regulation. Through screening, we identified one NPAS-targeted miRNA (miR-17) that changed in a pattern consistent with the developmental regulation of NPAS3. Using luciferase reporter assays, we assessed the impact of miR-17 on NPAS3 translation and demonstrated that miR-17 alters NPAS3 biosynthesis by binding to the NPAS3 3′untranslated region (UTR). In schizophrenia prefrontal cortex, we found significant elevations in miR-17 expression. While NPAS3 mRNA was unaltered, reduced NPAS3 protein expression was detected in a subpopulation of people with schizophrenia. The reciprocal expression of NPAS3 mRNA and protein during postnatal development mediated by a schizophrenia-associated change in miR-17 suggests that there is complex control over NPAS3 synthesis in the human prefrontal cortex and that if NPAS3 is dysregulated in schizophrenia, it is not evident by large changes in NPAS3 expression. Further studies into how changes in NPAS3 or its miRNA regulator may influence the development of schizophrenia are warranted.
Keywords: NPAS3, schizophrenia, development, miRNA, human, cortex, GABAergic, interneurons, DLPFC, postmortem
Introduction
Neuronal Per-Arnt-Sim (PAS) domain protein 3 (NPAS3), a brain-enriched transcription factor belonging to the basic helix-loop-helix (bHLH)-PAS domain family, was found to be associated with mental illness through a reciprocal balanced translocation between chromosomes 9 and 14 in a family with schizophrenia and mental retardation.1 The NPAS3 gene contains 11 exons encoding 3 functional domains: a DNA binding, a dimerization, and a transactivation domain.2,3 NPAS3 is located in a schizophrenia susceptibility locus (chr 14q13) previously identified by linkage4–6 and association studies, including a genome-wide association study, found multiple NPAS3 single nucleotide polymorphisms and mental illness risk haplotypes.7,8 The translocation found in schizophrenia was predicted to generate a truncated NPAS3 protein retaining DNA binding activity but lacking the dimerization and transactivation domains, suggesting a loss-of-function model as one mechanism by which genetic variation in NPAS3 increases risk for mental illness.
In support of the loss of NPAS3 function in schizophrenia, mouse knockout models for NPAS3 and related protein NPAS1 phenocopy some aspects of schizophrenia: hyperlocomotion, memory problems, reduced prepulse inhibition, reduced corpus callosum and hippocampal volume, and enlarged ventricles.9–11 On the cellular level, mice possessing the NPAS3−/− genotype showed substantial reductions in the glycoprotein reelin in cortical gamma aminobutyric acid (GABA)ergic interneurons throughout the central nervous system.11 Reductions in cortical reelin mRNA (messenger RNA) and protein have been found in people with schizophrenia.12,13 In adult mice, NPAS3 protein is colocalized with GAD67/reelin positive neurons,11 the cortical neurons that exhibit the most consistent pathology in schizophrenia.12–15
To better define the role of NPAS3 in schizophrenia, a neurodevelopmental disease, it is important to determine how NPAS3 expression may change during normal human cortical development. From work in the mouse, we expected cortical NPAS3 mRNA to be detected early in postnatal life,16 and subsequent expression decreases coordinate with the late maturation of cortical inhibitory interneurons in humans.14 Indeed, we found brain NPAS3 transcript levels were high at birth and declined to steady-state adult levels by the second decade of life. Strikingly, NPAS3 protein showed a reverse relationship with age—increasing during cortical development. In schizophrenia, we expected a loss-of-function of NPAS3 and detected a significant reduction of NPAS3 protein in female cases, although no change in NPAS3 mRNA or protein was observed in the total cohort. We hypothesized that these discrepancies between NPAS3 transcript and protein levels may be due to posttranscriptional regulation. Consistent with this hypothesis, we identified a schizophrenia-associated microRNA (miRNA), miR-17, with the capacity and cortical trajectory to target the NPAS3 transcript during development. Our findings indicate that NPAS3 protein levels may be regulated by miRNA silencing during cortical development and that increased expression of miR-17 may play a role in disrupting the developmental regulation of NPAS3 in schizophrenia.
Methods
Cohorts
Dissection of the dorsolateral prefrontal cortex (DLPFC) from developmental cases (microarray [45], quantitative real-time PCR [qPCR] [69], protein [60]) of normal controls ranging from 71 days to 49 years in age was conducted from tissue collected by the University of Maryland Brain and Tissue Bank for Developmental Disorders (UMBB; NICHHD contract# NO1-HD8-3283).17 Demographic data are listed in table 1. Cohort cases were matched for postmortem interval (PMI) and brain pH. Cases were matched to ensure that subtle changes in gene expression can be reliably detected. Cases within each age group did not differ according to PMI, brain pH, or RNA integrity number (RIN) (all P > .1).
Table 1.
Developmental Cohort Demographics
| Group | Age Range (y) | Average Age (y) | Gender | PMI (h) | pH | RIN Values |
| Microarray | ||||||
| Neonate | 0.11–0.24 | 0.17 ± 0.02 | 5M/2F | 22.7 ± 2.40 | 6.60 ± 0.05 | 8.96 ± 0.12 |
| Infant | 0.25–0.91 | 0.46 ± 0.07 | 6M/2F | 17.63 ± 2.72 | 6.69 ± 0.05 | 8.6 ± 0.23 |
| Toddler | 1.58–4.86 | 3.07 ± 0.55 | 3M/3F | 25.67 ± 3.90 | 6.74 ± 0.07 | 8.18 ± 0.23 |
| School age | 5.39–12.98 | 9.72 ± 1.24 | 3M/3F | 14.67 ± 2.22 | 6.73 ± 0.06 | 8.65 ± 0.16 |
| Teenage | 15–17.82 | 16.92 ± 0.42 | 5M/1F | 16.83 ± 1.92 | 6.79 ± 0.02 | 7.97 ± 0.43 |
| Young adult | 20.14–25.38 | 23.15 ± 0.80 | 4M/2F | 12.0 ± 2.20 | 6.75 ± 0.08 | 9.03 ± 0.14 |
| Adult | 35.99–49.22 | 41.90 ± 2.09 | 4M/2F | 13.83 ± 2.18 | 6.68 ± 0.09 | 8.38 ± 0.13 |
| qPCR | ||||||
| Neonate | 0.11–0.24 | 0.18 ± 0.01 | 7M/4F | 22.11 ± 1.88 | 6.56 ± 0.05 | 7.01 ± 0.27 |
| Infant | 0.25–0.91 | 0.53 ± 0.06 | 9M/5F | 17.46 ± 1.76 | 6.61 ± 0.05 | 7.19 ± 0.19 |
| Toddler | 1.58–4.86 | 2.79 ± 0.39 | 5M/5F | 22 ± 3.21 | 6.74 ± 0.06 | 6.83 ± 0.22 |
| School age | 5.39–12.97 | 9.40 ± 0.93 | 5M/4F | 14.75 ± 1.72 | 6.7 ± 0.06 | 6.98 ± 0.23 |
| Teenage | 15–17.69 | 16.80 ± 0.35 | 6M/2F | 17.86 ± 1.47 | 6.74 ± 0.03 | 6.60 ± 0.28 |
| Young adult | 20.14–25.38 | 23.17 ± 0.58 | 6M/3F | 13.67 ± 2.75 | 6.67 ± 0.08 | 6.73 ± 0.22 |
| Adult | 35.99–49.22 | 43.44 ± 1.84 | 5M/3F | 13.38 ± 1.63 | 6.60 ± 0.10 | 6.53 ± 0.27 |
| Protein | ||||||
| Neonate | 0.15–0.21 | 0.18 ± 0.01 | 5M/2F | 20.57 ± 2.10 | 6.49 ± 0.09 | |
| Infant | 0.25–0.91 | 0.54 ± 0.06 | 7M/6F | 16.54 ± 1.81 | 6.58 ± 0.06 | |
| Toddler | 1.58–4.86 | 2.87 ± 0.43 | 5M/3F | 19.63 ± 1.68 | 6.68 ± 0.09 | |
| School age | 5.39–12.97 | 9.12 ± 0.87 | 5M/4F | 15.11 ± 1.56 | 6.63 ± 0.09 | |
| Teenage | 15–17.82 | 16.93 ± 0.33 | 6M/2F | 17.13 ± 1.47 | 6.75 ± 0.03 | |
| Young adult | 20.14–25.38 | 23.11 ± 0.66 | 6M/2F | 13.63 ± 3.12 | 6.69 ± 0.09 | |
| Adult | 35.99–49.22 | 42.69 ± 1.93 | 5M/2F | 13.57 ± 1.86 | 6.67 ± 0.08 | |
Note: PMI, postmortem interval; RIN, RNA integrity number; qPCR, quantitative real-time PCR.
The schizophrenia cohort from the New South Wales Tissue Resource Centre (Sydney, Australia) (table 2 and see online supplementary material for table S1) consisted of 37 nonpsychiatric substance abuse-free controls and 37 chronic individuals (Diagnostic and Statistical Manual of Mental Disorders, Fourth Edition, [DSM-IV] schizophrenia [30]/schizoaffective disorder [7]). Brain collection, clinical chart review, agonal state determination, and tissue preparation have been carried out as described.17 Cases were excluded from the adult cohort if they were >78 years of age, if brain pH was <5.7, and if the PMI was >60 hours. Schizophrenic cases were matched to healthy controls for demographic variables in the following hierarchy: (1) age at death (<10 y), (2) brain pH (<0.59 pH units), and (3) PMI (<22 h). Diagnostic groups did not differ according to these variables (all P > .20). Detailed demographics of the cohort are published.17
Table 2.
TRC Cohort Demographics
| Control | Schizophrenia | |
| Age (y) | 51 ± 2.40 | 51.3 ± 2.32 |
| Gender | 30M/7F | 24M/13F |
| Hemisphere | 14L/23R | 20L/17R |
| Race | Caucasian (36)/Asian (1) | Caucasian (36)/Asian (1) |
| pH | 6.66 ± 0.05 | 6.61 ± 0.05 |
| PMI | 24.8 ± 1.80 | 28.8 ± 2.31 |
| RIN | 7.30 ± 0.09 | 7.27 ± 0.10 |
| Age of onset (y) | — | 23.7 ± 0.10 |
| DOI (y) | — | 27.7 ± 2.28 |
| Daily (Mean) CPZ (mg) | — | 691.64 ± 82.56 |
| Lifetime CPZ (mg) (y) | — | 20908.39 ± 3681.36 |
| Last CPZ Dose (mg) (d) | — | 483.76 ± 66.20 |
| Manner of death | Natural (37) | Natural (29)/Suicide (8) |
Note: Demographics are presented as mean values ± SEM. M, male; F, female; L, left; R, right; DOI, duration of illness; CPZ, chlorpromazine; PMI, postmortem interval; TRC, tissue resource centre.
Microarrays
Gene Expression.
The microarray protocol has been published.18,19 Gene expression profiling was carried out using HG-U133 version 2.0+ (GeneChips, Affymetrix). Affymetrix Microarray Suite (MAS 5.0) was used for image processing and data acquisition. The Bioconductor package was used to compute normalized expression values from the Affymetrix.cel files.
miRNA Expression
MiRNA expression profiling using the commercial array platform developed by Illumina Inc. was conducted. Data were normalized to the geometric mean of U24 and U49 small nucleolar RNA expression (gene expression stability confirmed by geNorm).20 Differential expression was identified using Significance Analysis of Microarrays as previously described.21
RNA Extraction and cDNA Synthesis
Total RNA was extracted from ∼300 mg of frozen tissue using TRIZOL Reagent (Invitrogen) and assayed for quality (RIN) as described.22 Three aliquots of 3 μg RNA were reverse transcribed to synthesize cDNA by random hexamer priming using the SuperScript First-Strand Synthesis System (Invitrogen) according to the manufacturer’s protocol, pooled, and diluted for qPCR.
Quantitative Real-Time PCR
NPAS3 mRNA levels were measured by Taqman qPCR using an ABI Prism 7900HT Fast Real-Time PCR System (384-well format) as previously described.19 The housekeeping genes (n = 4) used to calculate the geometric means used for normalization were as described.17,19 NPAS3 mRNA (Cat#hs00223201_m1; Applied Biosystems) was measured using 90 ng (due to low NPAS3 expression) of cDNA/sample in triplicate with an 8-point standard curve (serial dilutions of pooled cDNA from all cases) under standard cycling conditions.19 Several no template controls were included, producing no signal. PCR data was obtained with the Sequence Detector Software (SDS version 2.0, Applied Biosystems) using real-time fluorescence intensity. The threshold was set within the linear phase of the amplifications. The housekeeping genes or geometric means did not vary significantly between the groups.
Riboprobe Synthesis and In Situ Hybridization
For construction of plasmids for riboprobe synthesis, NPAS3 was amplified from cDNA using the following primers:
NPAS3 Forward: 5′- GATACAGTCCAGTGCCACCA -3′;
NPAS3 Reverse: 5′- CGTGAGTGACTCGCAGTTCT -3′.
A 508 bp PCR product corresponding to exons 10–12 of NPAS3 mRNA (accession#NM_001164749) was generated. Clones were constructed by ligating PCR products into pCR2.1-TOPO (Invitrogen) according to the manufacturer’s instructions and were verified by sequencing. In situ hybridization of NPAS3 mRNA was performed as previously described18,23 using 14 μm fresh frozen DLPFC. Hybridized sections were exposed to autoradiographic film (BioMax film, Kodak) for 42 days. Images were scanned at 1200 dpi using a CanoScan N676U.
Western Blotting
Protein extraction and Western blotting were conducted as previously described.18 The same amount of protein (40 μg) per sample was analyzed by sodium dodecyl sulfate polyacrylamide gel electrophoresis on 4%–12% Bis-Tris gradient gels (BioRad). NPAS3 antibody was purchased from Abcam (diluted 1:100, incubated for three days at 4°C; Cat#ab59190). β-actin (Chemicon International; Cat#MAB1501) was probed as a protein loading control. Bands were visualized using autoradiographic film and quantified by densitometry using Quantity One 1-D Analysis Software v4.6.5 (BioRad).
Cell Culture
All cell lines were obtained from the American Type Culture Collection and grown at 37°C in a 5% CO2 atmosphere. HEK293 cells were cultured in Dulbecco’s modified Eagle’s medium supplemented with 10% (vol/vol) FBS, 2 mM L-glutamine, 20 mM HEPES, and 0.15% sodium bicarbonate (Gibco-BRL). SHSY5Y cells were cultured in Roswell Park Memorial Institute medium (RPMI) containing 10% (vol/vol) FBS, and glutamax (2 mM) (Gibco-BRL). For experiments, SHSY5Y cells were differentiated by addition of all-trans retinoic acid (10 μM) to the culture medium and incubated for 9 days.
Luciferase Plasmid Constructs
The plasmid pGL3-SV40-NPAS3-3′ untranslated region (UTR) was constructed by amplifying the entire 648 bp 3′UTR of the human NPAS3 transcript (accession#NM_001164749) from SHSY5Y cDNA using KOD Hot Start DNA Polymerase (Novagen). Primers were NPAS3F1: AAGGAGGACTGAGGCGCC; NPAS3F2: TCTAGAAAGGAGGACTGAG (contains an XbaI restriction site); and NPAS3R: TTTTTTTTTTTTAAACATTCTAGTC. PCR products were separated by agarose gel electrophoresis and the NPAS3 3′UTR band was excised, purified, and ligated into pCR2.1-TOPO (Invitrogen). Positive clones were screened and verified by sequencing. Clones containing the NPAS3 3′UTR insert were then digested with XbaI and ligated into pGL3-SV40. The miRNA binding sequence containing the putative miR-17 binding site was cloned into pMIR-REPORT (Ambion) as previously described.24 A mutant construct was also created, which contained a 3 base-pair substitution within the miRNA seed-pairing region. Positive clones were screened and verified by sequencing.
Luciferase Reporter Assay
Cells were seeded (day 1) in 48-well plates (2 × 10⁵ cells/well for HEK293 and SHSY5Y). For SHSY5Y, cells were differentiated 9 days prior. On day 2, cells were cotransfected with pGL3-SV40-NPAS3-3′UTR (125 ng/well) and miRNAs/anti-miRs (miR-17, scrambled miRNA control, anti-miR-17, anti-miR control) for 24 hours using Lipofectamine 2000 (0.5 μl/well) or Lipofectamine 2000 combined with magnetofection (0.2 μl/well; 20 min on magnet) (Chemicell) for SHSY5Y. For HEK293 cells, pMIR-REPORT-NPAS3 (wild-type or mutant constructs) and miRNAs/anti-miRs were cotransfected using Lipofectamine 2000. The pRL-TK Renilla internal control plasmid (Promega) (12.5 ng/well) was cotransfected for normalization of the firefly luciferase signal and to control for transfection efficiency. On day 3, cells were harvested and luciferase assays were performed using the Dual Luciferase Assay Reporter System (Promega) according to the manufacturer's instructions in a FluorStar OPTIMA (BMG). Results (normalized to the Renilla control) were expressed as relative fold-change in luciferase activity relative to the empty vector vehicle-treated control conditions. All assays were conducted with no less than 3 independent experiments and with replicate cultures.
Statistical Analysis
Statistical analyses were conducted using Statistica 7.1 (StatSoft Inc., 2006 STATISTICA for Windows). Tests for normality and homogeneity of variance were conducted. Two-tailed or one-tailed unpaired Student’s t tests were used to assess changes in luciferase reporter expression. One-way ANOVA was used to assess changes in the developmental cohort. Pearson-Product Moment correlations were run to compare cohort characteristics and normalized NPAS3 mRNA expression. Where a relationship existed in the whole group, ANCOVA was calculated. Two-way ANOVA/ANCOVAs were used to assess the diagnostic effects, gender, and/or gender × diagnosis interactions on NPAS3 expression in the 2 cohorts. ANOVAs/ANCOVAs with P < .05 significance were followed-up by Fisher least significant difference post hoc analysis to assess group differences. QPCR measurement outliers were excluded based on established criteria17 using the triplicates obtained from the qPCR raw data (Developmental cohort: NPAS3: none removed; Schizophrenia cohort: NPAS3: none removed). For all assays, population outliers were excluded from subsequent analyses if cases were greater than 2 SDs from the mean for the group of interest (Developmental cohort: NPAS3: 1–2 cases per group; Schizophrenia cohort: NPAS3: 2 controls and 2 schizophrenics removed; miR-17: 1 control and 2 schizophrenics removed).
Results
NPAS3 mRNA During Postnatal Human Prefrontal Cortex Development
Microarray analysis of neonates, infants, toddlers, school-age children, teenagers, young adults, and adults revealed an age-dependent decline in NPAS3 mRNA expression during the first decade of life (one-way ANOVA P = .0003; regression r = .53, P = .0002) in both males and females (figure 1A). By qPCR, we confirmed that NPAS3 mRNA levels were highest in the neonatal period and decreased significantly during infancy (ANCOVA: F = 5.80, df = 6, 59, P < .00001) (P = .02) and toddlerhood (P = .0004) to maximal reduction at school age (P = .000004) (figure 1B). NPAS3 mRNA expression remained constant into adulthood (adolescent, young adult, and adult compared with school age: all P > .36). We found that NPAS3 mRNA levels correlated with pH (r = −.38, P = .003).
Fig. 1.

NPAS3 mRNA (messenger RNA) expression in the dorsolateral prefrontal cortex across development. NPAS3 mRNA expression in the 7 developmental groups were measured by (A) microarray analysis (neonates [black; 0.11-0.24 years], infants [green; 0.25-0.91 years], toddlers [red; 1.58-4.86 years], school age [blue; 5.39-12.98 years], teenage [aqua; 15-17.82 years], young adults [yellow; 20.14-25.38 years], and adults [pink; 35.99-49.22 years]; female [triangle], male [circle]) and (B) quantitative real-time PCR. Data are expressed as NPAS3 mRNA normalized to the geometric mean of the housekeeping genes and presented as mean + SEM. *P < .05, ***P < .0005. (C) Autoradiographic film images for NPAS3 mRNA after in situ hybridization. Expression of NPAS3 is shown from representative cases as indicated. NPAS3 mRNA is expressed mainly in layers II and VI as indicated by the black arrows and decreased over development. NPAS3 mRNA expression appears to increase in the white matter with increasing age. N = neonate, I = infant, Tod = toddler, SA = school age, + = sense strand. Triangle = females, circle = males.
By in situ hybridization, we detected NPAS3 mRNA throughout development in all cortical layers, with robust NPAS3 mRNA hybridization signal in cortical layers II and IV early in life (figure 1C). Qualitatively, NPAS3 mRNA expression appeared highest in neonates and declined in the infants and further in toddlers with low level of expression evident in school age children consistent with microarray and qPCR results.
NPAS3 Protein Changes During Postnatal Human Prefrontal Cortex Development
By Western blot analysis (figure 2), we detected an unexpected increase in NPAS3 protein expression during the first decade of life (F = 2.95, df = 6, 53, P = .02) where expression was lowest in neonates and increased significantly in toddlers (P = .005) to reach maximum expression during school age (P = .0006). Thereafter, NPAS3 protein levels decreased significantly (school age compared to young adults: P = .03) and then remained constant into adulthood. NPAS3 protein levels were not correlated with the cohort characteristics that may influence postmortem protein expression (pH: r = −.102, P = .40; PMI: r = .087, P = .48).
Fig. 2.

NPAS3 protein expression in the dorsolateral prefrontal cortex across development. (A) Representative Western blots of the developmental cohort probed with an antibody to the NPAS3 protein (Abcam; Cat#ab59190), which can detect the predicted 100 kDa protein as well as a developmental age-specific protein migrating at 90 kDa. This 90 kDa NPAS3 immunoreactive protein was only observed in infant and toddler cases. β-actin was probed as a loading control and an internal control was used for normalization between Western blots. IC = internal control, N = neonate, I = infant, Tod = toddler, SA = school age, Teen = teenage, YA = young adult, A = adult. (B) The 100-kDa NPAS3 protein and β-actin were quantified by densitometry. NPAS3 expression was normalized to β-actin and presented as mean + SEM. *P < .05, **P < .01, ***P < .005. † 90 kDa NPAS3 immunoreactive protein band.
MiRNA Changes During Postnatal Human Prefrontal Cortex Development
We predicted that the discrepancy between NPAS3 mRNA and protein levels in the first decade of life might be due to differences in posttranscriptional regulation via miRNA that would decrease over the same time course as the primary NPAS3 transcript. Using the miRNA target prediction algorithms Pictar (http://pictar.mdc-berlin.de/) and TargetScan (http://www.targetscan.org/), we conducted a screen for miRNAs that could target the NPAS3 gene and found 39 potential miRNA candidates (see online supplementary material for table S2). Within this group, microarray analysis of miRNAs (data not shown) identified 24 miRNAs that changed significantly across postnatal brain development, but only miR-17 displayed an inverse expression pattern consistent with the developmental regulation of NPAS3 protein.
ANCOVA analysis of miR-17 expression covarying for both pH and RIN (pH: r = −.51, P = .00004; RIN: r = −.27, P = .04) showed that the expression pattern of miR-17 paralleled the developmental decrease in NPAS3 mRNA levels (F = 2.95, df = 6, 50, P = .02) (figure 3A). MiR-17 expression was highest in neonates but then decreased in an age-dependent manner in the infants to reach a plateau in the toddlers where expression levels were maintained into adulthood (neonate, toddlers P < .0002; infant, toddlers P = .01; neonate, adults P = .001). These findings suggest that miR-17 may directly regulate NPAS3 expression and we suggest this could lead to an increase in NPAS3 mRNA turnover and decreased NPAS3 protein synthesis.
Fig. 3.

miR-17 expression in the dorsolateral prefrontal cortex across development. (A) MiR-17 expression was measured by gene microarray for the 7 developmental groups. Data is expressed as miR-17 expression normalized to the geometric mean of small nucleolar RNAs and is presented as mean + SEM. *P < .05, **P < .005, ***P < .0005. (B) Identification of a putative miR-17 binding sequence in the NPAS3 3′UTR. The binding site was identified using PicTar and confirmed using TargetScan. The NPAS3 3′UTR is shaded gray and boxed and includes the sequences between the gray. The putative miR-17 binding site is highlighted blue with dotted underline and the seed region within the binding site is indicated in yellow with solid underline. Sequences flanking the putative miR-17 binding site are highlighted green (no underline or boxing). (C) SHSY5Y cells were transfected with empty vector (luciferase construct) or a luciferase construct containing the NPAS3 3′UTR in combination with miR-17, anti-miR-17, or scrambled controls. Data representative of n = 3 independent experiments from three replicate cultures. **P = .01. (D) A mutant version of the NPAS3 microRNA (miRNA) binding sequence that has base changes (indicated by highlighted [red and bold] bases) introduced to the miRNA seed-pairing region. (E) HEK293 cells were cotransfected with empty vector, wild-type, or mutated miRNA binding sequence in combination with miR-17, anti-miR-17, or scrambled controls. Data representative of n = 4 independent experiments from four replicate cultures are normalized to the respective empty vector controls and expressed as relative luciferase activity. ***P < .001. This figure can be seen in color at Schizophrenia Bulletin online.
miR-17 Regulation of NPAS3 mRNA
From the target prediction algorithms, we identified a putative miR-17 binding site in the NPAS3 3′UTR and determined whether miR-17 can target the 3′UTR of the NPAS3 transcript (figure 3B). We cotransfected SHSY5Y cells with miR-17 and either a luciferase reporter construct containing the NPAS3 3′UTR or an empty vector (luciferase reporter construct without the NPAS3 3′UTR). We observed a significant decrease in luciferase reporter activity from SHSY5Y cells transfected with miR-17 and constructs containing the NPAS3 3′UTR compared with cells transfected with miR-17 and the empty vector (t = −4.24, df = 4, P = .01) (figure 3C). In contrast, cotransfection of SHSY5Y cells with the NPAS3 3′UTR and anti-miR-17 significantly enhanced luciferase reporter activity compared with cells cotransfected with the empty vector and anti-miR-17 (t = 4.20, df = 4, P = .01).
We then focused more specifically on the putative miR-17 binding site in the NPAS3 3′UTR by cloning the miR-17 binding sequence into a luciferase reporter construct (figure 3D). A mutant form of this sequence (containing a 3 base-pair mutation in the miRNA seed sequence) was also cloned to determine the specificity of miR-17 binding to the putative binding sequence (figure 3D). Consistent with observations using the endogenous NPAS3 3′UTR in neuronal cells, we showed that miR-17 decreases luciferase reporter activity in cells transfected with constructs containing the wild-type miR-17 binding sequence in the luciferase 3′UTR (t = −8.04, df = 6, P = .0002) (figure 3E). Moreover, expression of anti-miR-17 showed the opposite effect by increasing luciferase reporter activity (t = 6.48, df = 6, P = .0006). Finally, miR-17 and anti-miR-17 did not alter luciferase reporter activity of the miRNA mutant constructs (all P > .36).
miR-17 mRNA Expression and NPAS3 mRNA and Protein Expression in the DLPFC of People With Schizophrenia
Using microarray analysis and qPCR, we did not detect a significant difference in NPAS3 mRNA in schizophrenia. Moreover, we did not find a significant main effect of gender or a diagnosis × gender interaction on NPAS3 mRNA expression between controls and schizophrenics. Two-way ANCOVA analyses were conducted (all F < 1.08, df = 1, 60, P > .30) covarying for demographic cohort characteristics (figure 4A) including age (r = .28, P = .02), pH (r = −.61, P < .000001), PMI (r = −.32, P = .006), RIN (r = −.42, P = .0003), brain weight (r = −.40, P = .0006), and agonal state (r = .24, P = .048).
Fig. 4.
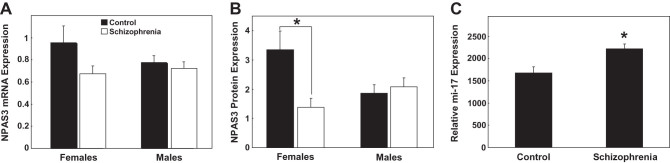
NPAS3 mRNA (messenger RNA) and protein expression in the dorsolateral prefrontal cortex of people with schizophrenia. (A) NPAS3 mRNA expression was measured by quantitative real-time PCR (qPCR) and (B) NPAS3 protein expression was measured by Western blotting. For NPAS3 mRNA and protein, expression was grouped based on gender (females and males) and diagnosis (control [black] and schizophrenia [white]). NPAS3 mRNA expression was normalized to the geometric mean of the housekeeping genes and presented as mean + SEM. NPAS3 protein expression was normalized to β-actin and presented as mean + SEM. *P < .05. (C) miR-17 expression was measured by qPCR. Expression was grouped based on diagnosis. Data is expressed as miR-17 normalized to the geometric mean of small nucleolar RNAs and presented as mean + SEM. *P < .05.
We did not detect a significant main effect of diagnosis or gender on NPAS3 protein levels. Interestingly, a diagnosis ×gender interaction effect was observed for NPAS3 protein levels (F = 4.75, df = 1, 68, P = .03) (figure 4B). Females with schizophrenia showed a significant decrease in NPAS3 protein compared with control females (P = .03), whereas males showed no diagnostic change in NPAS3 protein expression (P = .58). NPAS3 protein did not correlate significantly with any of the cohort demographics (all P > .07).
Interestingly, NPAS3 expression was found to correlate significantly with the estimated last chlorpromazine-equivalent dose (NPAS3 mRNA [r = −.45, P = .006]; NPAS3 protein expression [r = .38, P = .02]). However, this clinical variable was not used in covariate analyses because it is applicable only to the schizophrenia group.
Despite the subtle and possibly gender-specific change in NPAS3 in schizophrenia, we detected a significant increase in miR-17 mRNA expression in our total cohort of individuals with schizophrenia compared with controls (F = 6.18, df = 1, 67, P = .02) (figure 4C). No significant main effects of gender or diagnosis × gender interaction were observed between controls and schizophrenics (all F < 0.04, df = 1, 67, P > .85) and no tested cohort demographics did correlated with miR-17 expression (all P ≥ .25). Moreover, no significant correlations were observed between miR-17 expression and clinical variables (all P ≥ .11). Since we found that miR-17 was increased in the prefrontal cortex of people with schizophrenia, we asked if other miR-17 mRNA targets would be reduced in adults with schizophrenia. By examining the publically available microarray data from the SMRI Website (https://www.stanleygenomics.org/index.html), we identified 18 putative miR-17 targets that were reduced in the brains of people with schizophrenia (see online supplementary material for table S3).
Discussion
To advance understanding of the putative role of NPAS3 in schizophrenia, we examined NPAS3 expression in the developing and schizophrenic brain.
NPAS3 mRNA and Protein Are Reciprocally Expressed During Development
We found a postnatal downregulation of NPAS3 mRNA and a postnatal upregulation of NPAS3 protein in the prefrontal cortex that occurred over a protracted 5-year period: from neonates to early adolescence. These reciprocal patterns of expression suggest the lack of a direct relationship between NPAS3 mRNA and NPAS3 protein levels in the developing human postnatal DLPFC and demonstrate that NPAS3 protein levels are not simply determined by the steady-state mRNA levels of the primary NPAS3 transcript. Posttranscriptional regulation of mRNA can be mediated by miRNAs and we confirmed, for the first time, that NPAS3 mRNA is a target of miRNA-mediated gene silencing.
A miRNA Is Capable of Regulating Human NPAS3 Levels
We identified a miR-17 binding site in the NPAS3 3′UTR and showed regulation of NPAS3 expression via miR-17 in vitro, indicating that miR-17 may regulate NPAS3 in human brain. The developmental profile of miR-17 was reciprocal to NPAS3 protein expression but mirrored the expression pattern observed for NPAS3 mRNA in the human DLPFC, suggesting that miR-17 is inhibiting translation of the NPAS3 transcript in vivo. This model is strongly supported by our experimental data demonstrating that miR-17 downregulates protein synthesis by targeting specific sites on the 3′UTR of NPAS3. Steady-state levels of NPAS3 transcription may be unchanged or elevated with respect to protein level in the developing cortex, due to the influence of homeostatic feedback attempting to support levels in the face of miRNA-induced restraint on translation. Since the reciprocal regulation of NPAS3 mRNA and protein we detect occurs early in human life, the extent to which this mechanism is used in the adult human brain is unknown. Our data from people with schizophrenia suggest that NPAS3 may not be a primary target for miR-17 in the adult cortex. However, other genes that have been found to be reduced in the DLPFC in people with schizophrenia by previous microarray studies are miR-17 targets, consistent with the upregulation of miR-17 that we find in schizophrenia having widespread consequences on gene expression in adult human cortex.
NPAS3 Expression in Schizophrenia
The most robust change detected in the DLPFC of people with schizophrenia was a novel increase in miR-17, which would be consistent with increased degradation and turnover or translational suppression of target mRNAs including NPAS3 mRNA. However, we did not detect a significant change in NPAS3 mRNA in this schizophrenia cohort. It is important to note that our current cohort is composed of individuals in the young adult and adult age range. While we observed no overall change in NPAS3 mRNA in adults with schizophrenia, we do not know if NPAS3 expression is altered early in development in schizophrenia. Based on the developmental expression profile of NPAS3, the most robust changes took place between the neonate to school age period, yet if changes in NPAS3 mRNA were occurring early in development in people with schizophrenia, this would have been missed in our study. If NPAS3 synthesis and/or function were altered this early in the development, it could potentially lead to lasting changes in interneurons (or a subset of interneurons) without leading to lasting changes in NPAS3 levels in all people with schizophrenia. Our finding of decreased NPAS3 protein in females with schizophrenia may suggest that changes in NPAS3 expression may be found in subgroups of patients and is consistent with reduced translational ability of evidently stable levels of NPAS3 mRNA.
How Does NPAS3 Contribute to Understanding the Pathophysiology of Schizophrenia?
Despite only detecting decreased NPAS3 expression in a subset of schizophrenic individuals in our cohort, we know that NPAS3 knockout mice show reduced neurogenesis, abnormal brain pathology, GABAergic dysfunction, and altered metabolism—all features that are detected differentially in schizophrenia.25 It is intriguing to consider that loss of NPAS3 function may be one among many putative causative factors upstream of the cortical pathology in schizophrenia, as is supported by genetic studies. Indeed, given the clinical heterogeneity of schizophrenia, one would expect that there are various causes underlying the disease. Thus, the closer we examine any putative single risk factor (in this case, NPAS3), the more likely it is that we will find changes in only a subset of individuals, as others afflicted will have distinct risk factors at work. Critically, these risk factors should have the ability to converge onto a common pathophysiology found in the disease as is the case for the developmentally regulated NPAS3 gene. Alternatively, the fact that we currently are only able to study adults with schizophrenia may have obscured our ability to identify critical developmental changes in NPAS3 levels that may be more widespread earlier in the disease course. This is especially relevant for genes/proteins that show increased prominence early on in human life and underscores the importance of using animals in modeling how developmental risk factors may contribute to schizophrenia pathogenesis.
NPAS3 in Relationship to GABAergic Interneuron Markers in Development and Schizophrenia
NPAS3 is expressed by GABAergic interneurons, in particular, NPAS3 colocalizes with calretinin-expressing and reelin-producing interneuron subtypes,11 which we26 and others find decreased in schizophrenia,12 However, other studies using schizophrenia sample sizes of 5–15 brains have found no change in calretinin mRNA or cell density in the prefrontal cortex in schizophrenia.27–29 Calretinin mRNA expression is most abundant in layer II,27 and we found NPAS3 mRNA to be enriched in cortical layers II and IV. Furthermore, in the human DLPFC, calretinin mRNA levels are significantly elevated in the neonate and declined with increasing age, as seen with NPAS3 mRNA in our study.14 This reduction of NPAS3 mRNA levels coincident with a developmental downregulation of calretinin mRNA may indicate coregulation of NPAS3 and calretinin within these inhibitory interneurons. Indeed, since NPAS3 functions as a transcription factor, it is likely to be playing a direct role in the regulation of other genes within cortical interneurons. Interestingly, the profile of NPAS3 protein is distinct from NPAS3 mRNA but similar to the mRNA expression profiles of both calbindin and vasoactive intestinal peptide, suggesting a role for NPAS3 in these interneuron subtypes.14 Further study into the interneuron cell-type specific expression of NPAS3 may help to clarify the role of NPAS3 in interneuron pathology in schizophrenia. Additionally, colocalization of miR-17 and NPAS3 is needed to confirm that a direct regulatory mechanism between miR-17 and NPAS3 may be occurring in interneurons.
Summary
Our study is the first to detect developmental regulation of NPAS3 in the human cortex and to further support a role for NPAS3 in the pathophysiology of schizophrenia using evidence from the brains of people with schizophrenia. Furthermore, we demonstrate a novel regulatory mechanism by which NPAS3 mRNA and protein may be reciprocally regulated during postnatal development by miR-17, which targets the 3′UTR of the NPAS3 primary transcript to diminish gene product activity. In schizophrenia, we found significantly increased miR-17, gender-specific differences in NPAS3 protein, but no change in NPAS3 mRNA expression. Our study supports an NPAS3 hypofunction model of schizophrenia pathogenesis and suggests that further neurobiological work on NPAS3 is warranted to determine how it may be involved in the development of mental illness.
Funding
This work was supported by the Schizophrenia Research Institute utilizing infrastructure funding from New South Wales ( NSW ) Health, the Macquarie Group Foundation, Neuroscience Research Australia (formerly the Prince of Wales Medical Research Institute), and the University of New South Wales. J.W. is supported by the National Health and Medical Research Council Postdoctoral Training Fellowship (568884). C.D. is supported by a National Institutes of Health postdoctoral fellowship (F32 NS070491). N.B. is supported by the National Health and Medical Research Council Project Grant (631057). M.C. is supported by a National Alliance for Research on Schizophrenia and Depression Young Investigator Award, the Hunter Medical Research Institute, the Neurobehavioural Genetics Unit and NSW Department of Health project grant, and an M.C. Ainsworth Research Fellowship in Epigenetics.
Supplementary Material
Supplementary material is available at http://schizophreniabulletin.oxfordjournals.org.
Acknowledgments
We acknowledge the assistance of Dr H. Ronald Zielke and Robert Vigorito of the University of Maryland Brain and Tissue Bank for Developmental Disorders. We also acknowledge and thank Yang Yang from Peking University Institute of Mental Health (Beijing, China) for his assistance. Finally, we acknowledge Duncan Sinclair, Shan-Yuan Tsai, Alice Rothwell, Heng Giap Woon, and Debora Rothmond for technical assistance. Tissues were received from the Australian Brain Donor Programs New South Wales (NSW) Tissue Resource Centre, which is supported by The University of Sydney, National Health and Medical Research Council of Australia, Schizophrenia Research Institute, National Institute of Alcohol Abuse and Alcoholism, National Institutes of Health, and the NSW Department of Health. Conflicts of Interest: There are no conflicts of interest.
References
- 1.Kamnasaran D, Muir WJ, Ferguson-Smith MA, Cox DW. Disruption of the neuronal PAS3 gene in a family affected with schizophrenia. J Med Genet. 2003;40:325–332. doi: 10.1136/jmg.40.5.325. [DOI] [PMC free article] [PubMed] [Google Scholar]
- 2.Gilles-Gonzalez MA, Gonzalez G. Signal transduction by heme-containing PAS-domain proteins. J Appl Physiol. 2004;96:774–783. doi: 10.1152/japplphysiol.00941.2003. [DOI] [PubMed] [Google Scholar]
- 3.Gilles-Gonzalez MA, Gonzalez G. Heme-based sensors: defining characteristics, recent developments, and regulatory hypotheses. J Inorg Biochem. 2005;99:1–22. doi: 10.1016/j.jinorgbio.2004.11.006. [DOI] [PubMed] [Google Scholar]
- 4.DeLisi LE, Craddock NJ, Detera-Wadleigh S, et al. Update on chromosomal locations for psychiatric disorders: report of the interim meeting of chromosome workshop chairpersons from the VIIth World Congress of Psychiatric Genetics, Monterey, California, October 14-18, 1999. Am J Med Genet. 2000;96:434–449. doi: 10.1002/1096-8628(20000612)96:3<434::aid-ajmg40>3.0.co;2-c. [DOI] [PubMed] [Google Scholar]
- 5.Craddock N, Lendon C. Chromosome Workshop: chromosomes 11, 14, and 15. Am J Med Genet. 1999;88:244–254. [PubMed] [Google Scholar]
- 6.Chiu YF, McGrath JA, Thornquist MH, et al. Genetic heterogeneity in schizophrenia II: conditional analyses of affected schizophrenia sibling pairs provide evidence for an interaction between markers on chromosome 8p and 14q. Mol Psychiatry. 2002;7:658–664. doi: 10.1038/sj.mp.4001045. [DOI] [PubMed] [Google Scholar]
- 7.Pickard BS, Christoforou A, Thomson PA, et al. Interacting haplotypes at the NPAS3 locus alter risk of schizophrenia and bipolar disorder. Mol Psychiatry. 2009;14:874–884. doi: 10.1038/mp.2008.24. [DOI] [PubMed] [Google Scholar]
- 8.Huang J, Perlis RH, Lee PH, et al. Cross-Disorder Genomewide Analysis of Schizophrenia, Bipolar Disorder, and Depression. Am J Psychiatry. 2010;167:1254–1263. doi: 10.1176/appi.ajp.2010.09091335. [DOI] [PMC free article] [PubMed] [Google Scholar]
- 9.Brunskill EW, Ehrman LA, Williams MT, et al. Abnormal neurodevelopment, neurosignaling and behaviour in Npas3-deficient mice. Eur J Neurosci. 2005;22:1265–1276. doi: 10.1111/j.1460-9568.2005.04291.x. [DOI] [PubMed] [Google Scholar]
- 10.Pickard BS, Malloy MP, Porteous DJ, Blackwood DH, Muir WJ. Disruption of a brain transcription factor, NPAS3, is associated with schizophrenia and learning disability. Am J Med Genet B Neuropsychiatr Genet. 2005;136B:26–32. doi: 10.1002/ajmg.b.30204. [DOI] [PubMed] [Google Scholar]
- 11.Erbel-Sieler C, Dudley C, Zhou Y, et al. Behavioral and regulatory abnormalities in mice deficient in the NPAS1 and NPAS3 transcription factors. Proc Natl Acad Sci U S A. 2004;101:13648–13653. doi: 10.1073/pnas.0405310101. [DOI] [PMC free article] [PubMed] [Google Scholar]
- 12.Guidotti A, Auta J, Davis JM, et al. Decrease in reelin and glutamic acid decarboxylase67 (GAD67) expression in schizophrenia and bipolar disorder: a postmortem brain study. Arch Gen Psychiatry. 2000;57:1061–1069. doi: 10.1001/archpsyc.57.11.1061. [DOI] [PubMed] [Google Scholar]
- 13.Impagnatiello F, Guidotti AR, Pesold C, et al. A decrease of reelin expression as a putative vulnerability factor in schizophrenia. Proc Natl Acad Sci U S A. 1998;95:15718–15723. doi: 10.1073/pnas.95.26.15718. [DOI] [PMC free article] [PubMed] [Google Scholar]
- 14.Fung SJ, Webster MJ, Sivagnanasundaram S, Duncan C, Weickert CS. Expression of interneuron markers in the dorsolateral prefrontal cortex of the developing human and in schizophrenia. Am J Psychiatry. 2010;167:1479–1488. doi: 10.1176/appi.ajp.2010.09060784. [DOI] [PubMed] [Google Scholar]
- 15.Eastwood SL, Harrison PJ. Cellular basis of reduced cortical reelin expression in schizophrenia. Am J Psychiatry. 2006;163:540–542. doi: 10.1176/appi.ajp.163.3.540. [DOI] [PubMed] [Google Scholar]
- 16.Brunskill EW, Witte DP, Shreiner AB, Potter SS. Characterization of npas3, a novel basic helix-loop-helix PAS gene expressed in the developing mouse nervous system. Mech Dev. 1999;88:237–241. doi: 10.1016/s0925-4773(99)00182-3. [DOI] [PubMed] [Google Scholar]
- 17.Weickert CS, Sheedy D, Rothmond DA, et al. Selection of reference gene expression in a schizophrenia brain cohort. Aust N Z J Psychiatry. 2010;44:59–70. doi: 10.3109/00048670903393662. [DOI] [PMC free article] [PubMed] [Google Scholar]
- 18.Wong J, Webster MJ, Cassano H, Weickert CS. Changes in alternative brain-derived neurotrophic factor transcript expression in the developing human prefrontal cortex. Eur J Neurosci. 2009;29:1311–1322. doi: 10.1111/j.1460-9568.2009.06669.x. [DOI] [PubMed] [Google Scholar]
- 19.Duncan CE, Webster MJ, Rothmond DA, Bahn S, Elashoff M, Shannon Weickert C. Prefrontal GABA(A) receptor alpha-subunit expression in normal postnatal human development and schizophrenia. J Psychiatr Res. 2010;44:673–681. doi: 10.1016/j.jpsychires.2009.12.007. [DOI] [PubMed] [Google Scholar]
- 20.Vandesompele J, De Preter K, Pattyn F, et al. Accurate normalization of real-time quantitative RT-PCR data by geometric averaging of multiple internal control genes. Genome Biol. 2002;3 doi: 10.1186/gb-2002-3-7-research0034. RESEARCH0034. [DOI] [PMC free article] [PubMed] [Google Scholar]
- 21.Beveridge NJ, Gardiner E, Carroll AP, Tooney PA, Cairns MJ. Schizophrenia is associated with an increase in cortical microRNA biogenesis. Mol Psychiatry. 2010;15:1176–1189. doi: 10.1038/mp.2009.84. [DOI] [PMC free article] [PubMed] [Google Scholar]
- 22.Kozlovsky N, Shanon-Weickert C, Tomaskovic-Crook E, Kleinman JE, Belmaker RH, Agam G. Reduced GSK-3beta mRNA levels in postmortem dorsolateral prefrontal cortex of schizophrenic patients. J Neural Transm. 2004;111:1583–1592. doi: 10.1007/s00702-004-0166-3. [DOI] [PubMed] [Google Scholar]
- 23.Weickert CS, Hyde TM, Lipska BK, Herman MM, Weinberger DR, Kleinman JE. Reduced brain-derived neurotrophic factor in prefrontal cortex of patients with schizophrenia. Mol Psychiatry. 2003;8:592–610. doi: 10.1038/sj.mp.4001308. [DOI] [PubMed] [Google Scholar]
- 24.Beveridge NJ, Tooney PA, Carroll AP, Tran N, Cairns MJ. Down-regulation of miR-17 family expression in response to retinoic acid induced neuronal differentiation. Cell Signal. 2009;21:1837–1845. doi: 10.1016/j.cellsig.2009.07.019. [DOI] [PubMed] [Google Scholar]
- 25.Sha L, MacIntyre L, Machell JA, et al. Transcriptional regulation of neurodevelopmental and metabolic pathways by NPAS3. Mol Psychiatry. 2011 doi: 10.1038/mp.2011.73. Epub. [DOI] [PubMed] [Google Scholar]
- 26.Fung SJ, Webster MJ, Sivagnanasundaram S, Duncan C, Weickert CS. Expression of interneuron markers in the dorsolateral prefrontal cortex of the developing human and in schizophrenia. Am J Psychiatry. 2009;167:1479–1488. doi: 10.1176/appi.ajp.2010.09060784. [DOI] [PubMed] [Google Scholar]
- 27.Hashimoto T, Volk DW, Eggan SM, et al. Gene expression deficits in a subclass of GABA neurons in the prefrontal cortex of subjects with schizophrenia. J Neurosci. 2003;23:6315–6326. doi: 10.1523/JNEUROSCI.23-15-06315.2003. [DOI] [PMC free article] [PubMed] [Google Scholar]
- 28.Beasley CL, Zhang ZJ, Patten I, Reynolds GP. Selective deficits in prefrontal cortical GABAergic neurons in schizophrenia defined by the presence of calcium-binding proteins. Biol Psychiatry. 2002;52:708–715. doi: 10.1016/s0006-3223(02)01360-4. [DOI] [PubMed] [Google Scholar]
- 29.Daviss SR, Lewis DA. Local circuit neurons of the prefrontal cortex in schizophrenia: selective increase in the density of calbindin-immunoreactive neurons. Psychiatry Res. 1995;59:81–96. doi: 10.1016/0165-1781(95)02720-3. [DOI] [PubMed] [Google Scholar]
Associated Data
This section collects any data citations, data availability statements, or supplementary materials included in this article.