Abstract
Myofascial trigger points (MTrPs) are palpable, tender nodules in skeletal muscle that produce symptomatic referred pain when palpated. MTrPs are characteristic findings in myofascial pain syndrome (MPS). The role of MTrPs in the pathophysiology of MPS is unknown. Objective characterization and quantitative measurement of the properties of MTrPs can improve their localization and diagnosis, as well as lead to clinical outcome measures. MTrPs associated with soft tissue neck pain are often found in the upper trapezius muscle. We have previously demonstrated that MTrPs can be visualized using ultrasound imaging. The goal of this study was to evaluate whether texture-based image analysis can differentiate structural heterogeneity of symptomatic MTrPs and normal muscle.
Patients with chronic (>3 months) neck pain with spontaneously painful, palpable MTrPs (active MTrPs) and healthy volunteers without spontaneous pain (normal) were recruited for this study. Entropy filtering was performed on B-mode images of the upper trapezius and mean entropy values of symptomatic muscles were compared with healthy ones.
Entropy analysis was also used to evaluate the size of regions with low entropy.
We found that sites with active MTrPs have significantly lower entropy (p<0.05), i.e. they have more homogenous texture, than asymptomatic ones.
I. Introduction
Chronic pain is a critical public health problem [1]. A vast number of patients in specialty pain management centers and people with chronic pain disorders suffer from Myofascial Pain Syndrome (MPS) [2]. MPS is a common, nonarticular musculoskeletal disorder, characterized by myofascial trigger points (MTrPs). MTrPs are palpable, localized painful nodules in a taut band of skeletal muscle and are a characteristic finding in MPS [3]. MTrPs are diagnosed by physical examination (manual palpation) and clinical symptoms. However, reliability of MTrPs diagnosis through physical examination is still controversial [4]. Therefore, there is a clinical need to objectively quantify and evaluate the structural properties of skeletal muscle and the neighborhood of MTrPs in vivo [5]–[6]. In previous studies, we have demonstrated that MTrPs can be visualized using ultrasound imaging. It is also well known that speckle pattern (texture) of gray scale images of a muscle is strictly related to the nature of the medium itself. Scatterer density, distribution, size and shape are only some of the parameters that help to identify the structure of a biological tissue and determine its echotexture and echogenicity. Texture-based image analysis could potentially used to estimate the combined effect of all these parameters and extract some relevant information on the tissue structure. The objective of this study was to analyze the echotexture of the MTrPs and surrounding muscle and evaluate whether there are objective differences between tissue of symptomatic and asymptomatic subjects; and between painful nodules and non-nodular muscle in subjects with pain.
II. Methods
A. Subject selection and Physical Exam
Men and women with chronic cervical pain who met inclusion criteria (i.e. having an active MTrP in one or both upper trapezii) underwent a thorough musculoskeletal evaluation to rule out potential causes of their symptoms other than MTrPs. Symptomatic patients enrolled in this study were experiencing pain consistently over the past 3 months. A total of 29 subjects were studied, 15 asymptomatic normal (i.e., with no pain and no palpable MTrPs) control subjects (9 men and 6 women, age range 28±8 years) and 14 active (i.e., with chronic neck pain and with palpable active MTrPs) subjects (4 men and 10 women, age range 36±12). Each participant provided informed consent prior to involvement in the study. The study procedures were approved by Chesapeake Review Board.
The presence or absence of MTrPs in the upper trapezius muscle was determined following Travell and Simon's criteria according to standard clinical practice [3]. Palpation was performed in the central region of the upper trapezius muscle approximately midway between the cervical vertebrae and the acromion process. Sites were considered non-nodular if no palpable nodule was found. Active sites had at least one palpable nodule that was both spontaneously painful and produced the characteristic pain. Symptomatic patients, however, can have asymptomatic, non-nodular sites. In this study we will refer to those sites as non-nodular sites in symptomatic subjects to distinguish them from the normal sites in asymptomatic subjects.
The sonographers were blinded to the clinical status when acquiring ultrasound data. In this study, MTrPs were identified on ultrasound images using the methods we have previously described [7]. Briefly, hypoechoic areas were first detected using B-mode imaging (typically palpable MTrPs appear as focal darker areas [7]–[8]). Then an external vibration source, at around 100 Hz, was applied to the surrounding muscle and a color Doppler variance image was acquired (Fig. 1). MTrPs, being stiffer [9], vibrate with lower amplitude and appear as focal areas of color deficit in the color variance image (Fig. 1 (C)).
Figure 1.
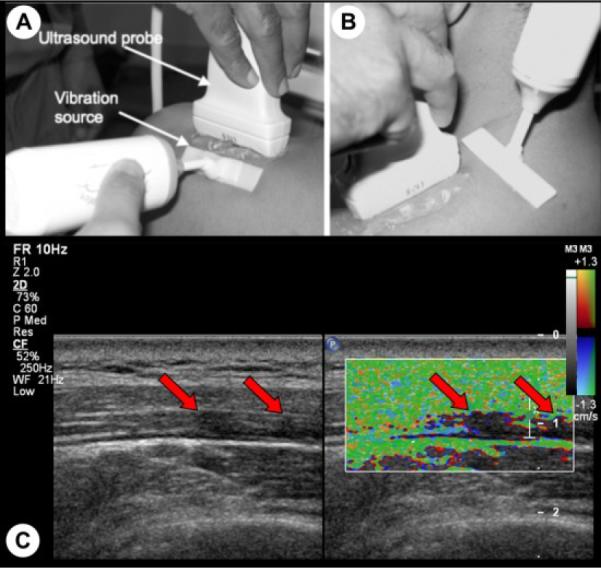
Localization of MTrPs using vibration elastography. An external massager generates shear waves that can propagate orthogonal (A) and parallel (B) to the muscle fibers. Hypoechoic areas (MTrPs) in B-mode image are observed to be vibrating less than the surrounding muscle in color variance image (C).
B. Image Processing for Evaluating Heterogeneity of the Muscle
Four sites in the upper trapezius muscle were investigated per subject and two B-mode images were collected at each site. Machine settings such as TGC gain, transmit and receive focusing were kept constant throughout all the measurements performed.
A total of 232 images were analyzed. Images were collected using the SonixRP US system (Ultrasonix Medical Corporation, Vancouver, BC) and a 5~14 MHz ultrasonic linear array transducer (L14-5), with 256 scan lines per frame, full sector size, and imaging depth of 2.5 cm.
Entropy filtering was performed on the B-mode images using the MATLAB (Mathworks, Natick, MA) image processing toolbox. The entropy filter returns a scalar value for each pixel of the input image so that each output pixel contains the entropy value of the neighborhood around the corresponding pixel in the input image. The neighborhood was defined to be a circle with radius equal to 5 pixels. The entropy value is a statistical measure of randomness and can be used to characterize the texture of an image [10]. Entropy, E, assigned to each pixel is defined as
| (1) |
where pn is the probability density of the nth gray level within the neighborhood of the input pixel.
In this study, mean entropy values obtained from images of the upper trapezius of symptomatic and asymptomatic patients were used as measure of heterogeneity of the tissue.
Fig. 2 (A) shows a representative B-mode image from a symptomatic subject. One can easily discriminate between subcutaneous tissue (the top layer), the fascia that surrounds the upper trapezius (two bright thin lines) and the underlying muscle. The region of interest (ROI), i.e. upper trapezius, was manually marked (yellow mask in Fig. 2 (C)) in each image and analysis was performed on those regions only. In the entropy-filtered image, regions with low entropy are regions that have homogeneous echotexture and will appear dark in the filtered image (Fig. 2 (B)).
Figure 2.
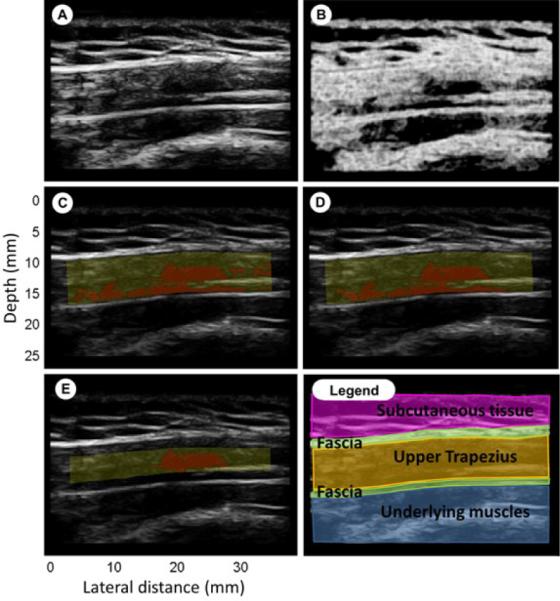
Entropy filtering. (A): B-mode image; (B): entropy image; (C): yellow mask highlight the ROI, red region has entropy<4; (D): ROI with size threshold; (E): Crop of the ROI by 20% to exclude muscle near the fascial border; (Legend): Fuscia is subcutaneous tissue, green are fascia, yellow is upper trapezius, blue are underlying muscles.
The goal of this analysis was to find whether such regions are associated with symptomatic sites in the upper trapezius muscle. Based on a visual analysis of entropy values and the corresponding B-mode image of suspected MTrPs, a threshold of 4 was used for localizing these regions. Regions with entropy less than 4 (red regions in Fig. 2 (C-D-E)) where considered homogeneous from the speckle (image texture) point of view. MTrPs should be above a certain size to be palpable during physical exam. Based on our previous experience, we chose a threshold of 8 mm2. In a second analysis, regions with entropy less than 4 and smaller than this threshold size were rejected using morphological image operations.
In most of the images a tiny elongated darker region was found at the boundary of the fascia (like in Fig. 2 (D)). This can be due to anisotropy of fiber alignment at the fascial border, or could potentially represent a taut band. In order to avoid confusion with nodular MTrPs, a separate analysis was performed by cropping the ROI by twenty percent on both the upper and lower boundaries to exclude the band.
C. Statistical Analysis
Statistical analysis was done using PASW 18 (SPSS Inc, Chicago, IL). Unpaired t-Test was performed to examine the effect of the tissue type (Active MTrP vs. Normal) on the tissue texture (mean entropy), i.e. tissue heterogeneity. The dependent variable, mean entropy, was normally distributed as assessed by the Shapiro-Wilk test. Non-normally distributed data, i.e. MTrPs sizes, were analyzed via Kruskal-Wallis test. Statistical significance was determined when p<0.05.
III. Results
Active sites, those with MTrPs, had significantly (p<0.05) lower entropy compared to the normal sites, whereas the texture of the images of non-nodular sites in symptomatic subjects was not significantly different from the active sites (blue bars in Fig. 3). The same result is obtained if a size threshold is applied on the ROI. A size distribution of regions with entropy less than 4 within a ROI showed that especially at normal sites, most of the regions with low entropy were small (less than 8 mm2). Those scattered regions can be perceived as background noise for an analysis that investigates larger regions with low entropy, and can therefore, be excluded for further investigations.
Figure 3.
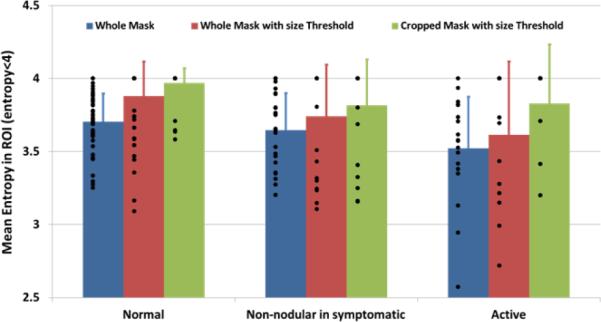
Entropy analysis results. Mean entropy in symptomatic tissue is significantly (p<0.05) lower than in healthy ones. Blue bars: results from the analysis of the whole mask; Red bars: results from size threshold application; Green bars: results from cropped ROI.
Subjects with myofascial pain were significantly older (p<0.05) than controls and this difference may be important in biological tissue characterization. We investigated whether age was a confounding factor in the entropy analysis. However, the mean entropy values were found to be almost equally distributed between older and younger subjects. The statistical difference observed between normal and active sites is not explained by age. Mean entropy data used in this analysis are those obtained from the application of a size threshold on the ROI (red bars in Fig. 3).
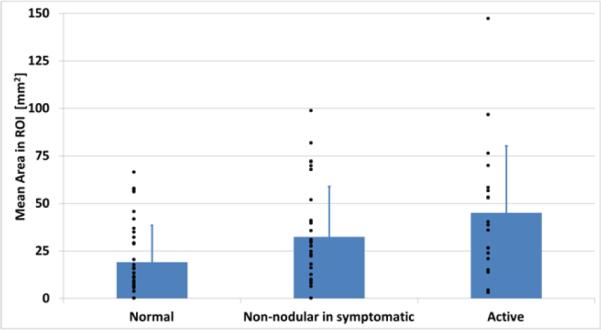
Estimation of the areas of low entropy regions was also performed. No significant difference was found between the sizes of regions at active sites compared to normal sites (Fig. 4), although mean area in symptomatic subjects showed a trend towards larger values. Comparison between size of the regions with low entropy and size of hypoechoic non-vibrating regions in vibration elastography images was also performed. Color Doppler variance images were analyzed, as previously described [8], and showed that non-vibrating regions are significantly larger (p<0.05) at active than at normal sites (Fig. 5), consistent with our previously published results. However, when sizes of non-vibrating regions are compared with low entropy regions we found that the latter are significantly (p<0.05) smaller than the former at active sites.
Figure 4.
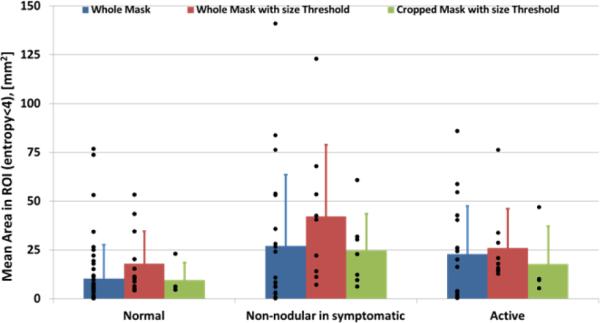
Mean area estimation of the ROI with entropy less than 4. Blue bars: results from the analysis of the whole mask; Red bars: results from size threshold application; Green bars: results from cropped ROI.
Figure 5.
Region size measurements from color Doppler images.
Additionally, mean entropy and area were estimated by excluding the band of muscle near the fascial border. The entropy and area analysis results did not change (see green bars in Fig. 3 and Fig. 4) but a substantial difference in number of regions with low entropy was found. This implies that regions with low entropy were often confined close to the boundary of the fascia.
IV. Discussion
Entropy analysis was performed on B-mode images of the upper trapezius of symptomatic and normal subjects. The entropy filtering returns a measure of echotexture of the speckle pattern. In our findings, tissues of asymptomatic subjects are significantly more heterogeneous in terms of echotexture than symptomatic ones. This means that texture analysis can be used as a tool to objectively discriminate between the muscle tissue of symptomatic and asymptomatic individuals. Texture image analysis has been used in the past for myocardial tissue characterization, in particular to differentiate normal form abnormal myocardial structure [11–13], tissue characterization of the human brain [14] and liver cancer [15]. Echotexture is a signature of the underlying scatterer distribution. If scatterers are uniformly distributed within the ROI then the region will appear heterogeneous (high entropy) with well-developed speckle. Homogeneous echotexture (low entropy) could indicate a sparse scatterer distribution. Fluid accumulation (edema) or increase of blood volume can cause localized regions of sparse scatterer distribution and hypoechogenicity, whereas fat infiltration can cause localized hyperechogenicity of the tissue. In the absence of any infiltrations, hypoechogenicity and low entropy can be explained by a local change of scatterer concentration or shape. Scatterer concentration as well as shape changes can occur when fibers contract, thus the low entropy could be indicative of local contractures in the muscle. The presence of localized regions of low entropy in symptomatic muscle makes the tissue macroscopically more heterogeneous than a normal muscle that has relatively uniform echotexture. This finding is in agreement with what was observed from our group in previous studies [7]–[9]: subjects with active trigger points showed spherical or band like hypoechoic (darker) regions along with an increase in fiber alignment heterogeneity. This paper aims to highlight the potential utility of quantifying muscle tissue heterogeneity (structural fibers “disorder”). Preliminary findings presented show that heterogeneity of the tissue changes with the severity of the symptoms and therefore useful as a complementary diagnostic tool.
It is important to note that age can have an effect on the appearance of the muscle. One limitation of our study sample is that the normal volunteers were not age matched with the symptomatic subjects. However, in our preliminary analysis, age did not appear to significantly correlate with entropy.
In this study we found that the regions within the muscle with low entropy are not significantly larger in symptomatic subjects than asymptomatic ones, while the non-vibrating regions identified through vibration elastography were larger. It is important to note that a B-mode image only shows a 2D slice of the milieu of the muscle. The macroscopic appearance of the muscle is better appreciated in a 3D volume. Fig. 6 shows a volume rendering of a stack of entropy-filtered images acquired using a mechanically scanned linear array probe (4D L14-5, Ultrasonix Medical Corporation, Vancouver, BC). The complex 3D appearance of the regions of low entropy is apparent. In future studies, we will quantify the echotexture in 3D to better characterize the muscle milieu.
Figure 6.
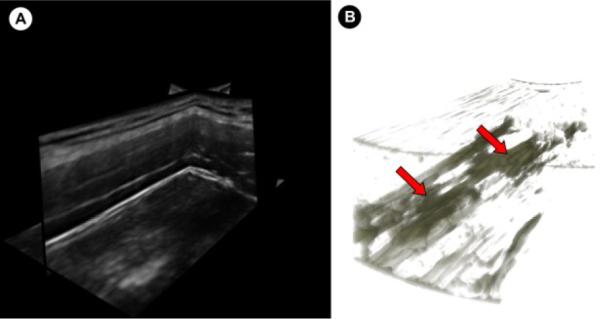
(A) Multiplanar view of a 3D volume of the upper trapezius acquired using a mechanically-scanned linear probe. (B) 3D volume rendering of the entropy-filtered stack of images in (A) showing the 3D structure of the regions with low entropy.
V. Conclusion
The data presented here demonstrates that echotexture analysis using local entropy can discriminate between subjects with active trigger points and normal controls. In addition, the entropy measure successfully distinguishes asymptomatic, non-nodular tissue in symptomatic subjects from non-nodular tissue in control subjects. These data suggest that there is a difference between clinically “normal” (non-nodular) tissue in subjects with symptoms and those who have normal tissue and no symptoms. This analysis alone is insufficient to explain the physical mechanism behind this phenomenon. In the future, measurements of attenuation and backscattering properties of the tissue need to be addressed in order to fully characterize MTrPs.
Acknowledgment
Research supported in part by a grant 1R01-AR057348 from National Institutes of Arthritis and Musculoskeletal and Skin Diseases at the NIH.
References
- [1].Gerwin RD. Classification, epidemiology, and natural history of myofascial pain syndrome. Curr Pain Headache Rep. 2001;5:412–420. doi: 10.1007/s11916-001-0052-8. [DOI] [PubMed] [Google Scholar]
- [2].Fishbain DA, Goldberg M, Meagher BR, Steele R, Rosomoff H. Male and female chronic pain patients categorized by DSM-III psychiatric diagnostic criteria. Pain. 1986;26:181–197. doi: 10.1016/0304-3959(86)90074-6. [DOI] [PubMed] [Google Scholar]
- [3].Simons DG, Travell JG, Simons PT. Myofascial pain and dysfunction: the trigger point manual. I. Upper half of body. 2nd ed. Lippincott Williams and Wilkins; Baltimore: 1999. [Google Scholar]
- [4].Lucas N, Macaskill P, Irwig L, Moran R, Bogduk N. Reliability of physical examination for diagnosis of myofascial trigger points: a systematic review of the literature. Clin J Pain. 2009;25:80–89. doi: 10.1097/AJP.0b013e31817e13b6. [DOI] [PubMed] [Google Scholar]
- [5].Mense S, Simons DG, Russell IJ. Muscle pain: Understanding its nature, diagnosis and treatment. Lippincott Williams and Wilkins; Philadelphia: 2001. [Google Scholar]
- [6].Simons DG, Mense S. Understanding and measurement of muscle tone as related to clinical muscle pain. Pain. 1998;75:1–17. doi: 10.1016/S0304-3959(97)00102-4. [DOI] [PubMed] [Google Scholar]
- [7].Sikdar S, Shah JP, Gebreab T, Yen RH, Gilliams E, Danoff J, Gerber LH. Novel applications of ultrasound technology to visualize and characterize myofascial trigger points and surrounding soft tissue. Arch Phys Med Rehabil. 2009;90:1829–1838. doi: 10.1016/j.apmr.2009.04.015. [DOI] [PMC free article] [PubMed] [Google Scholar]
- [8].Ballyns JJ, Shah JP, Hammond J, Gebreab T, Gerber LH, Sikdar S. Objective sonographic measures for characterizing myofascial trigger points associated with cervical pain. J Ultrasound Med. 2011;30:1331–1340. doi: 10.7863/jum.2011.30.10.1331. [DOI] [PMC free article] [PubMed] [Google Scholar]
- [9].Ballyns JJ, Turo D, Otto P, Shah J, Hammond J, Gebreab T, Gerber LH, Sikdar S. Office-based Elastography Technique for Quantifying Mechanical Properties of Skeletal Muscle. J Ultrasound Med. doi: 10.7863/jum.2012.31.8.1209. submitted for publication. [DOI] [PMC free article] [PubMed] [Google Scholar]
- [10].Gonzalez RC, Woods RE, Eddins SL. Digital Image Processing Using MATLAB. ch. 11. Prentice Hall; New Jersey: 2003. [Google Scholar]
- [11].Skorton DJ, Collins SM, Nicholas J, Pandian NB, Bean JA, Kerber RE. Quantitative texture analysis in two-dimensional echocardiography: Application to the diagnosis of experimental myocardial contusion. Circulation. 1983;68:217–223. doi: 10.1161/01.cir.68.1.217. [DOI] [PubMed] [Google Scholar]
- [12].Skorton DJ, Collins SM, Woskoff SD, Bean JA, Melton HE. Range- and azimuth- dependent variability of image texture in two dimentional echocardiogram. Circulation. 1983;68:834–840. doi: 10.1161/01.cir.68.4.834. [DOI] [PubMed] [Google Scholar]
- [13].Shung KK, Thieme GA. Ultrasonic Scattering in Biological Tissue. ch.10. CRC Press Inc.; Boca Raton, FL: 1993. [Google Scholar]
- [14].Lerski RA, Straughan K, Schad LR, Boyce D, Blüml S, Zuna I. VIII. MR image texture analysis - An approach to tissue characterization. Magnetic Resonance Imaging. 1993;11:873–887. doi: 10.1016/0730-725x(93)90205-r. [DOI] [PubMed] [Google Scholar]
- [15].Raeth U, Schlaps D, Limberg B, Zuna I, Lorenz A, van Kaick G, Lorenz WJ, Kommerell B. Diagnostic accuracy of computerized B-scan texture analysis and conventional ultrasonography in diffuse parenchymal and malignant liver disease. J. Clin. Ultras. 1985;13:87–99. doi: 10.1002/jcu.1870130203. [DOI] [PubMed] [Google Scholar]


