

Abstract
Two-photon laser scanning microscopy (2PLSM) allows fluorescence imaging in thick biological samples where absorption and scattering typically degrade resolution and signal collection of one-photon imaging approaches. The spatial resolution of conventional 2PLSM is limited by diffraction, and the near-infrared wavelengths used for excitation in 2PLSM preclude the accurate imaging of many small subcellular compartments of neurons. Stimulated emission depletion (STED) microscopy is a superresolution imaging modality that overcomes the resolution limit imposed by diffraction and allows fluorescence imaging of nanoscale features. Here, we describe the design and operation of a superresolution two-photon microscope using pulsed excitation and STED lasers. We examine the depth dependence of STED imaging in acute tissue slices and find enhancement of 2P resolution ranging from approximately fivefold at 20 μm to approximately twofold at 90-μm deep. The depth dependence of resolution is found to be consistent with the depth dependence of depletion efficiency, suggesting resolution is limited by STED laser propagation through turbid tissue. Finally, we achieve live imaging of dendritic spines with 60-nm resolution and demonstrate that our technique allows accurate quantification of neuronal morphology up to 30-μm deep in living brain tissue.
Introduction
Two-photon laser scanning microscopy (1) (2PLSM) allows fluorescence imaging in thick tissue where scattering and absorption of visible photons degrades signal detection and resolution. 2PLSM has been particularly useful in neurobiology for the study of synaptic structure and function in slices of living brain tissue (2). Of particular advantage has been the use of near-infrared excitation light, which preserves the ability to focus light deep within tissue, and the nonlinearity of multiphoton excitation, which localizes the distribution of excited fluorophores to a sub-femtoliter volume at the focus. Optical sectioning in 2PLSM eliminates the need for a scanned pinhole in the collection pathway and permits the use of scattered signal photons in image formation. However, because of the use of long-wavelength excitation light and the relatively low numerical aperture of water immersion objective lenses necessary for much live-tissue imaging, the resolution of conventional 2PLSM is physically limited by diffraction to hundreds of nanometers, obscuring cellular features on the nanoscale.
Advances in superresolution fluorescence techniques allow high-resolution fluorescence imaging of biological samples at resolutions beyond the diffraction limit. Among these techniques, stimulated emission depletion (3) (STED) microscopy has found many applications in biology (4–7). In conventional 2PLSM, the diffraction of light limits the minimal size of the focus, or point-spread function (PSF), of the microscope. The width of the PSF dictates the size of the smallest features that can be measured, limiting the imaging resolution to about half the wavelength of the excitation light. STED microscopy achieves superresolution by rapidly inducing molecular transitions from fluorescent states to the ground state via stimulated emission, thereby preventing spontaneous fluorescence emission from excited states. By shaping the STED laser focus in an annulus surrounding the excitation volume, suppression of fluorescence on the edge of the PSF reduces its size. The width of the STED-enhanced PSF is given by
in which λ is the wavelength of the excitation light, NA is the numerical aperture of the objective, I is the intensity of depletion light, and Isat is a fluorophore-dependent parameter defined by the intensity of light required to suppress 50% of fluorescence. Therefore, the theoretical resolution limit of a STED microscope is improved compared to conventional fluorescence microscopy by a factor
allowing the resolution to be adjusted by the intensity of depletion light (8).
STED microscopy has been successfully applied in conjunction with 2PLSM (STED2P) (9–11) to achieve superresolution imaging of 2P-excited (2PE) fluorescence. STED2P has been demonstrated to produce fivefold improvements in 2P imaging resolution in fixed cultured cells. Nevertheless, similar improvements in resolution by STED2P in thick slices of living tissue have not been achieved. Contemporary implementations in tissue have used a continuous-wave (CW) STED laser, which reduces the efficiency of the depletion process (9,12).
To improve the imaging resolution of STED2P, we constructed a microscope with electronically synchronized mode-locked lasers to drive fluorophore excitation and stimulated emission by laser pulses. We describe the implementation of STED2P with a pulsed depletion laser and systematic analysis of microscope performance in live-cell imaging conditions relevant to biological studies. Finally, we demonstrate fluorescence imaging of living neurons in acute brain slices at 60-nm resolution, an improvement of two-to-threefold compared to CW STED2P. Thus, pulsed STED2P (pSTED2P) permits superresolution imaging of neuronal structure under conditions typically used for electrophysiological analysis of neuron and synapse function.
Materials and Methods
Microscope design
Two-photon excitation was produced by ∼200-fs pulses at 80 MHz repetition rate from a mode-locked Ti:Sapphire laser (Chameleon; Coherent, Santa Clara, CA). STED laser light was produced by a second Ti:Sapphire laser (Mira-HP; Coherent) generating pulses of ∼2-ps duration at 736 nm for depletion of Alexa Fluor-594 (Life Technologies, Grand Island, NY) and Red fluorescent particles (Life Technologies). Pulse trains from the excitation and depletion lasers were synchronized and delay adjusted to produce maximal depletion by an electronic control circuit (Synchrolock; Coherent).
To prevent two-photon excitation by the STED laser at high depletion powers, STED pulses were further stretched from ∼2 to ∼200 ps by dispersion through 120 meters of polarization-maintaining single-mode fiber optic (model No. PM-S630-HP; Thorlabs, Newton, NJ). The outputs of both lasers were independently modulated with Pockels cells (model No. 350-80; Conoptics, Danbury, CT) and gated with mechanical shutters (model Nos. VS25S2ZM1 and LS6Z2, Uniblitz; Vincent Associates, Rochester, NY).
The STED laser was directed through a vortex phase plate (model No. VPP-2; RPC Photonics, Rochester, NY) producing a helical wavefront to form the annular intensity distribution in the specimen plane. The lasers were combined using a dichroic mirror (model No. 800SP; Chroma Technology, Bellows Falls, VT) and coaligned at the sample plane by simultaneous 2P imaging of quantum dots (QDot 605; Life Technologies, ∼20 nm diameter). Point-scanning was achieved by a symmetric pair of scanning galvanometers (model No. 6215H; Cambridge Technology, Cambridge, MA). The x-axis scan mirror was imaged by a pair of scan lenses (model No. FV-PL-5I; Olympus, Melville, NY) onto a second identical galvanometer oriented on an orthogonal axis to produce raster-scanning of the sample.
The scanning mirrors were imaged onto the back aperture of the objective (60×, 1.1 NA, LUMFL N; Olympus) with a scan lens (model No. FV-PL-5I; Olympus) and an achromatic tube lens (model No. AC508-200-B; Thorlabs). This optical arrangement places both scan mirrors and the back aperture of the objective in conjugate optical planes, creating stationary illumination at the objective back aperture and preserving the STED annulus across the scan field. Both laser beams were circularly polarized by passage through a combination of half- and quarter-wave plates (model Nos. 10RP42 and 10RP44; Newport, Irvine, CA).
Emitted fluorescence was collected by epi- and trans-fluorescence detectors. Short-pass dichroic filters (model No. 700DCXR; Chroma) and interference filters (model No. E700SP-2P) were used to eliminate excitation and depletion laser wavelengths. Green and red channels were separated using a dichroic filter (model No. 565DCXR; Chroma Technology) and barrier filters (green, 525/50; red, 630/60; Semrock, Rochester, NY). Emitted photons were detected using photomultiplier tubes (model No. H10770P-40MOD; Hamamatsu, Hamamatsu City, Japan). No pinhole was placed in the collection path.
Data acquisition and analysis
Imaging and physiology data were acquired using data acquisition boards (National Instruments, Austin, TX) and modified versions of the software ScanImage (14) with code written in MATLAB (The MathWorks, Natick, MA). STED laser powers were measured at the output of the microscope objective. Live neuron imaging was performed with a time-averaged STED power of ∼52 mW. Off-line analysis was performed using custom routines written in the softwares MATLAB (The MathWorks) and ImageJ (National Institutes of Health, Bethesda, MD).
Pixel size was measured by translation of a dye-filled, sealed pipette tip across the field of view with a calibrated micromanipulator, and independently confirmed by similar measurements using large, isolated fluorescent beads of 1-μm diameter (Yellow-Green FluoSpheres; Life Technologies). The pixel size of all images was 18 × 18 nm, and the pixel dwell time was 8 μs, unless stated otherwise. Fitting and measurement were performed on raw image data, unless specified otherwise. Background subtraction and median filtering was applied to example images for display. Background subtraction of STED laser light from STED2P images was achieved by acquiring a background image produced by the STED laser alone, mean filtering, and then subtracting the background image from the raw STED2P image.
Bead preparation and imaging
We used 40-nm diameter microspheres labeled with red fluorescent dye (Red FluoSpheres; Life Technologies) that were prepared in the mounting media ProLong Gold (Invitrogen, Carlsbad, CA) on glass coverslips and mounted on a glass slide. We also used 1-μm diameter microspheres labeled with red fluorescent dye (Red FluoSpheres, Life Technologies) that were prepared in a similar fashion.
Brain slice preparation and imaging
Horizontal slices 300-μm thick were cut from the hippocampus of 15–19-day-old C57BL6 mice in an ice-cold artificial cerebrospinal fluid (ACSF) containing: 125 mM NaCl, 2.5 KCl, 2 mM CaCl2, 1 mM MgCl2, 25 mM NaHCO3, 1.25 mM NaH2PO4, and 25 mM glucose, bubbled with 95% O2 and 5% CO2. After a 30-min incubation at 34°C, slices were stored in ACSF at room temperature (22–23°C) until use. Individual slices were transferred to a submersion-style recording chamber and continuously superfused with ACSF at a rate of 2–3 mL/min at room temperature.
Whole-cell recordings were obtained from hippocampal CA1 pyramidal neurons visually identified in the slice by Dodt contrast video microscopy. Recording pipettes (1–3 MΩ) were filled with Cs+ internal solution containing: 120 mM CsMeSO3, 15 mM CsCl, 8 mM NaCl, 10 mM TEA-Cl, 10 mM HEPES, 2–5 mM QX-314, 0.2 mM EGTA, 2 mM Mg-ATP, and 0.3 mM Na-GTP, pH 7.3 adjusted with CsOH. A quantity of 500 μM Alexa Fluor-594 was added in the internal solution for imaging of neuronal morphology.
Pulse timing analysis
To simulate the relationship between depletion efficiency and pulse timing, numerical integration of the following differential equation for the rate of fluorescence was performed in MATLAB (The MathWorks),
where kF represents a monoexponential spontaneous emission process, and N(t) is the population of the fluorescent state. Interaction with a STED pulse was modeled through coupling of the fluorescent state to a second, time-dependent decay pathway, obeying
The value kS(t) was modeled as a Gaussian pulse of temporal duration 2σ and offset τ.
Spine morphology analysis
Spine neck lengths, radii, and head volumes were quantified from STED2P images in the software MATLAB (The MathWorks). Neck lengths were traced by hand from the dendrite to the spine head. Measured neck radii were calculated from full width at half-maximum (FWHM) measurements taken at the thinnest portion of the neck. Inferred neck radii were calculated from background-subtracted STED2P images as follows: a wide, smooth segment of dendrite in each image was selected and modeled as a cylindrical volume of radius rD and length lD. The width of the dendrite was used to infer the dendritic radius, and the total fluorescence from the segment was integrated and then divided by the calculated volume of the segment to determine the fluorescence per unit volume, denoted here by ΓD,
The value ΓD is assumed to depend only on the excitation intensity, which varies negligibly over the small field of view (5 μm × 5 μm). The finite z axis extent of the microscope PSF was also neglected, given the small dimensions of the imaged structures relative to the z-resolution of the microscope (∼2 μm FWHM). The neck volume VN was calculated by integrating the neck fluorescence in a rectangular region of interest around the neck and dividing by ΓD. The inferred neck radius rN was calculated by modeling the neck as a cylinder and dividing the neck volume by the length of the region of interest to determine the cross-sectional area:
The boundary of the spine head was identified with a combination of median filtering and thresholding, and the head volume was calculated by dividing the integrated fluorescence within the head by ΓD.
Results and Discussion
To achieve superresolution imaging of living neurons in an acute brain slice, we constructed a two-photon laser-scanning microscope incorporating pulsed stimulated emission depletion (STED) of fluorescence produced by 2PE (see Materials and Methods for details; and see Fig. 1). Synchronization of the excitation and STED pulses was achieved by a commercial closed-loop electronic circuit. 2PE imaging of bright quantum dots allowed for direct visualization of the STED laser focus and precise spatial coalignment of the excitation and STED lasers (Fig. 1, inset).
Figure 1.

Design of pulsed STED 2PLSM microscope. Laser pulses from a femtosecond-pulsed Ti-Sapphire laser (Excitation) for two-photon excitation (2PE) are synchronized by an electronic feedback circuit (Synchrolock) with a picosecond-pulsed Ti-Sapphire laser (STED) for stimulated emission. STED pulses are stretched to ∼200 ps by dispersion through a 120-m single-mode polarization-maintaining fiber-optic (FO), and phase-patterned to achieve a helical wavefront by a vortex phase plate (VP). The 2PE and STED lasers are combined by a dichroic (D1) filter. Fluorescence is separated from excitation and depletion light by a dichroic (D2) filter and collected by photomultiplier tubes (PMT). The λ/2 and λ/4 elements are half- and quarter-waveplates used to adjust the polarization and compensate for downstream elements in the scan head, such as dichroics filters, that perturb the polarizations of the excitation and depletion light (SL, scan lens; TL, tube lens; SM, scanning mirror; Obj, objective). (Inset) Visual alignment of 2PE and STED foci by fluorescence imaging of quantum dots (Qdot605; Invitrogen). Composite imaging of the 2PE point-spread function (PSF) and STED PSF allows spatial coalignment in the XY (left) and XZ (right) planes.
To demonstrate the ability of the microscope to suppress fluorescence by pulsed STED, we imaged a sealed glass pipette containing Alexa Fluor-594 (A594) by 2PE with the excitation laser tuned to 810 nm and briefly illuminated the pipette with STED laser pulses centered on 736 nm (Fig. 2, a and b). By varying the relative delay between the excitation and STED pulse trains, we observed that the efficiency of depletion depended on the timing interval between the pulse arrivals (Fig. 2 c) in a manner consistent with STED produced by a ∼200-ps pulse. Depletion efficiency was quantified by the STED laser power needed to suppress 50% of fluorescence, Psat, which is related to Isat in Eq. 1 by a factor determined by the spatial geometry of the microscope focus. Comparison of depletion efficiency by mode-locked and CW output produced by the same STED laser demonstrated an approximately sevenfold enhancement by pulsed depletion (pulsed Psat = 1.0 mW, CW Psat = 7.2 mW; Fig. 2 d).
Figure 2.
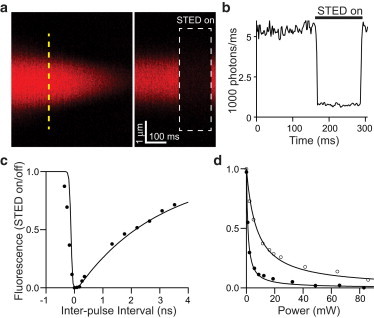
Efficacy of pulsed depletion of 2P excited fluorophores. (a) 2PLSM image (λexc = 810 nm) of sealed glass pipette containing a solution of the red fluorophore Alexa Fluor-594 (left) and fluorescence collected in linescan mode (right, along dashed line). During the time indicated (boxed white region), the pulsed STED laser light was delivered (λsted = 736 nm), suppressing fluorescence. For these experiments, the vortex phase plate was withdrawn from the STED path to deplete the entire excitation volume. (b) Fluorescence in the pipette measured in linescan (see panel a) before, during, and after pSTED illumination, demonstrating reversible suppression of fluorescence. (c) Fluorescence depletion efficiency, quantified as the ratio of fluorescence with and without pSTED illumination plotted against the relative timing delay between excitation and STED pulses. Depletion efficiency versus relative timing was numerically simulated for a 200-ps STED pulse (solid line). (d) Depletion efficiency versus STED laser power for pulsed (solid circles) and continuous wave (open circles) depletion modes. Data points were fit to rectangular hyperbolas to determine the power producing 50% depletion (Psat).
To demonstrate superresolution imaging of targets of known shape and to estimate the increase in resolution achievable by pulsed STED 2PLSM (pSTED2P) for a particular fluorophore, we imaged 40-nm diameter polystyrene beads containing red fluorescent dye (Fig. 3 a). Analysis of bead fluorescence demonstrated a nearly threefold improvement in resolution (2P FWHM = 377 nm; pSTED2P FWHM = 144 nm) (Fig. 3 b) with pulsed depletion. The dependence of the bead resolution on STED power was well fit by the inverse square-root relation (Eq. 1; Fig. 3 c). The value of Psat derived from the fit to the resolution data (Psat = 2.41 ± 0.24 mW) was in agreement with the value determined from depletion curves measured with 1-μm diameter red fluorescent beads (Psat = 2.44 ± 0.10 mW; see Fig. S1 in the Supporting Material), demonstrating STED resolution enhancement in accord with theoretical expectations.
Figure 3.
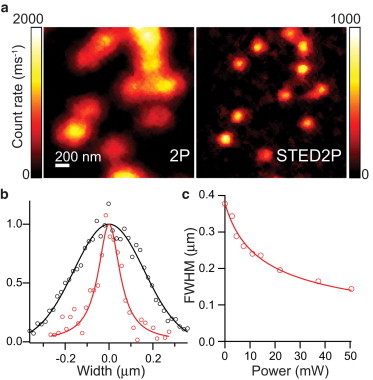
Pulsed STED2P imaging of red fluorescent beads. (a) Images of 40-nm red fluorescent beads with conventional 2PLSM (left) and pulsed STED 2PLSM (right). (b) Line profile of bead fluorescence measured across an isolated bead in panel a by 2PLSM (black markers) and pSTED 2PLSM (red markers). 2P data were fit by a Gaussian (FWHM = 377 nm) and pSTED2P data were fit by a Lorentzian (FWHM = 144 nm). (c) FWHM of pSTED2P images of isolated beads plotted against STED power. Bead profiles were fit with Gaussian and Lorentzian functions, and the FWHM was determined from the function producing the best fit. Data points were fitted to the inverse square-root function in Eq. 1 (solid line).
To characterize the enhancement in resolution of small structures embedded in living tissue, we imaged dendritic spines of CA1 pyramidal neurons in the native brain tissue of a 300-μm-thick acute slice. Individual cells were filled with A594 through a whole-cell recording electrode under conditions identical to those used for electrophysiological analysis of neuronal function (15). To examine the enhancement in resolution afforded by the improved depletion efficiency of pulsed over CW mode, the same dendritic spines were imaged by pSTED2P and by CW STED2P under identical time-averaged STED power (Fig. 4 a). Both modalities showed improvement relative to conventional 2P imaging, and comparison between modes revealed a significant reduction in the apparent spine neck widths measured by pulsed over CW STED2P (Fig. 4, b and c).
Figure 4.
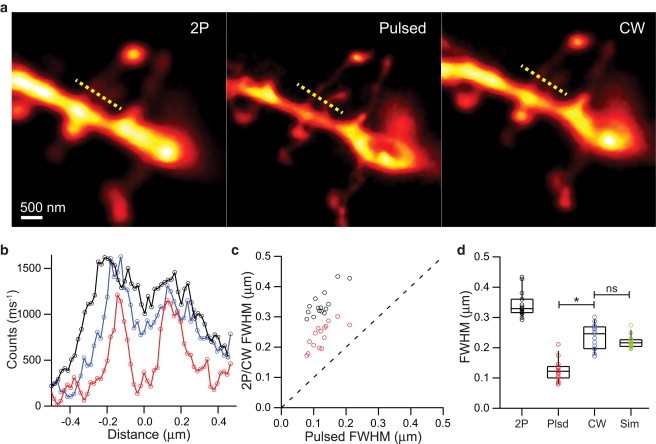
Comparison of pulsed and CW STED2P imaging in tissue. (a) Images of a spiny dendrite taken with 2PLSM (left), pulsed STED 2PLSM (middle), and CW STED 2PLSM (right). (b) Line profiles of closely spaced spine necks (along the dashed yellow lines) in panel a taken by 2PLSM (black), CW STED2P (blue), and pSTED2P (red). Background counts have been subtracted and baselined for display. (c) Distribution of apparent widths of spine necks (n = 15) as measured by 2PLSM (black markers) and CW STED2P (red markers) compared with measurements by pSTED2P. (Dashed line) Unity. (d) Neck widths measured by 2PLSM (2P), pSTED2P (Plsd), and CW STED2P (CW), and simulated widths (Sim) derived from pSTED2P measurements convolved with 170 nm PSF. ∗, P < 0.05; ns, not significant (Mann-Whitney rank sum test).
Using the pSTED2P values as the true widths of a model cylindrical neck, we convolved circular cross-sections of the measured neck radii with a Lorentzian PSF of 170 nm width, the resolution predicted by the Psat of CW depletion (Psat = 7.2 mW, Fig. 2). The resulting distribution of model widths was not statistically different from the distribution of widths measured in CW mode (Fig. 4 d), suggesting that the improvement in depletion efficiency, as quantified by the smaller Psat of pSTED2P, might account for the difference in measurement.
Penetration of 2PE imaging in tissue is limited by reduction of signal generation due to scattering and absorption. Similarly, STED resolution enhancement may be impacted by scattering and absorption of depletion light in dense neuropil. To measure the effect of depth on pSTED2P imaging, we imaged dendritic spines at shallow (10–30 μm) and deep (80–100 μm) locations in slice (Fig. 5 a). pSTED2P images showed reduced neck widths at all depths compared to 2PLSM, and further comparison of the distribution of widths showed clustering around larger values in the case of deep imaging (Fig. 5 b).
Figure 5.
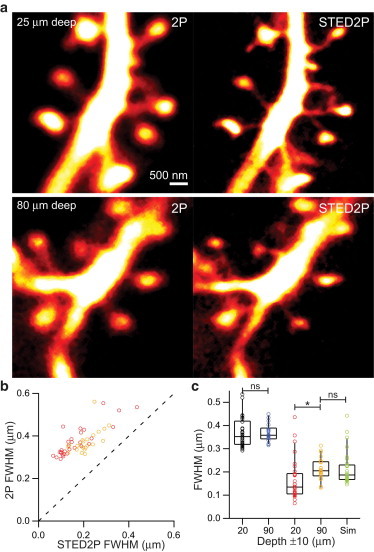
Depth dependence of resolution in acute brain slices. (a) Images of spiny dendrites taken with 2PLSM (left column) and pulsed STED2P (right column) imaged at 25-μm deep (top row) and 80-μm deep (bottom row). (b) Distribution of apparent widths of spine necks as measured by 2PLSM compared with measurements by pSTED2P 10–30 μm deep (n = 29, red markers) and 80–100 μm deep (n = 21, yellow markers). (Dashed line) Unity. (c) Neck widths measured by 2PLSM shallow (black markers) and deep (blue markers), and by pSTED2P shallow (red markers) and deep (yellow markers). ∗, P < 0.05; ns, not significant (Mann-Whitney rank sum test).
The difference in neck width distributions was statistically significant between the shallow and deep groups (p < 0.01, Fig. 5 c). Using the smallest width (132 nm) measured in the deep group as an estimate of the resolution 80–100 μm below the surface of the slice, and using the distribution of widths measured in the shallow group as a model distribution for the true spine neck widths, we convolved the shallow distribution of neck widths with a Lorentzian PSF of 132-nm width and found that the difference between the model distribution and the deep distribution was not statistically significant (Fig. 5 c).
To examine whether this apparent depth dependence of resolution could reflect depth dependence of depletion efficiency, we removed the helical phase plate and measured the depletion of A594 in dendrites at various depths in the slice (Fig. 6, a–c). Psat increased with depth, indicating a decreasing efficiency of depletion (Fig. 6 d). The distribution of Psat versus depth was well fit by an exponential of surface constant, Psat(0) = 0.55 ± 0.03 mW, and length constant, λ = 45 ± 2 μm. Replacing the constant Isat in Eq. 1 with the exponential fit produced a theoretical relation between resolution and depth, indicating resolution enhancement could range from greater than fivefold close to the surface to approximately twofold at 100-μm deep (Fig. 6 e). Comparing the improvement in apparent width of the smallest spine necks in Fig. 5 with the theoretical resolution curve showed relatively good agreement, with the caveat that improvements in neck width measurements should be smaller on average than the theoretically predicted improvement in resolution due to the finite width of the imaged structures.
Figure 6.

Tissue penetration of depletion in acute brain slices. (a) 2PLSM image of spiny dendrite (left) and fluorescence collected in linescan mode (right, along the dashed line). pSTED light was simultaneously applied during the time period indicated (white dashed box). The vortex phase plate was withdrawn from the pSTED path to deplete the entire excitation volume. (b) Fluorescence averaged across the dendrite measured in linescan in panel a and normalized to the period before pSTED illumination. (c) Depletion efficiency versus pSTED laser power measured at 20 (red), 70 (yellow), 110 (blue), and 140 (black) μm deep. Data points were fit to rectangular hyperbolas to determine Psat. (d) Psat versus depth in slice. Data points were fit to an exponential to determine a surface constant (Psat(0) = 0.55 mW) and length constant (λ = 45 μm). (e) Theoretical improvement in resolution versus depth in slice derived from Eq. 1 for 52 mW STED power and modeled with a depth-dependent Psat determined from the fit in panel d. The width ratio of the five smallest necks from Fig. 5 shallow (red markers) and deep (yellow markers) groups are superimposed on the theoretical curve with mean ± SE values (black markers).
Refractive index mismatch between the intended immersion medium of a high numerical aperture objective and the sample results in aberrations that could impede depletion and degrade resolution. While imaging at depths close to 100 μm, we adjusted the correction collar of the microscope objective to test whether the depletion efficiency could be improved. Depletion should be highly sensitive to aberration of the focus, and Psat increased in general with collar settings different from the “zero” mark defined for use in water (see Fig. S2). As we could not recover the efficiency of depletion power by adjusting the objective’s correction collar, suggesting that reduced depletion efficiency at depth is not a result of index mismatch.
To measure the resolution and image quality achievable with our design, we imaged a large number of dendritic spines of varying geometries within 30 μm of the tissue surface. Comparison of images obtained with conventional 2P to those acquired with pSTED2P demonstrated enhanced resolution of fine morphological details of spine heads and changes in the apparent sizes of small structures such as spine necks (Fig. 7 a). The apparent width of thin necks indicated ∼60-nm resolution is achievable (Fig. 7 b) without visible signs of photodamage or change in holding current. Measurements of spine necks and heads revealed significant differences in the apparent sizes of structures between 2P and pSTED2P images.
Figure 7.

Imaging with 60-nm resolution in acute brain slices. (a) Images of a spiny dendrite taken with 2PLSM (left) and pulsed STED 2PLSM (right) 16 μm below the tissue surface. Note that spinules emerging from the heads of spines are visualized in the pSTED2P but not in the 2P image. (b) Line profiles of a thin spine neck (along the dashed yellow lines) in panel a taken by 2PLSM (black circles) and pSTED2P (red circles). The data were fitted with a Gaussian of 328 nm FWHM (black line) and a Lorentzian of 68 nm FWHM (red line). (c) Distribution of apparent widths of spine necks (n = 67) as measured by 2PLSM compared with measurements by pSTED2P. The widths of larger, well-isolated features such as spine heads and dendrites were also measured (blue circles). Simulated measurements (black line) of model data are plotted for 2PLSM and pSTED2P resolutions of 300 nm and 60 nm, respectively. (Dashed line) Unity. (d) Distribution of spine neck radii inferred from total fluorescence (see Materials and Methods) versus radii measured by pSTED2P. (Dashed line) Unity. (e) Distributions of spine neck radii (Rn), neck lengths (Ln), and head volumes (Vh) measured by pSTED2P.
Measurements of neck widths in conventional 2P imaging were often contaminated by fluorescence from the spine head and parent dendrite, resulting in larger differences in measured size than would be expected from the cylindrical geometry of necks alone. Simulation of resolution enhancement for circular structures of varying diameter showed that the apparent width relationship in uncontaminated images is consistent with a fivefold improvement in imaging resolution (Fig. 7 c).
As an alternative estimate of spine neck dimensions, we inferred the neck radius of isolated spines from the total integrated fluorescence of the neck volume (see Materials and Methods for details) and comparison with the measured widths indicated good agreement (Fig. 7 d). This inferred measurement of the neck radius depends on the conformity of the true neck shape to an ideal cylinder and on the accuracy with which the fluorescence per unit volume can be determined in the large diameter dendrite, and does not depend on the imaging resolution (see Fig. S3).
Agreement between the resolution-independent inferred measurements and resolution-dependent direct measurements indicates that spines can be accurately imaged with our microscope parameters up to 30-μm deep. Images of spine necks showed an average diameter of 0.18 ± 0.03 μm (mean ± SD), average lengths of 0.44 ± 0.35 μm, and average head volumes of 36 ± 12 aL (attoLiters), in agreement with published results from other high-resolution fluorescence studies and reconstructions by electron microscopy for spines of small size (16–18) (Fig. 7 e).
Conclusion
We have described the construction and performance of a synchronized, mode-locked STED 2PLSM imaging system, and our results demonstrate the ability of pSTED2P microscopy to achieve resolutions fivefold beyond the diffraction limit in living tissue. The ability to achieve 60-nm resolution in an acute brain slice under conditions used for electrophysiological analysis allows accurate imaging of dendritic spine morphology and raises the possibility of quantitative studies of the influence of spine geometry on synaptic physiology in brain tissue. For example, computational and theoretical studies examining the effects of spine head and neck shapes on biochemical and electrical compartmentalization could benefit from the combination of superresolution imaging and physiological methods (19). Moreover, the resolution of the pSTED2P microscope and results described here might also be extended to studies of other biological systems where the tissue penetrating capability of 2PLSM has proved useful.
As of this writing, the resolution of pSTED2P at a given depth in turbid tissue appears to be limited mainly by transmission of STED laser light to the focus. Resolution at depth depends on the local intensity of depletion light, which will be reduced by propagation through brain tissue due to scattering, absorption, and wavefront deformation (20). Forward scatter and absorption losses might be most simply compensated for by increasing the STED laser power as is commonly done in conventional deep tissue two-photon imaging; however, limitations due to photodamage thresholds and signal/background losses may determine the practical ceiling of achievable resolution for a particular fluorophore.
Considering the results of this study, perhaps the most promising avenues for further improvement of the achievable depth and resolution will come from advances in fluorescent dye and protein engineering to produce brighter, more photostable, and more efficiently depletable fluorophores better suited for STED imaging (21), as well as from novel methods to correct for instrument and sample-induced deformations of the STED focus (22).
Acknowledgments
The authors thank the members of the Sabatini lab for helpful discussions and the lab of Professor Wade G. Regehr for technical assistance.
This project was supported by the National Institutes of Health (grant No. ARRA RC1NS068917). K.T.T. was supported by a training grant from the National Institutes of Health Blueprint for Neuroscience Research (grant Nos. T90DA022759/R90DA023427).
Footnotes
Jun B. Ding’s present address is Department of Neurology and Neurological Sciences, Stanford University School of Medicine, Stanford, California.
Supporting Material
References
- 1.Denk W., Strickler J.H., Webb W.W. Two-photon laser scanning fluorescence microscopy. Science. 1990;248:73–76. doi: 10.1126/science.2321027. [DOI] [PubMed] [Google Scholar]
- 2.Svoboda K., Yasuda R. Principles of two-photon excitation microscopy and its applications to neuroscience. Neuron. 2006;50:823–839. doi: 10.1016/j.neuron.2006.05.019. [DOI] [PubMed] [Google Scholar]
- 3.Hell S.W., Wichmann J. Breaking the diffraction resolution limit by stimulated emission: stimulated-emission-depletion fluorescence microscopy. Opt. Lett. 1994;19:780–782. doi: 10.1364/ol.19.000780. [DOI] [PubMed] [Google Scholar]
- 4.Nägerl U.V., Willig K.I., Bonhoeffer T. Live-cell imaging of dendritic spines by STED microscopy. Proc. Natl. Acad. Sci. USA. 2008;105:18982–18987. doi: 10.1073/pnas.0810028105. [DOI] [PMC free article] [PubMed] [Google Scholar]
- 5.Urban N.T., Willig K.I., Nägerl U.V. STED nanoscopy of actin dynamics in synapses deep inside living brain slices. Biophys. J. 2011;101:1277–1284. doi: 10.1016/j.bpj.2011.07.027. [DOI] [PMC free article] [PubMed] [Google Scholar]
- 6.Berning S., Willig K.I., Hell S.W. Nanoscopy in a living mouse brain. Science. 2012;335:551. doi: 10.1126/science.1215369. [DOI] [PubMed] [Google Scholar]
- 7.Willig K.I., Kellner R.R., Hell S.W. Nanoscale resolution in GFP-based microscopy. Nat. Methods. 2006;3:721–723. doi: 10.1038/nmeth922. [DOI] [PubMed] [Google Scholar]
- 8.Harke B., Keller J., Hell S.W. Resolution scaling in STED microscopy. Opt. Express. 2008;16:4154–4162. doi: 10.1364/oe.16.004154. [DOI] [PubMed] [Google Scholar]
- 9.Ding J.B., Takasaki K.T., Sabatini B.L. Supraresolution imaging in brain slices using stimulated-emission depletion two-photon laser scanning microscopy. Neuron. 2009;63:429–437. doi: 10.1016/j.neuron.2009.07.011. [DOI] [PMC free article] [PubMed] [Google Scholar]
- 10.Moneron G., Hell S.W. Two-photon excitation STED microscopy. Opt. Express. 2009;17:14567–14573. doi: 10.1364/oe.17.014567. [DOI] [PubMed] [Google Scholar]
- 11.Li Q., Wu S.S., Chou K.C. Subdiffraction-limit two-photon fluorescence microscopy for GFP-tagged cell imaging. Biophys. J. 2009;97:3224–3228. doi: 10.1016/j.bpj.2009.09.038. [DOI] [PMC free article] [PubMed] [Google Scholar]
- 12.Willig K.I., Harke B., Hell S.W. STED microscopy with continuous wave beams. Nat. Methods. 2007;4:915–918. doi: 10.1038/nmeth1108. [DOI] [PubMed] [Google Scholar]
- 13.Reference deleted in proof.
- 14.Pologruto T.A., Sabatini B.L., Svoboda K. ScanImage: flexible software for operating laser scanning microscopes. Biomed. Eng. Online. 2003;2:13. doi: 10.1186/1475-925X-2-13. [DOI] [PMC free article] [PubMed] [Google Scholar]
- 15.Giessel A.J., Sabatini B.L. M1 muscarinic receptors boost synaptic potentials and calcium influx in dendritic spines by inhibiting postsynaptic SK channels. Neuron. 2010;68:936–947. doi: 10.1016/j.neuron.2010.09.004. [DOI] [PMC free article] [PubMed] [Google Scholar]
- 16.Harris K.M., Jensen F.E., Tsao B. Three-dimensional structure of dendritic spines and synapses in rat hippocampus (CA1) at postnatal day 15 and adult ages: implications for the maturation of synaptic physiology and long-term potentiation. J. Neurosci. 1992;12:2685–2705. doi: 10.1523/JNEUROSCI.12-07-02685.1992. [DOI] [PMC free article] [PubMed] [Google Scholar]
- 17.Arellano J.I., Benavides-Piccione R., Yuste R. Ultrastructure of dendritic spines: correlation between synaptic and spine morphologies. Front. Neurosci. 2007;1:131–143. doi: 10.3389/neuro.01.1.1.010.2007. [DOI] [PMC free article] [PubMed] [Google Scholar]
- 18.Izeddin I., Specht C.G., Dahan M. Super-resolution dynamic imaging of dendritic spines using a low-affinity photoconvertible actin probe. PLoS ONE. 2011;6:e15611. doi: 10.1371/journal.pone.0015611. [DOI] [PMC free article] [PubMed] [Google Scholar]
- 19.Holcman D., Schuss Z. Diffusion laws in dendritic spines. J. Math. Neurosci. 2011;1:10. doi: 10.1186/2190-8567-1-10. [DOI] [PMC free article] [PubMed] [Google Scholar]
- 20.Chaigneau E., Wright A.J., Silver R.A. Impact of wavefront distortion and scattering on 2-photon microscopy in mammalian brain tissue. Opt. Express. 2011;19:22755–22774. doi: 10.1364/OE.19.022755. [DOI] [PMC free article] [PubMed] [Google Scholar]
- 21.Morozova K.S., Piatkevich K.D., Verkhusha V.V. Far-red fluorescent protein excitable with red lasers for flow cytometry and superresolution STED nanoscopy. Biophys. J. 2010;99:L13–L15. doi: 10.1016/j.bpj.2010.04.025. [DOI] [PMC free article] [PubMed] [Google Scholar]
- 22.Ji N., Milkie D.E., Betzig E. Adaptive optics via pupil segmentation for high-resolution imaging in biological tissues. Nat. Methods. 2010;7:141–147. doi: 10.1038/nmeth.1411. [DOI] [PubMed] [Google Scholar]
Associated Data
This section collects any data citations, data availability statements, or supplementary materials included in this article.