

Abstract
Many cellular structures and organelles are too small to be properly resolved by conventional light microscopy. This is particularly true for dendritic spines and glial processes, which are very small, dynamic, and embedded in dense tissue, making it difficult to image them under realistic experimental conditions. Two-photon microscopy is currently the method of choice for imaging in thick living tissue preparations, both in acute brain slices and in vivo. However, the spatial resolution of a two-photon microscope, which is limited to ∼350 nm by the diffraction of light, is not sufficient for resolving many important details of neural morphology, such as the width of spine necks or thin glial processes. Recently developed superresolution approaches, such as stimulated emission depletion microscopy, have set new standards of optical resolution in imaging living tissue. However, the important goal of superresolution imaging with significant subdiffraction resolution has not yet been accomplished in acute brain slices. To overcome this limitation, we have developed a new microscope based on two-photon excitation and pulsed stimulated emission depletion microscopy, which provides unprecedented spatial resolution and excellent experimental access in acute brain slices using a long-working distance objective. The new microscope improves on the spatial resolution of a regular two-photon microscope by a factor of four to six, and it is compatible with time-lapse and simultaneous two-color superresolution imaging in living cells. We demonstrate the potential of this nanoscopy approach for brain slice physiology by imaging the morphology of dendritic spines and microglial cells well below the surface of acute brain slices.
Introduction
Most neurons in the mammalian brain are studded with hundreds to thousands of dendritic spines (1). Spines are tiny specializations of the postsynaptic membrane that are packed with receptors, ion channels, and other signaling complexes and mediate fast excitatory synaptic transmission in the brain. Their structural dynamics are thought to be critical for brain development and experience-dependent synaptic plasticity throughout life (2).
Thus, quantitative measurements of the structure and function of spines have been a primary endeavor in neuroscience research for a long time. Getting reasonable optical access is a huge challenge, because they are embedded in dense brain tissue and are oftentimes smaller than what can be resolved by diffraction-limited light microscopy, including two-photon (2P) microscopy.
Moreover, recent studies indicate that spines also interact directly with surrounding glial cells, like astrocytes and microglia (3,4), which extend extremely thin processes. Hence, to study how spines operate and interact with their partners in a complex and dynamic environment, it is essential to image several cell types at the same time with sufficient spatial resolution below the diffraction limit. In recent years, several big steps have been made in developing methods to make this possible.
Starting a new era in optical microscopy, stimulated emission depletion (STED) microscopy (5–7) has allowed for nanoscale imaging of dynamic events in living tissue, imaging synaptic vesicles (8) and spine morphology (9). Furthermore, several strategies were recently developed for multicolor STED imaging (10–13).
Most STED studies to date have been done in culture systems using oil objectives (e.g., Westphal et al. (8), Nägerl et al. (9), and Willig et al. (14)), but the experimental preparation of choice for synaptic physiologists is acute brain slices. To record healthy cells in acute brain slices, it is necessary to image a few tens of microns deep in the tissue, which cannot be done with oil objectives. Although glycerol objectives can substantially extend optical penetration without compromising spatial resolution (15), they are not compatible with acute brain slices, which call for an upright microscope design and water-immersion objectives with long working distances to accommodate electrophysiological recording electrodes.
The combination of 2P excitation and STED (2P-STED) microscopy (16,17) opened new perspectives for superresolution imaging in deep tissue. However, the use of continuous wave (CW) STED lasers limited the spatial resolution to 250 nm in living tissue (16).
In this study, our goal was to overcome these limitations and to achieve true subdiffraction imaging in acute brain slices a few cell layers below the tissue surface, which corresponds to a depth usually targeted in patch-clamp electrophysiology experiments. To this end, we developed a new 2P-STED microscope incorporating a pulsed STED laser, a long-working distance water objective and spectral detection for two-color imaging.
We characterize the 2P-STED microscope and illustrate its potential by imaging dendritic spines in acute brain slices. The spatial resolution in the focal plane of the new microscope is four to six times better than that of a regular, diffraction-limited 2P microscope. Furthermore, we show that the microscope is compatible with time-lapse and two-color superresolution imaging, using transgenic mice in which neurons and microglia are labeled with yellow (YFP) and green fluorescent protein (GFP), respectively.
Materials and Methods
Lasers
A femtosecond mode-locked Ti:Sapphire laser (Mai Tai, Spectra-Physics, Darmstadt, Germany) operating at ∼80 MHz and a wavelength of 797 nm was used in combination with an optical parametric oscillator (OPO BASIC Ring fs, APE, Berlin, Germany) to produce pulses at a wavelength of 592 nm (STED laser). The pulses of originally ∼200-fs duration were stretched to >68 ps by passing them through a 25-cm dispersive glass rod (high-refractive-index flint glass) and a 20-m-long polarization-preserving fiber (Schäfter & Kirchhoff, Hamburg, Germany). A reflection from the STED laser was used to synchronize a second mode-locked ultrafast Ti:Sapphire laser (Tsunami, Spectra-Physics) operating at 910 nm for 2P excitation (2P laser).
Synchronization and fine pulse delay (<2 ns) was performed via phase-locked loop electronics (3930, Lok-to-Clock, Spectra-Physics), while the coarse delay was set by varying the length of the BNC cable, using a fast photodiode (3932-LX, Spectra-Physics) placed below the microscope objective for readout.
Laser intensities were controlled via dedicated electro-optical modulators (Conoptics, Danbury, CT) for the 2P and STED laser beams. The time-averaged power at the back focal plane (BFP) of the objective was between 15 and 25 mW for the 2P light and between 20 and 40 mW for the STED light, depending on imaging depth and sample brightness.
Microscope setup
The microscope was built around a standard commercial research microscope (BX51WI, Olympus, Hamburg, Germany) using scan and tube lenses from the microscope manufacturer. The telecentric scanner (Yanus IV, TILL Photonics, Gräfelfing, Germany) was placed so that both scan axes are projected into the BFP of the objective, ensuring that the 2P and STED laser beams stay stationary at the BFP during scanning.
A water-immersion objective with a long working distance (1.5 mm) and equipped with a correction collar was used for all experiments (60X LUMFI, 1.1 NA, Olympus). The correction collar was adjusted to optimize the STED doughnut using gold nanospheres (diameter = 150 nm; BBInternational, Cardiff, United Kingdom) and slightly readjusted for particular imaging depths, using the 2P fluorescence signal as readout. The z-position of the objective was controlled via a piezo actuator (P-721 PIFOC, PI Physik Instrumente, Karlsruhe, Germany). Signal detection and peripheral hardware were controlled by the Imspector scanning software (18) via data acquisition cards (6259 M, 2090A, National Instruments, Austin, TX).
A polymeric phase plate (RPC Photonics, Rochester, NY) was used to create the STED doughnut and a bandpass filter (593/40, AHF Analysentechnik, Tübingen, Germany) was used to spectrally clean up the STED laser beam. The 2P and STED laser beams were combined using a dichroic mirror (F73-700UV, AHF) before the scanner.
The fluorescence signal was detected in descanned mode and separated from the excitation and STED light by a longpass dichroic (580 DCXRUV, AHF). The detectors were protected from the 2P and STED light by suitable blocking and emission filters (680SP-25, 594S-25, 520-70, Semrock, Rochester, NY). The signal was spectrally divided into two channels by a dichroic mirror (514RS, Semrock) before being focused onto multimode fibers (100-μm core diameter, which corresponds to 120% of the back-projected Airy disk), terminating on avalanche photodiodes (SPCM-AQR-13-FC, PerkinElmer, Waltham, MA).
Microscope alignment
For spatial alignment of the 2P and STED lasers and quality control of the doughnut (Fig. 1 D), a pellicle beam splitter (Thorlabs, Maisons-Laffitte, France) was flipped into the beam path so that the reflection from gold nanospheres could be detected by a photomultiplier tube (MD963, PerkinElmer). A piezo-controlled motorized mirror (AG-M100N, Newport, Beaune la Rolande, France) and a telescope were used to align the doughnut on the excitation spot in all three dimensions. Doughnut quality (shape and null) was optimized via achromatic λ/2 and λ/4 wave plates (Qioptiq, Paris, France). Optical resolution (Fig. 2 D) was assessed using fluorescent nanospheres (Fluo Spheres, yellow-green, diameter = 0.04 μm, Invitrogen).
Figure 1.

Principle and design of a pulsed 2P-STED microscope. (A) Simplified Jablonski diagram of the molecular excitation states in 2P-STED microscopy. The molecule is excited to the excited state (S1) by two-photon absorption and returns from there to the ground state (S0) by the emission of fluorescence. The incidence of STED light quenches the fluorescence and returns the molecule to S0 before fluorescence can occur (curved dashed arrows show internal conversion). (B) Two-photon excitation action cross section and emission spectra for GFP and YFP (Warren Zipfel, Cornell University, Ithaca, NY). Simultaneous quenching of GFP and YFP by a single laser beam of 592 nm is possible because of the highly overlapping tails of the emission spectra. Two-photon excitation is performed at 910 nm. The emission signal is spectrally separated and detected in two channels. (C) Schematic of beam path. The femtosecond pulsed Ti:Sa laser used for 2P excitation is routed through a beam scanner into an upright microscope and synchronized with the STED laser (Ti:Sa/optical parametric oscillator (OPO)). Femtosecond pulses emitted from the Ti:Sa/OPO are broadened by a 20-m-long polarization-preserving single-mode fiber. The doughnut is formed by a helical phase mask. A long-working distance, water-immersion objective is used. It is equipped with a correction ring to correct spherical aberrations due to mismatches in refractive index at the lens-sample interface. λ/2, half-wave plate; λ/4, quarter-wave plate; DC, dichroic mirrors, NA, numerical aperture; Δt, pulse broadening fiber; xy-scan, scanner for x and y dimension; APD, avalanche photodiode; EOM = electro-optical modulator. (D) Reflections of the laser beams from gold particles used for visualization and spatial alignment of the excitation and STED beams. The laser beams are routed through a pellicle beam splitter so that the reflections can be detected by a photomultiplier tube. This allows for the characterization of the excitation and STED beams and illustrates the doughnut-like intensity distribution of the STED laser. Scale bar, 500 nm.
Figure 2.

Fluorescence quenching and spatial resolution in 2P-STED microscopy. (A) Line scans in a fluorescent solution excited by the 2P laser. The signal is quenched by a pulsed STED laser. Desynchronization strongly attenuates this effect. (B) Quantification of the signal intensity along the rectangle indicated in A. Desynchronization greatly reduces quenching efficiency and increases variability. Fluorescence quenching is 80% when the 2P and STED pulses are synchronized and aligned in space and time. (C) 2P-STED requires a precise relative temporal delay of the synchronized laser pulses, which can be used to probe the duration of the STED laser pulse. Quenching efficiency is plotted as a function of the relative delay between the excitation and the STED beam. Fitting the data with a Gaussian error function (red) indicates a STED pulse duration (FWHM) of at least 68.5 ps. (D) 2P and 2P-STED images of fluorescent beads (diameter = 40 nm). A clear resolution enhancement can be observed in 2P-STED relative to 2P excitation. (E) Quantification of the line indicated in D and fitting with a Lorentzian function returns a width of 62 nm for 2P-STED (red) as compared with 368 nm for 2P (black).
Animals and labeling
Two transgenic mouse lines (C57BL/6 background) were used: Thy1eYFP/eYFP mice that express YFP in a subpopulation of principal neurons in the hippocampus as well as in layer 4/5 of cortex, and CX3CR1eGFP/eGFP mice that express GFP in microglial cells (Jackson Labs, Bar Harbor, ME). In experiments where only neurons were imaged, heterozygous Thy1+/eYFP mice were used. In experiments where neurons and microglia were imaged, mice obtained from the crossbreeding of the two mouse lines were used (CX3CR1+/eGFP; Thy1+/eYFP). All experiments were carried out in accordance with the National Code of Ethics on Animal Experimentation (Carte Nationale d’éthique sur l’expérimentation animale; Ministère de l’enseignement et de la recherche, Ministère de l’agriculture et de la pêche) and approved by the Committee of Ethics of Bordeaux (No. 3306001).
Acute brain slices
Animals 21–40 days old were killed by cervical dislocation, and their brains were quickly removed and placed in ice-cold sucrose-based artificial cerebrospinal fluid (ACSF) containing (in mM) 210 sucrose, 10 glucose, 2 KCl, 26 NaHCO3, 1.25 NaH2PO4, 0.1 CaCl2, and 6 MgCl (pH 7.4, osmolarity ∼320 mOsm/L), which was bubbled with carbogen (95% O2/5% CO2). Sagittal 350-μm-thick slices were cut using a vibratome (VT1200, Leica, Mannheim, Germany) and transferred to a heated (32°C) holding chamber with NaCl-based ACSF bubbled with carbogen, which consisted of (in mM) 124 NaCl, 3 KCl, 26 NaHCO3, 1.25 NaH2PO4, 10 glucose, 2 CaCl2, 1 MgCl, and 0.6 Trolox (pH 7.4, osmolarity ∼305 mOsm/L) for 1 h. These slices were subsequently maintained at room temperature for a maximum of 4 h. For the imaging experiments, the slices were transferred to a submerged recording chamber, where they were continuously perfused (2.1 mL/min) with ACSF at room temperature.
Image acquisition and analysis
All images were acquired with a pixel size of 19.5 nm (512 × 512 pixels, 10 μm × 10 μm, except see Fig. 4 B3, which is 1024 × 1024 pixels, 40 μm × 40 μm, with a pixel size of 39 nm) and a pixel dwell time of 30 μs, which corresponds to about 8 s acquisition time for a 10 μm × 10 μm field of view. Imaging depth into the slice was determined by the piezo z-focus, the fluorescence signal on top of the slice defining the zero z-position. Image analysis was done on raw data using ImageJ. Images presented in the figures were filtered by a 1-pixel Gaussian filter to reduce noise. To quantify and compare the line profiles from 2P and 2P-STED images, we used the Lorentzian function:
where y0 and A are constants, xc is the center, and Γ is the width of the curve.
Figure 4.
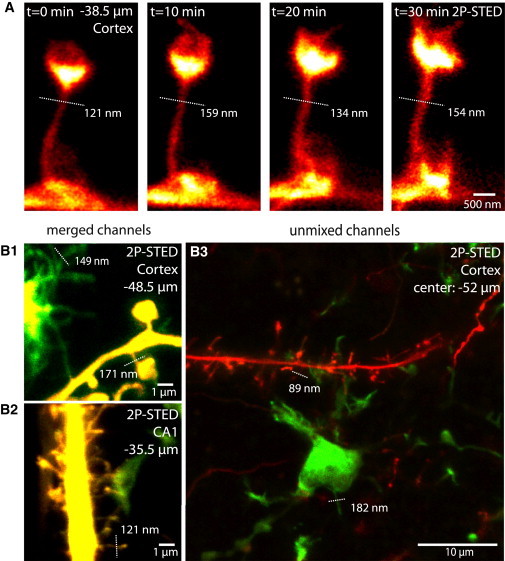
Time-lapse and dual-color 2P-STED imaging. (A) Time-lapse images of a cortical spine acquired at 38.5 μm below the tissue surface. Individual time points are average projections of two frames based on multiple sections (5 frames/stack, four stacks, Δz = 400 nm). (B) Two-color 2P-STED imaging of neurons and microglia. Transgenic mice (CX3CR1+/eGFP; Thy1+/eYFP) express YFP in neurons and GFP in microglia. Superresolved microglial processes (Γ = 149 nm) can be observed (B1), as can a microglial process contacting dendritic spines (B2) and a maximum-intensity projection of a z-stack of images (19 frames, 40 × 40 μm, from −49.5 to −56.5 μm, Δz = 368 nm) in the cortex (B3). The high magnification images (B1 and B2) are merges of both color channels (green (GFP) and yellow (YFP)); the overview image (B3) is linearly unmixed, effectively separating both channels (green (GFP) and red (YFP)). Dotted lines indicate spine neck widths (Γ, Lorentzian fit of raw data).
Two-color images are shown merged with and without linear unmixing using a plugin for ImageJ as described before (12). Unless stated otherwise, single frames from a z-stack (Δz typically 400 nm) are shown.
Statistics
Data are expressed as the mean ± SE. A two-tailed unpaired t-test was used to compare spine neck widths (Γ) measured for 2P and 2P-STED in the CA1, cortex, and for the two groups pooled. Multiple comparisons were post-hoc Bonferroni-corrected. A nonparametric Kolmogorov-Smirnov test was additionally used for groups containing <17 data points, confirming the results of the parametric t-test. Data from 12 mice were included in this study. Tests marked with (∗∗∗) in Fig. 3 C are significant, with p < 10−12.
Figure 3.
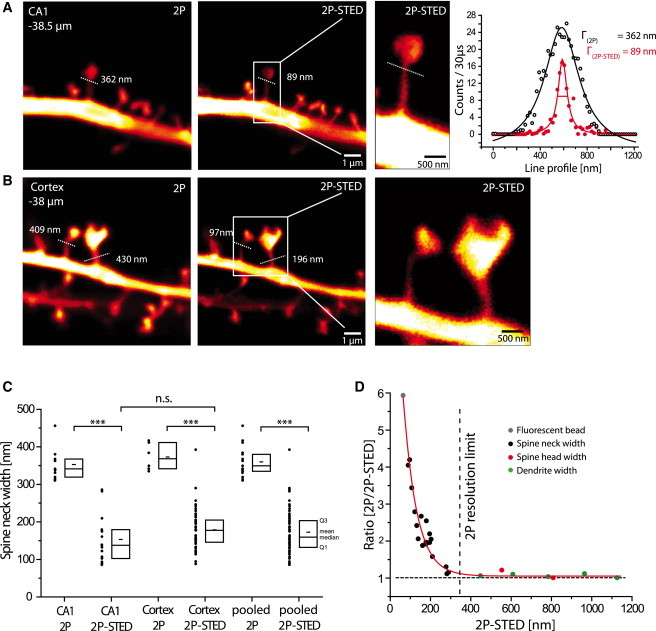
2P-STED microscopy in acute brain slices. (A and B) 2P and 2P-STED images of dendritic spines of YFP-labeled CA1 (A) and cortical (B) pyramidal neurons in acute slices from Thy1-YFP transgenic mice. Spine necks appear much thinner in 2P-STED compared to 2P images. Dotted lines indicate spine neck widths (Lorentzian fit of the line profile of the line indicated). The difference in width between 2P imaging (Γ = 362 nm) and 2P-STED imaging (Γ = 89 nm) demonstrates the resolution enhancement by 2P-STED. (C) Quantification of spine neck widths of CA1 and cortex imaged in 2P and 2P-STED modes. No difference between CA1 and cortex was detected. 2P imaging clearly overestimates spine neck widths when compared to the 2P-STED mode. Boxplot indicate Q1 and Q3 (first and third quartile), median and mean (large and small lines, respectively). (D) Plot of 2P-STED measurements versus the ratio between 2P and 2P-STED of the same object. As expected, the ratio is 1 when the structures are larger than the resolution limit of 2P microscopy (∼350 nm), but it increases steeply when the structures are <350 nm in size.
Results
Construction of the microscope
We built a 2P-STED microscope for two-color subdiffraction imaging in brain slices using a long-working distance, water-immersion objective as outlined in Fig. 1, A–C. For coupling the lasers into the microscope, we first checked the reflection of the 2P and STED light using gold beads (Fig. 1 D). We optimized the symmetry and central minimum of the STED doughnut by adjusting a λ/4 wave plate placed in front of the scanner. The intensity of the STED beam at the doughnut center was <1% of the intensity measured at the rim of the doughnut (Fig. 1 D), which was indistinguishable from background noise.
Performance of the microscope
Because we used pulsed lasers for 2P excitation and the STED effect, the lasers had to be synchronized and their pulses had to arrive at the sample with an optimal delay to achieve efficient quenching of the 2P fluorescence by the STED laser. Indeed, quenching depended on how much of the STED pulse overlaps with the time that the molecules spent in the excited state after 2P excitation. Fig. 2, A and B, illustrates that 80% quenching efficiency in a sea of dye fluorescence (∼1 mM calcein) can be achieved. Conversely, when the synchronization is turned off, the quenching effect is strongly diminished (Fig. 2 B).
Fig. 2 C illustrates the fluorescence quenching efficiency by the STED laser as a function of the relative delay between the laser pulses, where zero refers to the optimal delay. Changing the relative delay between pulses results in a rapid increase of quenching to a maximum of 80% before it decreases again gradually. Whereas the rising phase of the curve should be mostly defined by the duration of the STED pulse, the decay should be defined by the lifetime of the fluorophore (19).
Based on the rising phase (fitting a Gaussian error function), we estimated the duration of the STED pulse to be at least 68.5 ps (full width at half maximum (FWHM)) using a 20-m-long polarization-preserving optical fiber, which is consistent with pulse durations of 200–300 ps reported for 120-m-long optical fibers (20).
To check the performance of the 2P-STED microscope, we imaged subdiffraction-sized fluorescent beads (diameter = 40 nm) and determined the point-spread functions (PSFs) for the 2P and 2P-STED case (Fig. 2 D). The width of the PSF is an important indicator of the spatial resolution of the microscope. Using a Lorentzian function to fit line profiles drawn through the centers of individual beads, we measured a PSF width of 368 nm for the 2P case, which corresponds well to the expected spatial resolution of a diffraction-limited 2P microscope given the wavelength of the 2P light (910 nm) and the NA of the objective (1.1) (21). Imaging the same bead in STED mode, the PSF width was 62 nm, which corresponds to about a sixfold improvement in spatial resolution over the 2P case. The peak photon count at the center of the bead was only slightly (∼10%) reduced (Fig. 2 E), confirming that the STED light intensity in the center of the doughnut is very low.
Subdiffraction imaging of dendritic spines in acute slices
To check whether we could achieve subdiffraction spatial resolution in acute brain slices, we imaged dendritic spines from transgenic mice expressing YFP as a volume label in a subset of hippocampal and cortical neurons. We compared the performance of the 2P-STED with the 2P microscope by imaging spines with or without the STED light. In general, the spine necks appeared substantially wider without the STED light, whereas the appearance of the 2P-STED images was much crisper (Fig. 3 and Fig. S1).
To confirm this impression quantitatively, we measured line profiles across the spine necks and fitted them with a Lorentzian function as above. In the example illustrated in Fig. 3 A (a spine of a hippocampal CA1 pyramidal neuron imaged at a depth of 38.5 μm), the neck appeared to be 362 nm wide in the 2P image but only 89 nm in the 2P-STED image. This fourfold difference demonstrates that the STED approach can be used to achieve a substantial gain in spatial resolution, well below the surface of living brain tissue, using a long-working distance water-immersion objective. It is important to note that the peak signal intensity in 2P-STED mode was only reduced by ∼30% compared with the 2P signal (Fig. 3 A), suggesting that the minimum of the STED doughnut was fairly intact at this imaging depth.
We also imaged spines from layer 4/5 of cortical pyramidal neurons, imaged in the molecular layer of visual and parietal cortices at about the same depth (Fig. 3 B). Similar to spines of hippocampal neurons, the spine necks of cortical neurons appear much thinner in 2P-STED than in 2P images (Γ = 97 nm for 2P-STED vs. Γ = 409 nm for 2P). The differences between 2P and 2P-STED imaging were clear-cut and highly significant (p < 0.0001, Fig. 3 C). We did not detect any significant differences in width between spine necks in hippocampus and cortex, irrespective of whether 2P or 2P-STED was used (Γ2P CA1 = 352 ± 12 nm, n = 11; Γ2P-STED CA1 = 153 ± 17 nm, n = 15; Γ2P Cortex = 372 ± 15, n = 6; Γ2P-STED Cortex = 178 ± 8 nm, n = 49) (Fig. 3 C).
Taken together, 2P-STED yields substantially better resolved images of dendritic spines compared to 2P microscopy, well below the surface of acute brain slices. To illustrate the gain in resolution quantitatively, we plotted the ratio of 2P to 2P-STED measurements as a function of the widths of assorted structures measured by 2P-STED (Fig. 3 D). This ratio equals 1 for structures larger than the 2P diffraction limit, but increases sharply for structures below it.
Time-lapse imaging
Next, we addressed the potential issue of phototoxicity and bleaching during 2P-STED imaging. To this end, we repeatedly (20 times) imaged the same stretch of dendrite for 30 min (Δt = 10 min) and looked for signs of photodamage such as blebbing. Our experiments demonstrate that it is possible to repeatedly acquire superresolved images with our 2P-STED microscope without obvious photodamage (Fig. 4 A). However, to avoid or reduce deleterious effects, which are a general concern in fluorescence microscopy, it was important to optimize the imaging parameters (e.g., laser powers, pixel dwell times, image sizes, etc.), which are linked to several factors, including slice quality, sample brightness, and imaging depth.
Two-color imaging
Finally, we performed two-color 2P-STED imaging using an approach we recently developed for STED microscopy, which is based on a single laser pair for fluorescence excitation and STED quenching (12). To this end, we modified the microscope by adding a dichroic mirror and a second detection channel for spectral detection. To illustrate the potential of using these techniques in combination, we imaged brain slices from transgenic mice in which neurons and microglia are fluorescently labeled with YFP and GFP, respectively. The images in Fig. 4 B demonstrate the ability of the new approach to acquire superresolved images of volume-labeled dendritic spines and microglial processes well below the surface of acute brain slices. Although spectral detection already provides for reasonable color contrast (Fig. 4, B1 and B2), linear unmixing of the fluorescence channels can improve color separation substantially (Fig. 4 B3).
Discussion
We present a novel kind of microscope for two-color superresolution imaging of neural morphology well below the surface of acute brain slices using YFP and GFP as volume labels. It is based on 2P excitation and pulsed STED microscopy and hence reconciles many powerful features, such as subdiffraction spatial resolution, two-color imaging, optical sectioning, depth penetration, the use of living samples, and the possibility of combining it with electrophysiological approaches.
We employed a long-working distance water-immersion objective with an NA of 1.1, which is relatively low compared to the glycerol- and oil-immersion objectives (1.3 and 1.4, respectively) generally used in STED microscopy (9,14,15,22). Using spine necks to estimate our resolution, the spatial resolution at an imaging depth of ∼40–50 μm is likely to be around 60-70 nm, considering that spine necks are finite in size (>50 nm, as indicated by electron microscopy (23)) and thus do not mimic point sources of light.
STED microscopy, which was initially used in neurobiology to acquire superresolved images of protein distributions inside cells by immunohistochemistry (14,24), has recently been extended to live-cell imaging of dendritic spine morphology (9,16), greatly facilitating investigation of the structure and function of synapses, which is a major research topic in neuroscience.
Most previous studies have used high-NA oil or glycerol objectives with short working distances, which is incompatible with acute brain slices, because this preparation requires water-immersion objectives with long working distances and an upright microscope design. Acute brain slices are the preparation of choice for most synaptic physiologists because of the experimental access they provide for pharmacological and electrophysiological experiments.
Initially, STED microscopy was based on a confocal design and single-photon excitation, but recently the use of 2P excitation has been reported. The first two studies demonstrated the principle of 2P-STED using CW lasers for the STED beam (16,17), which are easier to implement than pulsed lasers. However, as the CW laser is much less efficient at quenching fluorescence than the pulsed laser, much more laser power (>10-fold) is needed to achieve a comparable gain in spatial resolution, which is usually prohibitive for living tissue. As a consequence, 2P-STED microscopy in living tissue has been limited to >250 nm in spatial resolution. Subsequent studies have used pulsed STED lasers in conjunction with 2P excitation (25,26), but those studies used inverted microscopes with oil objectives on fixed samples.
Here, we demonstrate 2P-STED time-lapse imaging in two colors in acute brain slices with a four- to sixfold improvement in spatial resolution over the 2P case. The STED laser intensities required to achieve the gain in resolution were substantially less than those reported previously (16,26), which is important for reducing phototoxicity and bleaching.
We speculate that the quality of the doughnut, which featured a very low minimum at its center, and the efficiency of quenching GFP and YFP with short laser pulses afforded the use of relatively modest STED laser powers.
Illustrating the potential of the new 2P-STED approach, we imaged dendritic spines in acute brain slices and measured superresolved spine necks at a few tens of microns below the tissue surface. The spine-neck widths of pyramidal neurons in the CA1 region of the hippocampus and cortex correspond well to those reported by electron microscopy (23,27), in our previous work (9), and by other recent superresolution approaches (28,29), and they are much thinner than is indicated by confocal measurements. For this reason, spine necks are thought to represent a diffusion barrier for signaling molecules, allowing for biophysical compartmentalization of synapses (15,30–33). Moreover, the sizes of the microglial processes we have observed are comparable with those of STED images in perfusion-fixed brain-tissue sections (data not shown).
Interestingly, the ability to measure the level of STED quenching as a function of the delay between the laser pulses provides a straightforward way to estimate the duration of the STED laser pulse, which otherwise requires special equipment. Likewise, fluorescence quenching by the STED laser can also be used to estimate the fluorescence lifetime of the fluorophores, as suggested previously (19), which is normally done using time-correlated single-photon counting instrumentation (34).
In summary, we have developed a new 2P-STED microscope that can be assembled using all commercial components and demonstrated its potential for investigating synapses and glial cells with unprecedented spatial resolution in acute brain slices using genetically encoded fluorophores.
Acknowledgments
This work was supported by a Ph.D. fellowship from the 7th Framework Program (FP7) Marie Curie ITN SyMBaD to P.B. (cosupervised by G.M. and U.V.N.), and grants from the Regional Council of Aquitaine (CRA), Inserm, the French National Research Agency (ANR), and the Human Frontier Science Program, to U.V.N.
We thank S. Berning for discussions on the design of the microscope and S. W. Hell for providing optomechanical components (both affiliated with the Max Planck Institute for Biophysical Chemistry, Göttingen, Germany). We thank members of the lab (M.O. Lenz, A. Panatier, and J. Tonnesen) and L. S. Wijetunge (University of Edinburgh, Edinburgh, Scotland) for discussions and comments on the manuscript and J. Angibaud for technical support.
Footnotes
This is an Open Access article distributed under the terms of the Creative Commons-Attribution Noncommercial License (http://creativecommons.org/licenses/by-nc/2.0/), which permits unrestricted noncommercial use, distribution, and reproduction in any medium, provided the original work is properly cited.
Supporting Material
References
- 1.Ramón y Cajal S. Oxford University Press; New York: 1995. Histology of the nervous system of man and vertebrates. [Google Scholar]
- 2.Holtmaat A., Svoboda K. Experience-dependent structural synaptic plasticity in the mammalian brain. Nat. Rev. Neurosci. 2009;10:647–658. doi: 10.1038/nrn2699. [DOI] [PubMed] [Google Scholar]
- 3.Araque A., Carmignoto G., Haydon P.G. Dynamic signaling between astrocytes and neurons. Annu. Rev. Physiol. 2001;63:795–813. doi: 10.1146/annurev.physiol.63.1.795. [DOI] [PubMed] [Google Scholar]
- 4.Tremblay M.E., Stevens B., Nimmerjahn A. The role of microglia in the healthy brain. J. Neurosci. 2011;31:16064–16069. doi: 10.1523/JNEUROSCI.4158-11.2011. [DOI] [PMC free article] [PubMed] [Google Scholar]
- 5.Hell S.W. Far-field optical nanoscopy. Science. 2007;316:1153–1158. doi: 10.1126/science.1137395. [DOI] [PubMed] [Google Scholar]
- 6.Hell S.W., Wichmann J. Breaking the diffraction resolution limit by stimulated emission: stimulated-emission-depletion fluorescence microscopy. Opt. Lett. 1994;19:780–782. doi: 10.1364/ol.19.000780. [DOI] [PubMed] [Google Scholar]
- 7.Klar T.A., Jakobs S., Hell S.W. Fluorescence microscopy with diffraction resolution barrier broken by stimulated emission. Proc. Natl. Acad. Sci. USA. 2000;97:8206–8210. doi: 10.1073/pnas.97.15.8206. [DOI] [PMC free article] [PubMed] [Google Scholar]
- 8.Westphal V., Rizzoli S.O., Hell S.W. Video-rate far-field optical nanoscopy dissects synaptic vesicle movement. Science. 2008;320:246–249. doi: 10.1126/science.1154228. [DOI] [PubMed] [Google Scholar]
- 9.Nägerl U.V., Willig K.I., Bonhoeffer T. Live-cell imaging of dendritic spines by STED microscopy. Proc. Natl. Acad. Sci. USA. 2008;105:18982–18987. doi: 10.1073/pnas.0810028105. [DOI] [PMC free article] [PubMed] [Google Scholar]
- 10.Bückers J., Wildanger D., Hell S.W. Simultaneous multi-lifetime multi-color STED imaging for colocalization analyses. Opt. Express. 2011;19:3130–3143. doi: 10.1364/OE.19.003130. [DOI] [PubMed] [Google Scholar]
- 11.Pellett P.A., Sun X., Bewersdorf J. Two-color STED microscopy in living cells. Biomed. Opt. Express. 2011;2:2364–2371. doi: 10.1364/BOE.2.002364. [DOI] [PMC free article] [PubMed] [Google Scholar]
- 12.Tønnesen J., Nadrigny F., Nägerl U.V. Two-color STED microscopy of living synapses using a single laser-beam pair. Biophys. J. 2011;101:2545–2552. doi: 10.1016/j.bpj.2011.10.011. [DOI] [PMC free article] [PubMed] [Google Scholar]
- 13.Willig K.I., Stiel A.C., Hell S.W. Dual-label STED nanoscopy of living cells using photochromism. Nano Lett. 2011;11:3970–3973. doi: 10.1021/nl202290w. [DOI] [PubMed] [Google Scholar]
- 14.Willig K.I., Rizzoli S.O., Hell S.W. STED microscopy reveals that synaptotagmin remains clustered after synaptic vesicle exocytosis. Nature. 2006;440:935–939. doi: 10.1038/nature04592. [DOI] [PubMed] [Google Scholar]
- 15.Urban N.T., Willig K.I., Nägerl U.V. STED nanoscopy of actin dynamics in synapses deep inside living brain slices. Biophys. J. 2011;101:1277–1284. doi: 10.1016/j.bpj.2011.07.027. [DOI] [PMC free article] [PubMed] [Google Scholar]
- 16.Ding J.B., Takasaki K.T., Sabatini B.L. Supraresolution imaging in brain slices using stimulated-emission depletion two-photon laser scanning microscopy. Neuron. 2009;63:429–437. doi: 10.1016/j.neuron.2009.07.011. [DOI] [PMC free article] [PubMed] [Google Scholar]
- 17.Moneron G., Hell S.W. Two-photon excitation STED microscopy. Opt. Express. 2009;17:14567–14573. doi: 10.1364/oe.17.014567. [DOI] [PubMed] [Google Scholar]
- 18.Imspector. www.max-planck-innovation.de/de/industrie/technologieangebote/software/.
- 19.Schrader M., Meinecke F., Hell S.W. Monitoring the excited state of a fluorophore in a microscope by stimulated emission. Bioimaging. 1995;3:147–153. [Google Scholar]
- 20.Eggeling C., Ringemann C., Hell S.W. Direct observation of the nanoscale dynamics of membrane lipids in a living cell. Nature. 2009;457:1159–1162. doi: 10.1038/nature07596. [DOI] [PubMed] [Google Scholar]
- 21.Zipfel W.R., Williams R.M., Webb W.W. Nonlinear magic: multiphoton microscopy in the biosciences. Nat. Biotechnol. 2003;21:1369–1377. doi: 10.1038/nbt899. [DOI] [PubMed] [Google Scholar]
- 22.Berning S., Willig K.I., Hell S.W. Nanoscopy in a living mouse brain. Science. 2012;335:551. doi: 10.1126/science.1215369. [DOI] [PubMed] [Google Scholar]
- 23.Harris K.M., Jensen F.E., Tsao B. Three-dimensional structure of dendritic spines and synapses in rat hippocampus (CA1) at postnatal day 15 and adult ages: implications for the maturation of synaptic physiology and long-term potentiation. J. Neurosci. 1992;12:2685–2705. doi: 10.1523/JNEUROSCI.12-07-02685.1992. [DOI] [PMC free article] [PubMed] [Google Scholar]
- 24.Sieber J.J., Willig K.I., Lang T. Anatomy and dynamics of a supramolecular membrane protein cluster. Science. 2007;317:1072–1076. doi: 10.1126/science.1141727. [DOI] [PubMed] [Google Scholar]
- 25.Li Q., Wu S.S., Chou K.C. Subdiffraction-limit two-photon fluorescence microscopy for GFP-tagged cell imaging. Biophys. J. 2009;97:3224–3228. doi: 10.1016/j.bpj.2009.09.038. [DOI] [PMC free article] [PubMed] [Google Scholar]
- 26.Bianchini P., Harke B., Diaspro A. Single-wavelength two-photon excitation-stimulated emission depletion (SW2PE-STED) superresolution imaging. Proc. Natl. Acad. Sci. USA. 2012;109:6390–6393. doi: 10.1073/pnas.1119129109. [DOI] [PMC free article] [PubMed] [Google Scholar]
- 27.Arellano J.I., Benavides-Piccione R., Yuste R. Ultrastructure of dendritic spines: correlation between synaptic and spine morphologies. Front Neurosci. 2007;1:131–143. doi: 10.3389/neuro.01.1.1.010.2007. [DOI] [PMC free article] [PubMed] [Google Scholar]
- 28.Testa I., Urban N.T., Hell S.W. Nanoscopy of living brain slices with low light levels. Neuron. 2012;75:992–1000. doi: 10.1016/j.neuron.2012.07.028. [DOI] [PubMed] [Google Scholar]
- 29.Izeddin I., Specht C.G., Dahan M. Super-resolution dynamic imaging of dendritic spines using a low-affinity photoconvertible actin probe. PLoS ONE. 2011;6:e15611. doi: 10.1371/journal.pone.0015611. [DOI] [PMC free article] [PubMed] [Google Scholar]
- 30.Svoboda K., Tank D.W., Denk W. Direct measurement of coupling between dendritic spines and shafts. Science. 1996;272:716–719. doi: 10.1126/science.272.5262.716. [DOI] [PubMed] [Google Scholar]
- 31.Grunditz A., Holbro N., Oertner T.G. Spine neck plasticity controls postsynaptic calcium signals through electrical compartmentalization. J. Neurosci. 2008;28:13457–13466. doi: 10.1523/JNEUROSCI.2702-08.2008. [DOI] [PMC free article] [PubMed] [Google Scholar]
- 32.Bloodgood B.L., Sabatini B.L. Neuronal activity regulates diffusion across the neck of dendritic spines. Science. 2005;310:866–869. doi: 10.1126/science.1114816. [DOI] [PubMed] [Google Scholar]
- 33.Araya R., Jiang J., Yuste R. The spine neck filters membrane potentials. Proc. Natl. Acad. Sci. USA. 2006;103:17961–17966. doi: 10.1073/pnas.0608755103. [DOI] [PMC free article] [PubMed] [Google Scholar]
- 34.Lakowicz J.R. Springer; New York: 2006. Principles of Fluorescence Spectroscopy. [Google Scholar]
Associated Data
This section collects any data citations, data availability statements, or supplementary materials included in this article.