Abstract
Transcription-induced chimaeric transcripts, the potential post-transcriptional processing products, might reflect the spatial proximity of actively transcribed genes co-localized in transcription factories. A growing number of expression data deposited in databases provide us with the raw material for screening such chimaeric transcripts and using them as the probes to identify interactions between genes in cis or in trans. Based on the high-quality chimaeric transcripts gleaned from human expression sequence tag data with selection criteria, we identified the patterns of inter- and intrachromosomal gene–gene interactions. On top the contact pattern from interchromosomal interactions, we also observed an exponential behaviour of the intrachromosomal interactions within a certain length scale, which is consistent with the independent experimental results from Hi-C screening and with the Random Loop Model. A compatible result is found for mouse. Transcription-induced chimaeric transcripts, most of which might be accidental products with trivial functions, shed light on the spatial organization of chromosomes. These inter- and intrachromosomal interactions might contribute to the compaction of chromosomes, their segregation and formation of the chromosome territories, and their spatial distribution within the nucleus.
Keywords: chimaeric expression sequence tag (EST), transcription factory, inter- and intrachromosomal interaction, chromatin, chromatin loop
1. Introduction
Transcription-induced chimerism (TIC)1 gives rise to chimaeric transcripts consisting of heterogeneous sequence segments originating from distant regions on the same chromosome or from two or more distinct chromosomes. Chimaeric transcripts from large-scale transcription databases were previously considered as contaminants. However, the increasing number of chimaeric transcripts has indeed been verified in vivo.2 Thus, there is good reason to take chimaeric transcripts seriously. Trans-splicing-mediated chimaeric transcripts have been widely observed in a variety of organisms. Trans-splicing is more frequently observed in lower unicellular eukaryotes and Caenorhabditis elegans and shows physiological significances.3,4 One of the most prominent examples involves Ciona intestinalis, in which the number of non-trans-spliced and trans-spliced genes is approximately equivalent.5 In Drosophila and mammalian cells, however, trans-splicing is less common, and the functional importance of most trans-spliced products is unclear.6,7 Later, Li et al. proposed a transcriptional-slippage model in light of short homologous sequences (SHSs) at junction sites in between fusion sequences.8
Although most chimaera from higher eukaryotes are non-functional, those potentially encoded fusion genes could exert negative effects by competing with their parental genes,9 or serving as an oncogenic transcription factor via mistargeting on the chromosome, and altering chromatin structure.10 It is assumed that chimaeric transcripts expressed in normal and transformed cell might be mediated by two distinct mechanisms (transcription induced or chromosomal translocation induced),11 either of which might involve physical proximity between gene loci. It is reasonable to assume that because different sequence modules of transcription-induced chimaeric transcripts need to be conjugated, their expression should be concomitant, and that distinct pre-RNA products should be confined in a specific cell subcompartment with close three-dimensional (3D) proximity. The candidate of such structure might be the transcription factory.12 The fact that fewer transcription factories exist than the number of expressed genes indicates that multiple actively expressed genes need to share the same transcriptional machinery and that genes separated by a long genomic distance can migrate to each other closely.13 Thus, spatial proximity of distinct transcripts in the transcription factories might facilitate the production of chimaeric transcripts that in turn can be used as the signal of chromosome loci contact.
Various polymer models have been postulated to describe the folding of compact but flexible chromatin fibre, which is crucial to gene expression activity.14 Among these models, the fractal globule model15 proposes that chromatin is folded initially into crumples and repeatedly into crumples-of-crumples. Some experimental support for this model comes from the in vivo screening on the chromatin contact with the Hi-C method developed by Lieberman-Aiden et al.16 An alternative view comes from studies,17–19 where a chromosome is viewed as an all scales-looped polymer.
From the evidence presently available, a fusion process of heterogeneous transcripts is closely related to the spatial proximity of actively transcribed genes. In 2007, Unneberg et al. published the mapping results of transcription-induced interchromosomal interactions using the chimaeric expression sequence tag (EST) as the probe.20 After that, the increased number of data deposited in the databases has made possible a comprehensive study of chimaera and its relation to the 3D organization of chromosomes. Here, with chimaeric transcripts gleaned from human and mouse EST databases, we test the idea of TIC in terms of gene pairs' co-expression pattern. Comparing with normalized Hi-C contact maps21 also confirms that these chimaeric genes are more likely to be physically proximal. Unlike the previous study result,20 we show that the arrangement of chromosomes within the cell nucleus is non-random. No evident changes, however, can be observed from the interchromosomal interaction patterns of normal and the tumour cells. Based on the gene pairs located at every single chromosome, we obtain the relationship between the genomic distance and the gene contact frequencies. A functional behaviour ( , where
  is the probability of contact between two loci that are genomically separated by x base pairs) is observed from our data with the genomic distance ranging from 500 to 7–8 Mb and an exponent α = −1 on a double logarithmic plot that agrees with the experimental results from Hi-C screening.16
2. Materials and methods
2.1. Chimaeric transcripts identification
mRNA data were gathered from gbEST, gbHTC, and gbPRI divisions of the National Center for Biotechnology Information (NCBI) Genbank database (Release 186). Genome sequences of human and mouse were downloaded from NCBI Genome database (Release 37). EST library annotation was obtained from NCBI ftp as well. Gene annotation was downloaded from Ensembl genome database (Version 64).
We used BLAT22 for sequence alignment, with the minimal identity threshold of 95% and the rest of the parameters at their default values. After aligning, alignments in each query were sorted according to the score and then the identity.
Similar to previous studies,8,20 we picked out the queries with top two ranked alignments having the sequences identity not ˂95% and minimal alignment length not ˂50 bp for gbEST sequences. For much longer gbHTC and gbPRI sequences, a threshold of 100 bp was used. A 10 bp overlapping at the binding site of the query was allowed because of the uncertainty in aligning. To make sure that the two best alignments in a query were unambiguously aligned, a uniqueness criterion was imposed.20 Chimaeric transcripts with their boundary sites containing recognition sequences of the restriction enzymes used for library construction were removed. Similar to a previous study,8 SHSs on the boundary sites of these retained transcripts were checked.
2.2. Gene mapping
We mapped the fusion sequences onto the chromosomes according to the Ensembl Genome database and selected transcripts whose partners were both mapped onto the gene regions with the same directions as the annotation. For sequences with both partners mapped with the opposite directions of the corresponding genes, we re-evaluated their directions according to the GT/AG rule. Considering the possibility of tandem transcription or intergenic splicing, we removed the chimaeric transcripts in cis with genomic distance between gene loci smaller than 500 kb.
2.3. Co-expression pattern of the chimaeric gene partners
Co-expression pattern of human and mouse genes was obtained from COXPRESdb (Version 4.1),23 in which genes were indexed by their Entrez Gene IDs, and the Mutual Rank (MR) score was used as a measure for gene co-expression correlation. R package ‘biomaRt’ (Version 2.10.0) was used to convert the Ensembl Gene IDs of those mapped genes to the Entrez Gene IDs. To check whether the co-expression correlation of gene pairs in the chimaeric transcripts is non-preferential, MR scores of all possible gene pairs were used as a background.
2.4. Comparison with normalized Hi-C contact pattern
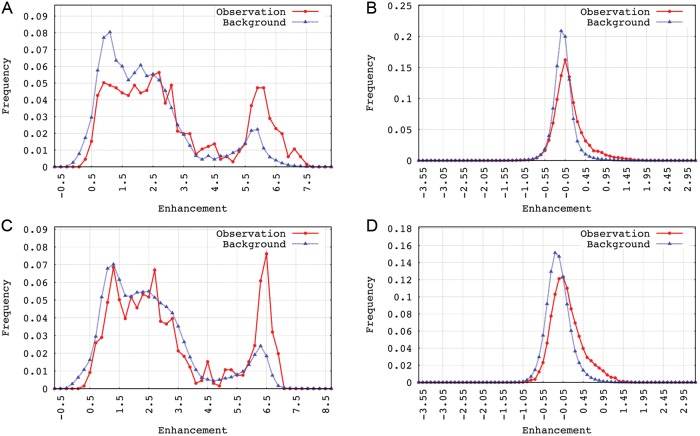
We used normalized Hi-C contact pattern of human lymphoblast generated by Yaffe et al.21 The ratio of the observed to the expected contact number in each 1 Mb bin was transferred by the logarithm to base 2 as a measurement of contact enhancement. The larger the enhancement value for a bin pair is, the more the contacts between them can be observed than by chance. Consequently, an enhanced contact probability indicates a closer spatial relationship. Gene pairs of the chimaeric transcripts were mapped onto the corresponding bins of the chromosomes, and the enhancement was screened. For genes spanning over more than one bin, the contact enhancement was calculated by averaging weighted contact enhancement for each 1 Mb bin pair covered. The enhancement distributions of all possible inter- and intracontacts were used as backgrounds. The Kolmogorov–Smirnov test was applied to check the difference of the contact enhancement between chimaeric gene pairs and the background.
2.5. Inter- and intrachromosomal interactions pattern analysis
Chimaeric transcripts extracted from the gbEST database were used for interaction pattern analysis. Chimaeras involving the same gene partners were grouped together so as to remove the overcounts. We picked out transcripts composed of two genes labelled by ‘protein coding’ biotype in the human Ensembl database, which were far more abundant than others, as the observed interchromosomal interaction pattern. We collected the frequencies of contact between two given chromosomes to obtain the interaction matrix and plotted the data as a heat map. From the human Ensembl database, we obtained the frequencies of protein coding genes on 23 chromosomes except chromosome Y. With these expected gene frequencies, we constructed a random matrix of chromosome pair-wise interaction by multiplying the gene frequencies from any two given chromosomes. For this symmetric matrix, each element in the upper half of the matrix was multiplied by a random number, and the corresponding element in the lower half was assigned the same value. This finished a shuffle step on the interaction pattern, and the eigenvalue of the matrix was calculated. Totally, 105 steps were carried out. After that, the mean eigenvalue was obtained and plotted against the eigenvalue from the observation. Furthermore, based on the cell source annotation from the human EST library report, we separated the interactions from normal cells from those from tumour cells and plotted the eigenvalue of interaction for comparison.
For intrachromosomal interactions, we made statistics on the frequencies of the gene–gene interaction under given genomic distance within every chromosome and plotted the frequencies of the interactions versus the genomic distance in a double logarithmic plot. For human, the contact probabilities were divided by their corresponding genomic distance for normalization and replotted against the genomic distance.
3. Results and discussion
3.1. Chimaeric transcripts validation and genome mapping
The number of chimaera selected from gbEST, gbPRI, and gbHTC databases is given in Table 1. Detailed information about the validated chimaeric transcripts can be found in the Supplementary Data. We analysed the distribution of human chimaeric transcripts among the EST libraries. Of 8995 human libraries screened, 2617 (29%) were involved in the production of chimaera, and none of them overlapped with those highly contaminated libraries.24 As shown in Fig. 1A, most libraries contributed very few chimaera. One thousand one hundred and eleven and 518 libraries from a total of 2617 human libraries provided only one and two chimaera, respectively. A compatible result is found for mouse (Fig. 1B). Such a result indicates that chimaera formation is an ubiquitous event with low frequency.
Table 1.
Summary of the chimaeric transcripts identified from different databases
| Source | GG |
UG |
Genes |
Size | Overlap | |||
|---|---|---|---|---|---|---|---|---|
| Human gbEST | 11 262 | 773 | 8261 | 673 | 7871 | 1165 | 518 | |
| Human gbHTC | 282 | 31 | 266 | 29 | 508 | 58 | 2634 | 51 |
| Human gbPRI | 1094 | 163 | 657 | 109 | 1141 | 208 | 15 079 | 72 |
| Mouse gbEST | 2493 | 269 | 2230 | 223 | 3316 | 426 | 582 | |
| Mouse gbHTC | 328 | 32 | 322 | 27 | 599 | 54 | 1846 | 71 |
The GG column represents the number of chimaeric transcripts whose partners were both mapped onto the gene regions with the same directions as the annotation. The UG column indicates the unique gene pairs identified from chimaeric transcripts of gene–gene interaction. The genes column corresponds to the number of genes participating in the chimaera production. Under GG, UG, and genes columns, left subcolumns indicate the number for interchromosomal interaction and the right ones denote intrachromosomal interaction. The size column shows the average length (unit in base pairs) of validated inter- and intrachromosomal chimaeric transcripts. And, the overlap column indicates the number of chimaeric gene pairs identified from the gbHTC or gbPRI database, which can also be found at the gbEST database.
Figure 1.
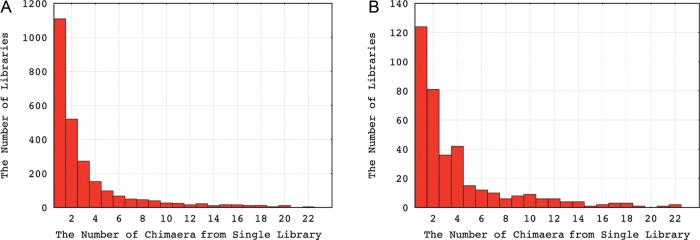
The distribution of human and mouse EST libraries according to the number of chimaera they produced. (A) for human and (B) for mouse. The x-axis represents the number of chimaera that can be identified from single library. The y-axis indicates the number of libraries producing the corresponding amount of chimaeric ESTs.
From validated chimaera, most gene interactions were observed only once, whereas some gene partners associated with each other more frequently. In addition, some of these reoccurring chimaera can be identified from multiple different EST libraries, whereas other repeats originated only from a single library. Detailed mapping results are shown in Table 1. The abundance of SHSs with different size is shown in Supplementary Fig. S1.
3.2. Co-expression pattern of the chimaeric gene partners
Of the total of 8934 validated human chimaeric transcripts, 7412 gene partners with both genes Entrez Gene IDs known were collected. For mouse, 2229 gene pairs were obtained from 2453 chimaeras. As shown in Fig. 2, gene pairs from the chimaeric transcripts associated more frequently with small MR score than with a large one, when compared with the co-expression pattern of all possible gene pairs. This observation revealed that gene pairs producing chimaeric transcripts showed stronger positive correlation in terms of their expression activities. This observation further supported the assumption that lots of identified chimaeric transcripts, if not all were transcription induced.2
Figure 2.
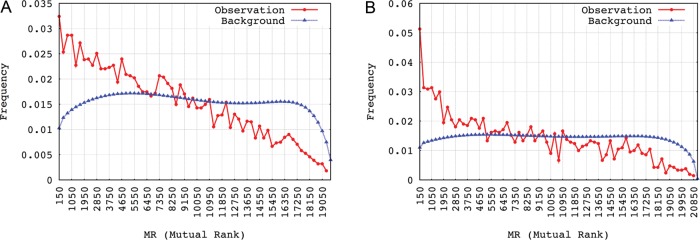
Co-expression pattern of genes from the chimaeric transcripts. (A) for human and (B) for mouse. The smaller the MR score is, the higher is the correlation between gene pairs' expression.
3.3. Comparison with normalized Hi-C contact pattern
From the enhancement distributions shown in Fig. 3, both for inter- and intrachromosomal chimaeric transcripts, a shift towards larger enhancement can be seen with either kind of restriction enzyme. For intrachromosomal contacts, a large enhancement can be see for the tail, i.e. for gene pairs that are several mega base far away. Although the occurrence of long-range interactions is relatively low, their contact probabilities are much higher than expectation, which suggests a closer spatial distance between genome regions involved. From the cumulative distribution function (CDF) curves shown in Supplementary Fig. S2, one can clearly see that the CDF of observation lies below that of background, which indicates that a higher contact probability between chimaeric genes is given over that of the random case.
Figure 3.
Comparison with normalized Hi-C contact pattern. Patterns (A) and (B) were extracted from the contact map restricted by the enzyme HindIII, (A) for intra- and (B) for interchromosomal contact; Patterns (C) and (D) with restriction enzyme NcoI, (C) for intra- and (D) for interchromosomal contact.
3.4. Interchromosomal interaction pattern
We picked out the unique ‘protein coding’ cases of interchromosomal gene interactions (for human, 6999 out of 8261 transcripts) and plotted these as a heat map (Fig. 4A), according to where the chromosomes' gene partner was localized. As illustrated by the ‘protein coding’ gene frequencies on human chromosomes (as shown in Fig. 4B), the interactions between chromosomes with higher gene content show a correlation as well. Because the expression data were collected from a variety of cells with different types and developmental stages, it cannot easily be determined whether or not there is a preference on the interaction of given chromosome pairs. But, what is evident is that the observed pattern is different from the pattern achieved from random interaction. This comparison can mathematically be done by comparing the eigenvalues of the heat maps viewed as matrices (Fig. 5A).
Figure 4.
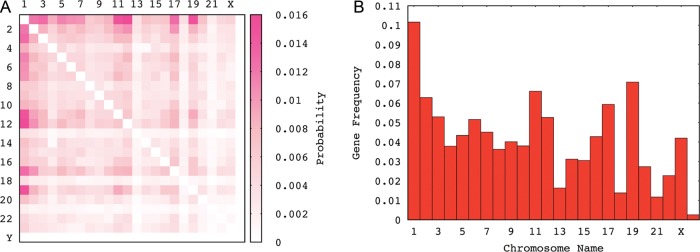
Interchromosomal interaction pattern for human chromosomes. (A) Contacts as a heat map of human interchromosomal gene interactions. Protein-coding genes were used as a measure of interactions. The density of the pink colour in each square of the heat map is proportional to the frequencies of chimaera composed of gene partners derived from two given chromosomes and (B) Protein-coding gene content of human 24 chromosomes.
Figure 5.
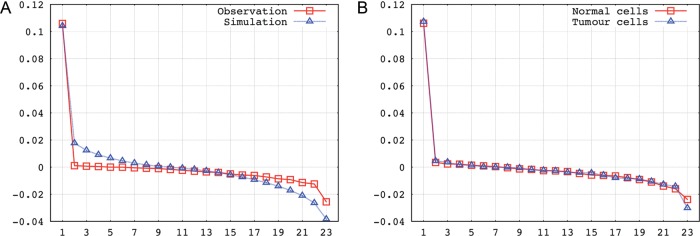
Comparison of interchromosomal interaction patterns via eigenvalue. (A) Patterns from human EST chimaeric transcripts and random distribution simulation (excluding the chromosome Y). The correlation coefficient between the eigenvalues of the observed and the simulated contact matrices is calculated as −0.543. A 95% confidence interval for the eigenvalues based on the simulation pattern was calculated, which however is too small to be shown. None of the eigenvalues from the observed pattern fell into the corresponding confidence interval. (B) Patterns from human normal cells and tumour cells (excluding the chromosome Y).
Furthermore, we separated the chimaera according to the cell sources from which they originate (normal or tumour cell lines). Then, we constructed the interaction matrix and tried to compare the patterns from normal and tumour cell lines. For both cases, we acquired ∼3500 chimaera. A slight difference is observed for normal and tumour cells, but the correlation coefficient between the eigenvalues of two contact matrices is computed as 0.998, which indicates that two contact patterns are by and large the same (Fig. 5B). Especially to the chromosomal translocation-mediated fusion transcripts in tumour cells, the ‘contact-first’ model and the ‘breakage-first’ model have been postulated.25 Under either scenario, a spatial proximity effect is obvious.25 Consequently, both chromosomal translocation-mediated and transcription-mediated fusion transcripts can be used to indicate the physical proximities between genes. Through a literature curation, we found that two gene pairs (RGS17/TBL1XR1 and BCAS3/BCAS4) identified from the human ESTs libraries have been verified to be spatially proximate by fluorescence in situ hybridization experiments.26,27 Chimaeric transcripts involved are listed in the Supplementary Data.
3.5. Intrachromosomal interaction pattern
For the intrachromosomal gene loci interaction data, we calculated the frequencies of gene–gene interactions for given genomic distances. The genomic distances between gene partners ranged from 509 Kb to 244.4 Mb. We plotted the probability of contact versus the genomic distance between gene partners on a double logarithmic plot. Two different types of behaviour can be observed. Below the distance of 7–8 Mb, a functional  exists with an exponent α = −1 (see the double logarithmic plot shown in Fig. 6). Above this distance, a quite different pattern is observed. The rapid drop for large genomic distances might result from the limitation of interaction data when the genomic distance is increased. To our surprise, a comparable pattern was observed for mouse as well, even though its EST coverage is not as high as that of human. With caution, we speculate that a general strategy for chromatin compaction might be utilized in mammalian cells. On account of the difference in the contact probability of chromatin with different length, we normalized the contact frequencies by the genomic distance and replotted the pattern of human. After normalization, as shown in Supplementary Fig. S3, under relative short genomic distance, the contact probability remains stable. When the genomic distance is increased, the contact probability rises until a plateau is reached. The dropping at the end might be due to the data depletion.
Figure 6.
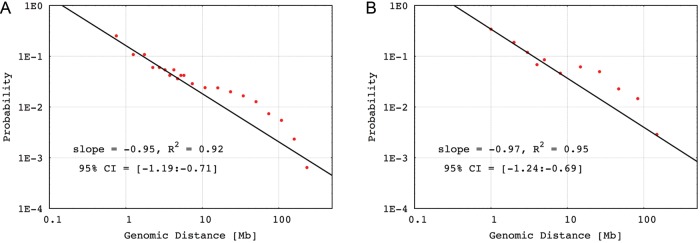
Fit of intrachromosomal interactions from human and mouse. Intrachromosomal gene pairs with genomic distance larger than 500 kb were considered. (A) Interaction patterns of human and (B) Interaction patterns of mouse. Confidence intervals(95%) of the slopes are shown.
3.6. Discussion
From the human and mouse EST databases, we identified chimaeric transcripts with verification. Based on what we currently know about TIC and transcription factories, ‘genuine’ chimaera of this kind, functional or not, might originate from product interactions while being transcribed. A further analysis on the co-expression pattern of gene pairs in the examined chimaeric products revealed a strong correlation in their expression. To make the expression of chimaeric gene partners synchronous, two gene loci might be recruited to the same transcription factory, which, in turn, would decrease their spatial distance and increase the possibility of their aberrant ligation. This observation further supports the assumption of TIC1 and the role of the transcription factories in gene transcription events,12,13 as well.
Some chimaeric gene pairs in cis or in trans have been experimentally confirmed to be spatially proximate.26,27 To further validate the spatial association of these chimaeric gene pairs, we checked the contact probability of chromosomal regions, where chimaeric genes localize. Although only a normalized contact map of human lymphoblast is available so far, we still can see contact enhancement between some chimaeric genes. Considering the difference in expression profile of different cell lines, chimaeric gene pairs collected from other cell lines might not be actively expressed in the lymphoblast, which meets no requirement of the TIC. Thus, more chromosome contact maps from diverse cell lines would be helpful to confirm the spatial proximity of these chimaeric gene pairs. On the other hand, however, it is not necessary for each chimaeric gene pair to be functionally related. Considering the fact that a limited amount of the transcriptional factories exists in the cell nucleus, genes sharing the same transcriptional apparatus might just be temporal related.
For the time being, it is still too early to draw definitive conclusions about interchromosomal interaction pattern, but a probabilistic non-random arrangement of chromosomes seems plausible in mammalian cell nucleus.28 From our observation, what can be confirmed at present is that the chromosomes pair-wise association pattern is not random, when compared with the pattern with chromosomes distributed arbitrarily. Some researches have shown that the relative arrangements of some chromosomes are conserved and independent of cell types, whereas others seem to be cell-type specific.29 The same is true with regard to the chromosomal rearrangement in tumour cell, a cell line in which disease-related fashion was observed.29 The observation that some chimaeric transcripts can be expressed in genetically rearranged cells and in normal cells raises the possibility that such physical proximity between gene loci might be preserved after the chromosomal translocation. This might be an explanation of the slight difference detected from the interchromosomal interaction patterns of normal and tumour cell lines.
The pattern reflected by the intrachromosomal loci interaction is very informative. From 500 to 7–8 Mb, the interaction probability shows a specific mathematical form (i.e. an exponential form) that is consistent with the data from chromosome conformation capture experiments. Thus, at this scale, the architecture of chromatin folding fits well with the experimental results16 and with a model recently proposed.17,30 In mouse, although it has fewer data, a coarse pattern compatible with that from human is seen as well. For the complexity of higher eukaryotic nucleus, the genomes must be well organized, covering several different length scales to keep an ordered but flexible architecture and to exert their functions properly. The strategy used by mammals for chromosome organization might be conserved across the species. Furthermore, the pattern shown after distance normalization indicated that a basal folding schema might exist. This basal form of condensation might organize the chromatin fibre into a series of units for subsequent folding. Due to the increase in the stiffness and the bulk size of the chromatin fibre after folding, the contact probability rises along with the extended genomic distance.
Supplementary data
Supplementary Data are available at www.dnaresearch.oxfordjournals.org.
Funding
S.L. gratefully acknowledges funding from the Heinz-Goetze-Foundation and the Heidelberg Graduate School of Mathematical and Computational Methods for the Sciences.
Supplementary Material
Acknowledgements
The authors appreciate here the assistance from M. Bohn and the resources from the Heidelberg Graduate School of Mathematical and Computational Methods for the Sciences (HGSMathComp).
Footnotes
Edited by Dr Minoru Ko
References
- 1.Akiva P., Toporik A., Edelheit S., et al. Transcription-mediated gene fusion in the human genome. Genome Res. 2006;16:30–6. doi: 10.1101/gr.4137606. [DOI] [PMC free article] [PubMed] [Google Scholar]
- 2.Mayer M.G., Floeter-Winter L.M. Pre-mRNA trans-splicing: from kinetoplastids to mammals, an easy language for life diversity. Mem. Inst. Oswaldo Cruz. 2005;100:501–13. doi: 10.1590/s0074-02762005000500010. [DOI] [PubMed] [Google Scholar]
- 3.Nilsen T.W. Trans-splicing in protozoa and helminths. Infect. Agents Dis. 1992;1:212–8. [PubMed] [Google Scholar]
- 4.Krause M., Hirsh D. A trans-spliced leader sequence on actin mRNA in C. elegans. Cell. 1987;49:753–61. doi: 10.1016/0092-8674(87)90613-1. [DOI] [PMC free article] [PubMed] [Google Scholar]
- 5.Satou Y., Hamaguchi M., Takeuchi K., Hastings K.E., Satoh N. Genomic overview of mRNA 5′-leader trans-splicing in the ascidian Ciona intestinalis. Nucleic Acids Res. 2006;34:3378–88. doi: 10.1093/nar/gkl418. [DOI] [PMC free article] [PubMed] [Google Scholar]
- 6.Mongelard F., Labrador M., Baxter E.M., Gerasimova T.I., Corces V.G. Trans-splicing as a novel mechanism to explain interallelic complementation in Drosophila. Genetics. 2002;160:1481–7. doi: 10.1093/genetics/160.4.1481. [DOI] [PMC free article] [PubMed] [Google Scholar]
- 7.Zhang C., Xie Y., Martignetti J.A., Yeo T.T., Massa S.M., Longo F.M. A candidate chimeric mammalian mRNA transcript is derived from distinct chromosomes and is associated with nonconsensus splice junction motifs. DNA Cell Biol. 2003;22:303–15. doi: 10.1089/104454903322216653. [DOI] [PubMed] [Google Scholar]
- 8.Li X., Zhao L., Jiang H., Wang W. Short homologous sequences are strongly associated with the generation of chimeric RNAs in eukaryotes. J. Mol. Evol. 2009;68:56–65. doi: 10.1007/s00239-008-9187-0. [DOI] [PubMed] [Google Scholar]
- 9.Frenkel-Morgenstern M., Valencia A. Novel domain combinations in proteins encoded by chimeric transcripts. Bioinformatics. 2012;28:i67–74. doi: 10.1093/bioinformatics/bts216. [DOI] [PMC free article] [PubMed] [Google Scholar]
- 10.Patel M., Simon J.M., Iglesia M.D., et al. Tumor-specific retargeting of an oncogenic transcription factor chimera results in dysregulation of chromatin and transcription. Genome Res. 2011;22:259–70. doi: 10.1101/gr.125666.111. [DOI] [PMC free article] [PubMed] [Google Scholar]
- 11.Li H., Wang J., Mor G., Sklar J. A neoplastic gene fusion mimics trans-splicing of RNAs in normal human cells. Science. 2008;321:1357–61. doi: 10.1126/science.1156725. [DOI] [PubMed] [Google Scholar]
- 12.Carter D.R., Eskiw C., Cook P.R. Transcription factories. Biochem. Soc. Trans. 2008;36:585–9. doi: 10.1042/BST0360585. [DOI] [PubMed] [Google Scholar]
- 13.Chuang C.H., Belmont A.S. Close encounters between active genes in the nucleus. Genome Biol. 2005;6:237. doi: 10.1186/gb-2005-6-11-237. [DOI] [PMC free article] [PubMed] [Google Scholar]
- 14.Branco M.R., Pombo A. Intermingling of chromosome territories in interphase suggests role in translocations and transcription-dependent associations. PLoS Biol. 2006;4:e138. doi: 10.1371/journal.pbio.0040138. [DOI] [PMC free article] [PubMed] [Google Scholar]
- 15.Lua R., Borovinskiy A.L., Grosberg A.Y. Fractal and statistical properties of large compact polymers: a computational study. Polymer. 2004;45:717–31. [Google Scholar]
- 16.Lieberman-Aiden E., van Berkum L.N., Williams L., et al. Comprehensive mapping of long-range interactions reveals folding principles of the human genome. Science. 2009;326:289–93. doi: 10.1126/science.1181369. [DOI] [PMC free article] [PubMed] [Google Scholar]
- 17.Bohn M., Heermann D.W., van Driel R. Random loop model for long polymers. Phys. Rev. E Stat. Nonlin. Soft Matter Phys. 2007;76:051805. doi: 10.1103/PhysRevE.76.051805. [DOI] [PubMed] [Google Scholar]
- 18.Mateos-Langerak J., Bohn M., de Leeuw W., et al. Spatially confined folding of chromatin in the interphase nucleus. Proc. Natl. Acad. Sci. USA. 2009;106:3812–7. doi: 10.1073/pnas.0809501106. [DOI] [PMC free article] [PubMed] [Google Scholar]
- 19.Bohn M., Heermann D.W. Topological interactions between ring polymers: implications for chromatin loops. J. Chem. Phys. 2010;132:044904. doi: 10.1063/1.3302812. [DOI] [PubMed] [Google Scholar]
- 20.Unneberg P., Claverie M.J. Tentative mapping of transcription-induced interchromosomal interaction using chimeric EST and mRNA data. PLoS One. 2007;2:e254. doi: 10.1371/journal.pone.0000254. [DOI] [PMC free article] [PubMed] [Google Scholar]
- 21.Yaffe E., Tanay A. Probabilistic modeling of Hi-C contact maps eliminates systematic biases to characterize global chromosomal architecture. Nat. Genet. 2011;43:1059–65. doi: 10.1038/ng.947. [DOI] [PubMed] [Google Scholar]
- 22.Kent W.J. BLAT–the BLAST-like alignment tool. Genome Res. 2002;12:656–64. doi: 10.1101/gr.229202. [DOI] [PMC free article] [PubMed] [Google Scholar]
- 23.Obayashi T., Hayashi S., Shibaoka M., Saeki M., Ohta H., Kinoshita K. COXPRESdb: a database of coexpressed gene networks in mammals. Nucleic Acids Res. 2008;36:D77–82. doi: 10.1093/nar/gkm840. [DOI] [PMC free article] [PubMed] [Google Scholar]
- 24.Sorek R., Safer H.M. A novel algorithm for computational identification of contaminated EST libraries. Nucleic Acids Res. 2003;31:1067–74. doi: 10.1093/nar/gkg170. [DOI] [PMC free article] [PubMed] [Google Scholar]
- 25.Sachs R.K., Chen A.M., Brenner D.J. Review: proximity effects in the production of chromosome aberrations by ionizing radiation. Int. J. Radiat. Biol. 1997;71:1–19. doi: 10.1080/095530097144364. [DOI] [PubMed] [Google Scholar]
- 26.Hahn Y., Bera T.K., Gehlhaus K., Kirsch I.R., Pastan I.H., Lee B. Finding fusion genes resulting from chromosome rearrangement by analyzing the expressed sequence databases. Proc. Natl. Acad. Sci. USA. 2004;101:13257–61. doi: 10.1073/pnas.0405490101. [DOI] [PMC free article] [PubMed] [Google Scholar]
- 27.Ruan Y., Ooi H.S., Choo S.W., et al. Fusion transcripts and transcribed retrotransposed loci discovered through comprehensive transcriptome analysis using paired-end ditags (PETs) Genome Res. 2007;17:828–38. doi: 10.1101/gr.6018607. [DOI] [PMC free article] [PubMed] [Google Scholar]
- 28.Zeitz M.J., Mukherjee L., Bhattacharya S., Xu J., Berezney R. A probabilistic model for the arrangement of a subset of human chromosome territories in WI38 human fibroblasts. J. Cell Physiol. 2009;221:120–9. doi: 10.1002/jcp.21842. [DOI] [PubMed] [Google Scholar]
- 29.Marella N.V., Bhattacharya S., Mukherjee L., Xu J., Berezney R. Cell type specific chromosome territory organization in the interphase nuclus of normal and cancer cells. J. Cell Physiol. 2009;221:130–8. doi: 10.1002/jcp.21836. [DOI] [PubMed] [Google Scholar]
- 30.Bohn M., Heermann D.W. Diffusion-driven looping provides a consistent framework for chromatin organization. PLoS One. 2010;5:e12218. doi: 10.1371/journal.pone.0012218. [DOI] [PMC free article] [PubMed] [Google Scholar]
Associated Data
This section collects any data citations, data availability statements, or supplementary materials included in this article.


