

Abstract
Olive breeding programmes are focused on selecting for traits as short juvenile period, plant architecture suited for mechanical harvest, or oil characteristics, including fatty acid composition, phenolic, and volatile compounds to suit new markets. Understanding the molecular basis of these characteristics and improving the efficiency of such breeding programmes require the development of genomic information and tools. However, despite its economic relevance, genomic information on olive or closely related species is still scarce. We have applied Sanger and 454 pyrosequencing technologies to generate close to 2 million reads from 12 cDNA libraries obtained from the Picual, Arbequina, and Lechin de Sevilla cultivars and seedlings from a segregating progeny of a Picual × Arbequina cross. The libraries include fruit mesocarp and seeds at three relevant developmental stages, young stems and leaves, active juvenile and adult buds as well as dormant buds, and juvenile and adult roots. The reads were assembled by library or tissue and then assembled together into 81 020 unigenes with an average size of 496 bases. Here, we report their assembly and their functional annotation.
Keywords: Olea europaea, 454 pyrosequencing, genomics, Sanger sequencing, transcriptome
1. Introduction
Olea europaea L. is one of the most important and widespread fruit trees in the Mediterranean basin, with 95% of the 750 million olive trees cultivated worldwide, being Spain and Italy the main growers.1,2 Olive, one of the first plants to be cultivated for oil production, is the second most important oil fruit crop cultivated worldwide, with over 8 million hectares of land devoted to its cultivation.3 Most olive production is destined for olive oil, ranking sixth of all vegetable oils produced worldwide.4 Virgin olive oil is a natural fruit juice with no additives or preservatives and a unique flavour, increasingly demanded for its potential health benefits, exceptional nutritional properties, and exceptional organoleptic properties. These characteristics, and a high oxidative stability, are all due to a well-balanced fatty acid composition and the presence of minor components such as natural antioxidants and vitamins.
Olive is a diploid (2n = 46), predominantly allogamous, vegetatively propagated species, with an estimated genome size of 2200 Mb5–7 and a higher tolerance to drought and salt stresses than other fruit trees.8 As many woody plants, olive requires several growth seasons from seed germination to first flowering (juvenile phase). This long juvenile phase had severely hampered the generation of new breeding cultivars that could replace ancient ones still under cultivation.9 Therefore, new cultivars adapted to the new trends in olive growing, i.e. shorter juvenile periods,10 tree architecture suitable for hedgerow orchards and mechanical harvesting,11 or increased oil content and organoleptic profiles tailored to different markets,12 are needed.11
Understanding the complex molecular basis of fruit and oil quality and that of traits of agronomical importance can be greatly helped by the application of genomic tools. Furthermore, development of new molecular markers to assist selection in breeding programmes looking for cultivars with more desirable phenotypes for any of these traits can be greatly helped through the generation and application of genomic tools. However, despite its economical relevance, the generation of sequence information and genomic tools for either olive or any closely related species has only just started.13–16 Genomic information in olive is well behind other species of woody plants, such as Vitis vinifera17,18 and Populus trichocarpa,19 whose complete genome sequences are already available, although the first sequences for these species became available around the same time, or even later, than those from olive.20 Without a genome sequence, transcriptome sequencing is an effective approach for gene discovery and identification of transcripts involved in specific biological processes (BP).
In this study, we report the largest contribution to date to sequence information in this important crop species, with close to 2 M reads generated through the combined use of Sanger sequencing and 454 pyrosequencing technologies, for the identification of expressed sequence tags (ESTs) from different plant tissues and developmental stages. The assembly of the 2 M reads has rendered over 81 020 unigenes, and we present here the result of this assembly and its functional annotation.
2. Materials and methods
2.1. Plant material for the generation of cDNA libraries and collections
Four cDNA libraries were generated for Sanger sequencing (Table 1). To generate a mesocarp cDNA library (OLmeso), fruit mesocarp was collected from fruits of Lechin de Sevilla, harvested at three relevant stages of maturation: green with lignified endocarp (18 WAF), turning (27 WAF), and purple (34 WAF). For the bud cDNA library (OLmer), buds containing actively growing meristems harvested from juvenile low branches and adult high branches of 10 segregating seedlings from a Picual × Arbequina cross of the UCO-IFAPA Olive Breeding Program of Córdoba, Spain, were taken by mid April 2008. Roots from a single adult tree of Lechin de Sevilla and 10 different 2-month-old trees from the segregating progeny of the Picual × Arbequina cross were also harvested to generate a root cDNA library (OLroot). Young leaves and stems of Lechin de Sevilla were collected and used together with seeds from olive fruits of the Picual × Arbequina progeny at two different maturation stages: green with lignified endocarp (18 WAF) and turning (27 WAF) to generate OLrest. The tissues used to generate the eight cDNA collections used for pyrosequencing are detailed in Table 1.
Table 1.
Description of the olive cDNA libraries and collections generated in this work
| Variety | Name of the library | Description |
|---|---|---|
| Sanger sequencing | ||
| Lechín de Sevilla | OLmeso | Mesocarp from fruits at 2 stages of maturation: green with lignified endocarp (18 WAF), turning (27 WAF), and purple (34 WAF). |
| Picual × Arbequina | OLmer | Buds from young and adult branches, from 10 segregating trees. Full RNA was purified from each sample and pooled adding equal amounts of RNA from juvenile and adult tissue from each tree. |
| Lechín de Sevilla; Picual × Arbequina | OLroot | One root sample from adult trees of Lechin de Sevilla and 10 root samples from juvenile trees from a segregating progeny of the Picual × Arbequina cross. Full RNA was purified from each sample and pooled adding equal amounts from adult and juvenile roots. |
| Picual × Arbequina; Lechín de Sevilla | OLrest | Young leaves and stems of Lechin de Sevilla and seeds from fruits at two different maturation stages, green with lignified endocarp (18 WAF) and turning (27WAF) from the segregating progeny of a Picual × Arbequina cross. RNA was purified from each sample and pooled adding equal amounts of RNA from each tissue and stage. |
| 454 Pyrosequencing | ||
| Picual | MAP | Active buds. |
| Picual | MIP | Dormant (inactive) buds. |
| Arbequina | MAA | Active buds. |
| Arbequina | MIA | Dormant (inactive) buds. |
| Arbequina × Picual | SGAP | Seed from green fruits with lignified endocarp (18 WAF). |
| Picual | MGP | Mesocarp from green fruits with lignified endocarp (18 WAF). |
| Arbequina | MTA | Mesocarp from fruits at turning stage (27 WAF). |
| Picual | MTP | Mesocarp from fruits at turning stage (27 WAF). |
2.2. RNA extraction, cDNA synthesis, and generation of cDNA libraries
Total RNA was purified from mesocarp samples following previously described methods21,22 that allow elimination of phenolic compounds and using the TURBO DNA-free kit (Ambion, USA) to remove genomic DNA. Oligotex (Qiagen) was used to obtain mRNA from total RNA to guarantee RNA integrity when mesocarp samples were to be used to generate cDNA libraries. Total RNA extraction from juvenile and adult roots, young leaves and stems, and from seeds of green and turning fruits were carried out using Spectrum Total RNA Kit (Sigma-Aldrich, Spain) after tissue processing with an electric homogenizer. Total RNA from buds was purified using a Trizol-based method (Life Technologies)23 and treated twice with DNase.24 In all cases, RNA concentration was quantified using a spectrophotometer at OD 260 nm, and integrity checked by electrophoresis in agarose gels.
For the generation of the four cDNA libraries for Sanger sequencing, and prior to cDNA synthesis, equal amounts of RNA from mesocarp from the different stages of maturation (OLmeso), equal amounts of RNA from juvenile and adult roots (OLroot), or buds (OLmer), and equal amounts of young leaves and stems, seeds from green and turning fruits (OLrest) were pooled together. Synthesis of cDNA was carried out using the SMART kit (DB Clontech, USA),25 and normalized using the DSN nuclease (TRIMMER-Direct cDNA Normalization Kit from Evrogen, JSC, Russia).26,27 To confirm that the normalization process was correct, an aliquot was visualized by gel electrophoresis, and the presence of olive genes of known expression was confirmed for some of the tissues by polymerase chain reaction (PCR). cDNA insert preparation was treated with Proteinase K, cleaned, and digested with the appropriate restriction enzymes. cDNA was size fractionated by ChromaSpin-400 columns, ligated into the pDNR-LIB,28 (OLroot and OLrest libraries), pAL17.129 (OLmeso library), or pSTBlue-1 (Novagen, Merck KGaA, Darmstadt, Germany) (OLmer library) vectors, previously dephosphorylated, and transformed into Escherichia coli. Libraries were titred and tested by randomly picking and amplifying a small number of clones using universal primers. The sizes of the PCR products ranged between 0.5 and 2 Kb.
When generating cDNA collections for pyrosequencing, the first strand cDNA synthesis was performed using the ‘RevertAid H Minus First Strand cDNA Synthesis Kit’ (Fermentas), and, the second strand cDNA was synthesized using E. coli DNA polymerase I and RNase H (Fermentas).
2.3. Sanger and 454 sequencing
cDNA libraries were automatically sequenced from the 5′ end using either the T7 primer (OLmeso and OLmer) or the pDNRlib30-50 primer (OLroot and OLrest), and FASTA files were generated for bioinformatic processing. cDNA collections for pyrosequencing were sheared via nebulization into small fragments and sequenced using GS-FLX (MAP, MIP, MIA, and MAA) or GS-FLX Titanium (SGAP, MGP, MTA, and MTP) (Roche, Basel, Switzerland). Half of a picotiter plate was used for cDNA collections: MAP, MIP, MIA, and MAA, with single libraries being sequenced in separated areas of the plate, whereas a full plate was used for SGAP, MGP, MTA, and MTP. An initial quality filtering was carried out before the actual base calling, where 454 adapter sequences were removed. Transmission, storage, and handling of sequencing data were subsequently done using the standard flowgram format (SFF) files for compactness and easiness of usage. SFF files were created after image analysis using the GSRunProcessor Version 2.3 provided by 454 Roche through Lifesequencing S.L., Spain. Calling qualities and sequence extraction from SFF files were carried out using sfftools Version 2.3 also provided by 454 Roche through Lifesequencing.
2.4. EST processing protocols
Most of the EST processing protocols were adapted from those described by Vera and collaborators.30 Based on preliminary data using different computational assembly pipelines, including the 454 GS Assembler software, we chose to assemble the 454 sequence data using SeqMan Pro 8.1.1 (DNASTAR Lasergene v8.0 Suite, DNASTAR, USA). During pre-assembly, sequencing ends were trimmed using a medium-stringency criteria, with the following SeqMan parameters: average quality score Q/n threshold of 12, a non-trace window size of 50, and a maximum of 2 Ns. As part of the preprocessing step, an exhaustive comparison against a prokaryotic database (Uniprot database: taxonomic divisions Bacteria and Archaea) was performed to remove all those sequences that potentially originated from external contamination. For sequences obtained using 454 technology, no scanning for vector sequences was carried out. In the actual assembly step, the assembler used a strategy combining quality weighting (when there was not enough coverage depth) and simple majority (when deeper coverage was present) for contig consensus determination. For large 454 sequencing projects, the software provider recommended a set of pre-assembly and assembly parameters; however, because they were optimized for shorter reads than those obtained in our study, we performed several benchmark assemblies under different sets of parameters (Supplementary Tables S1 and S2). When final length and coverage of the contigs were considered adequate, the parameters identified as optimal, which were different from those that were vendor recommended, were used to assemble the data obtained from 454 sequencing. We used a minimum consecutive match size of 25 bases, a minimum match percentage of 70%, and a match spacing of 15-mer tags. We established a minimum length of 70 bases for a sequence to be considered for assembly, no gap penalty and a 0.70 gap length penalty, and a maximum mismatch in end bases of 0. No repeat handling was used. Sanger sequencing data was also assembled using SeqMan Pro 8.1.1, using the default parameters recommended, that thus allowed us to perform joint 454-Sanger assemblies. High stringency quality trimming was used to remove low-quality bases at the ends of the sequences. The parameters for pre-assembly and assembly were similar to those used for 454 cDNA collections, but the match percentage was set to 80%, and a match spacing of 150 was required. A minimum of 100 bases was required for a sequence to be assembled (because of Sanger sequencing technology obtaining longer reads). The maximum mismatch in the end bases was also set to 15 to help mitigate assembly problems, if untrimmed vectors or bad base calls are present at the end of the reads. ESTs screening for vector sequences was carried out as follows in Sanger libraries: OLmeso was screened for pAL17.1, OLmer for pSTBlue-1, and OLrest and OLroot for pDNR-LIB. After the pre-assembly (cleaning and trimming) step, most of the raw reads were considerably reduced in size because of the tendency of the Sanger sequencing technology to incorporate traces of vector sequence and lower quality calls at 3′ and 5′ ends. The complete assembly of all sequences was carried out using a sequential combination of two different assemblers. Briefly, the initial sequencing dataset was assembled using Newbler 2.6 (Roche Ltd)31 and default parameters for cDNA data (seed step = 12; seed length = 16, seed count = 1, minimum overlap length = 40, and minimum overlap identity = 90%). The resulting dataset of contigs and singletons was used as input for the second assembler, CAP3,32 to collapse all related sequences that could not have done so during the first assembly step. The parameters used to perform the CAP3 assembly were a minimum overlap length of 60 bases and a minimum overlap identity of 90%. Unigenes generated from the assembly were further filtered for a minimum size of 200 nt. Unigenes generated were classified according to the tissues from which they included sequencing reads. The lists of unigenes detected in each of the tissues were compared using the software VENNY, to identify those unigenes expressed in a single or two or more tissues. This software displays the results of these comparisons as Venn diagrams (http://bioinfogp.cnb.csic.es/tools/venny/).33
2.5. Analysis of transcript and transcriptome coverage
A mathematical analysis similar to rarefaction analysis and previously applied for similar purposes in pea (Pisum sativum) was used to estimate both transcript and transcriptome coverage.34 A read pool was defined using all reads obtained after the cleaning and trimming process from which reads were randomly drawn to generate sets of reads (datasets) of increasing sizes. The number of tomato genes identified using BLASTX (Basic Local Alignment Search Tool 2.2.18)35 to compare these different datasets against the tomato ‘ITAG2 protein database (http://solgenomics.net)’ (e-value ≤ 10−4) was recorded for each dataset and plotted against the corresponding sample sizes. Data points, thus, obtained were fitted to a non-linear regression with the model y = ax/(b + x) (SigmaPlot Software, Systat Software Inc., Scientific Software Products). Curves are expected to converge against a fixed value parameter ‘a’ in the model function indicating an upper limit for gene detection, which correlated with a decreasing slope at higher sample sizes indicative of a decreasing potential to detect additional tomato genes with further sampling. This approach was also used to record tomato genes with more than 5, 10, and 100 hits to estimate transcript coverage.
2.6. Data availability
The 454 sequenced read data reported in this manuscript have been deposited in the National Center for Biotechnology Information (NCBI) Sequence Read Archive and are available under the Accession Number (NCBI: SRA059461). The results from the assembly reported in this manuscript have been deposited in the NCBI Transcriptome Shotgun Assembly Archive and are available under the Accession Number (GABQ00000000).
2.7. Functional annotation
Unigenes generated were functionally annotated based on the similarity with UniProt-annotated sequences, in particular using plants taxonomy. The annotation algorithm used, Sma3s (Pérez-Pulido A.J., Muñoz-Mérida A., Viguera E., Claros M.G., Trelles O., Sma3s: a three-step modular sequence annotator. In preparation), was developed at the University of Malaga and briefly consists on a restrictive BLAST35 search with three steps of significance that sequentially retrieve annotations from: (i) already existing annotated sequences, (ii) orthologous sequences, and (iii) groups of sequences sharing a statistically significant pattern. Sma3s provides the following biological descriptors associated with each sequence: Gene ontology (GO) terms, Swiss-Prot keywords and pathways, InterPro domains, and IntAct interactions (Uniprot, UniProt Knowledgebase Release 2012_04). In the first step, minimal correspondence was established at a 90% of sequence identity with a sequence overlap of at least 90% of the query sequence length. In the second step, the threshold was established at 75% of per-residue identity and length overlapping of more than 75% of their length. Lastly, the third step uses all BLAST alignments related to each query sequence, which are classified as statistically significant by the Sander's formulae.36,37 The curve determined by the formulae binds the relationship between sequence similarity and alignment length observed, in sequences sharing structural similarity. Thus, those entries displaying identity length coordinates over the curve correspond to statistically significant hits. This analysis is necessary to distinguish true from false positives, when the level of sequence identity is not sufficiently high to unambiguously distinguish between protein pairs of similar and non-similar structures. The annotations resulting from these hits were reported by the algorithm.
The annotation generated by sma3s was loaded as a tab-separated file in the Blast2GO suite,38 to retrieve the GO structure of our data. A directed acyclic graph (DAG)38 was made with a >2 unigenes per GO term as a cutoff to overcome the computing limitations encountered as a result of the large size of our dataset. Statistics of our annotation dataset were saved into a Microsoft Excel datasheet, and charts were generated. Statistical analysis of GO terms enrichment was carried out using the Blast2GO suite38 to perform a two-tailed Fisher's exact test,39 a non-parametric test for independence that calculates the false discovery rate (FDR) following the method described by Benjamini and Hochberg.40 The test was carried out using a term filter value of 0.05.
3. Results and discussion
3.1. Experimental design
Our primary interest focuses in three major traits: (i) fruit and oil quality, (ii) juvenility, and (iii) plant architecture. Selection of the adequate tissues, developmental stages, and varieties, from which ESTs would be obtained, is therefore paramount. Thus, cultivars Picual and Arbequina were selected for having very different characteristics regarding fruit and oil organoleptic properties, as well as tree architecture, whereas cultivar Lechin de Sevilla was included in the study for showing intermediate phenotypes for all these traits41 (Table 1). In addition, they are among the varieties most widely cultivated worldwide.
To get information about genes involved in determining oil content and composition, we selected mesocarp and seed tissues from fruits of different varieties at stages of maturation that correspond to the relevant phases of fruit development and ripening with respect to oil accumulation (Table 1). In particular, we selected mesocarp and seed tissues from green fruits with lignified endocarp as the earliest developmental stage because the lignification of the endocarp marks the start of the triacylglycerol synthesis and oil accumulation in both, the mesocarp, with a major contribution to the final composition of the olive oil and the seed. Unlike the seed, in the mesocarp, the increase in oil content continues during the ripening process that is characterized by a change in colour of the fruit, turning from green to purple and then black. Therefore, we also selected turning and purple mesocarp. In this way, we have generated five cDNA library/ collections for Sanger sequencing or pyrosequencing to obtain ESTs related to oil quality.
Determining the length of the juvenile period and the plant architecture are processes strongly associated with meristematic activity. During the transition from juvenile to adult, a maturation gradient is developed in plants from the basal parts formed by juvenile apical meristems, to the upper parts formed by adult meristems.10,42–44 Thus, we generated a cDNA library using RNA extracted from actively growing buds and four cDNA collections using RNA extracted from buds containing active or inactive (dormant) buds (Table 1). In addition, in woody plants, a minimum distance from the roots to the apical meristems, measured as number of nodes rather than length, is required to get the juvenile-to-adult phase transition, suggesting that juvenility signals coming from the roots are involved in the process. Therefore, we also included in our study a cDNA library using RNA extracted from roots (Table 1).
Finally, a fourth cDNA library was generated from a mix of other tissues, to extend the number of representative ESTs from olive and used for Sanger sequencing (Table 1). It is noteworthy that whereas the four cDNA libraries generated for Sanger sequencing were normalized to maximize transcriptome coverage, the cDNA collections for 454 pyrosequencing were non-normalized to gain information on gene expression levels.
3.2. Sequencing results
In total, we obtained 1 932 337 reads (1 781 033 after trimming and cleaning), 47 518 (38 183 after trimming and cleaning) of which were generated through Sanger sequencing, with an average length of 847 bp, and 1 884 819 (1 742 850 after trimming and cleaning) generated through 454 pyrosequencing, with an average length of 269 bp (Supplementary Table S3). It is noteworthy that during the execution of the pyrosequencing project, the GS-FLX Titanium platform became available, which considerably improved the quality of the results. From an average length of 225 bp for the first 660 715 reads corresponding to the four cDNA collections generated from buds, we moved to an average length of 314 bp for the remaining 1 224 102 reads corresponding to the four cDNA collections generated from fruits. The average number of sequences left after the process, as well as their average length for each library and collection, is displayed in Supplementary Table S3. After the cleaning and trimming processes, the remaining 1 781 033 reads (92.1% of the total number of reads) were used for assembly.
3.3. Sequencing data assembly
Figure 1 shows the workflow of the process used to generate ESTs from the assembly of individual libraries (OLroot, OLmer, OLrest, and OLmeso) (panel A) and collections (MIP, MIA, MAP, MAA, SGAP, MGP, MTA, and MTP) (panel B). The number of unigenes, defined as the number of contigs (consensus sequence obtained from assembled reads), and the number of singletons (unassembled reads), generated from the assembly process of the cleaned reads obtained for each library and collection, are detailed in Supplementary Table S3.
Figure 1.

Workflow followed for the individual assembly of different library/collections and for the assembly of different combinations of library/collections (e.g. assembly of libraries generated from the same tissue). Sections A and B show separate processes for both Sanger and 454 reads assembly. Different assemblies were performed using SeqMan Pro 8.1.1 except when assembling together all the reads generated, which was performed using a two-step assembly process (Newbler 2.6 followed by CAP3) to overcome problems when handling such large amount of data. QC Assembly stands for a quality control step carried out before the actual assembly, where all the reads matching any prokaryotic sequence were removed. QC Blast stands for a quality control step carried out for each assembly consisting of comparing the unigenes generated with themselves using BLAST to guarantee optimal assembly results.
To assess the performance of the 454 assembly, a BLASTN search was carried out using as query the contigs resulting from assembling together the reads generated from the 4 collections sequenced by 454 prior to the GS-FLX Titanium upgrade (MIP, MIA, MAP, and MAA), selected for being those with the shortest average length versus a database with all the unigenes (contigs plus singletons) obtained from the assembly. If the assembly process was optimal, a singleton should not match with any of the contigs, nor a contig must match any other contig. Thus, the matches obtained between the query sequences (contigs) and the total unigenes (contigs + singletons), apart from the hit of each contig with itself, should be as few and as short as possible, demonstrating the uniqueness of each of the contigs and singletons generated through the assembly. Our analysis revealed that only 9% of the contigs (n = 4272) had BLAST hits with 100% identity with other contigs (n = 47.5) or singletons (n = 63.7), but in no case these alignments extended over the entire length of either the BLAST subject or the query, suggesting that they originate from partial similarities, rather than from ineffective assembly. Regions that obtained a perfect match against a different contig or a singleton had an average length of 125 and 114 nt, respectively, that represent 24.3% of the length of the query sequence, in average for matches to contig and 19.7% for matches to singletons. The simplest explanation for these results is that these small matching regions, with 100% identity alignments, are either small sequence motifs highly conserved in different genes or the result of alternative splicing. In either case, the results of our test indicate that the assembly pipeline was capable of distinguishing these short matches from proper matches, assigning the sequences to separate contigs.
Assembling together the data generated from all the libraries and collections required the use of a more complex strategy, to overcome the limitations in the computer's memory, when handling such a large amount of sequencing data and the potential difficulties associated with sequence variability when assembling different plant varieties in a highly heterozygous species. With the clear aim of reducing the number of sequencing reads from the same gene assembled into different contigs, our chosen strategy was the sequential use of two different assemblers. The assemblers selected are based on two different mathematical models for assembly: ‘Greedy’ and ‘Overlap-Layout-Consensus’ (OLC). The Greedy assembler chosen was Newbler as it is the software provided by the company that performed the 454 sequencing (LifeScience/Roche). The OLC method of our choice was CAP3 that was carried out after the first assembly step, taking as input the output of the Newbler assembly. Thus, we obtained 162 118 unigenes from which 52 781 were contigs and 109 337 singletons. A subsequent filter was performed setting a minimal length of 200 nt. The resulting dataset was, thus, composed of 81 020 unigenes from which 47 520 were contigs (Supplementary Table S3).
3.4. Analysis of the assembled dataset
The distribution by length of the unigenes generated in the assembly is shown in Fig. 2. Interestingly, only a single peak could be observed for either contigs, or unigenes, indicating that the sequences generated from the two types of technologies have been integrated during the assembly process. The GC content of the olive transcriptome assembled in this study ranged from 15.4 to 76.2% in the different unigenes, with an average of 40.4%, very similar to that of 42.5% reported previously.13
Figure 2.
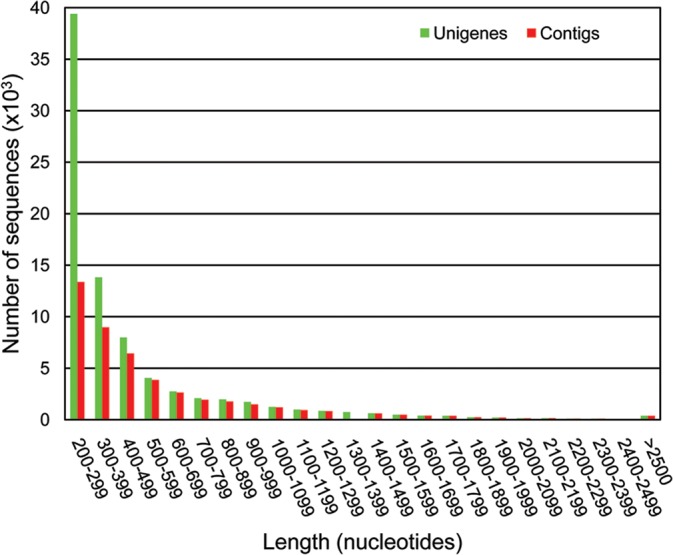
Distribution of lengths of contigs and unigenes from the fully assembled dataset. Unigenes are represented in green and contigs in red.
Analysis of EST abundance in a contig can provide insight into the gene expression levels, although in our case, this information must be taken with caution because the Sanger-sequenced libraries were normalized. Figure 3 shows the distribution of contigs coverage for those originated from the assembly of all the sequences obtained. A wide distribution of coverage among the contigs can be observed in the figure, with the number of ESTs assembled into a given contig ranging between 2 and more than 1000. The largest group was that of the contigs formed by 2–4 reads (47.6% of all contigs) dropping to 19.1% of those containing 5–10 reads, probably owing to the limitations of the assembly process and length of the 454 reads, as well as the presence of normalized libraries among those generated. However, 33.2% of the total contigs were formed by 10–10 000 reads. For these contigs, the number of reads is likely to be a good indication of their level of expression, and this correlation is expected to be stronger as the number of reads forming the contigs increases.
Figure 3.

Distribution of the number of reads per contig for the contigs from the assembled dataset.
Probably, one of the best assessments of the quality of the assembled database is provided by the number of different transcripts of the transcriptome being tagged by at least one read; in other words, the transcriptome coverage. To estimate the transcriptome coverage, the number of olive transcripts likely to be included in our assembled dataset, we used as a reference the tomato (Solanum lycopersicum) ITAG2 protein database (http://solgenomics.net), a sequenced45 and relatively closely related species (Supplementary Fig. S1).46,47 We found that 81.2% of the tomato genes were hit by at least one read from our olive dataset. We mathematically estimated transcriptome coverage, following a strategy similar to rarefaction analysis previously used for the same purpose in pea (P. sativum).34 Random groups of reads of increasing sizes were tested for identification of tomato genes and fitted to a hyperbolic curve (Fig. 4). Because the slope at the final three points of the curve, corresponding to 60, 80, and 100% of the total reads, was very low (5 × 10⁻⁴, 3 × 10⁻⁴, and 2 × 10⁻⁴, respectively), a further increase in the size of the sample (number of reads obtained) would not result in a significant increase in gene identification. Taking into account the taxonomical distance between the two species, the different representation of tissues in our dataset, and the absence of flowers in this analysis, we are likely close in saturate the olive transcriptomes for mesocarp, meristem, and seed tissues. Thus, even though the final assembly did not collapse and we still have a number of unigenes larger than expected, we are likely to have at least one read from the majority of the transcripts generated in these tissues.
Figure 4.

Rarefaction analysis of gene representation in the assembled dataset. Different numbers of randomly sampled reads were blasted against the SOLLC protein database, and the number of proteins identified at least 1time, 5, 10 and a 100 times was recorded. The resulting data were modelled with non-linear regression y = (ax)/(b–x).
An additional parameter frequently used to assess the goodness of an assembly is the transcript coverage or percentage of the total number of bases of the transcriptome that has been covered. To estimate transcript coverage, we also followed the same strategy previously applied to pea,34 which based on the notion of most transcripts requiring more than one read to cover its full length, analysed the number of genes tagged by multiple reads. Reads were again tested in random groups of increasing size, and the number of genes tagged by at least 5, 10, or 100 reads was established (Fig. 4). The lowering slopes of the curves obtained for all three cases (e.g. 6 × 10⁻³, 4 × 10⁻³, and 3 × 10⁻³ for genes tagged by more than 100 hits) suggest that although transcript coverage is not complete, it may also be close to saturation.
We also evaluated the level of redundancy between libraries by analysing the distribution of reads in contigs across the libraries (Fig. 5). We found that 23.1% of the contigs contained reads generated from a single library, 26.9% contained contigs generated from 2, 49.0% of them contained reads that originated from 3 to 9 libraries, whereas only 0.9% contained reads originated from more than 9 to 12 libraries. As expected, even though a large percentage of contigs is formed by a reduced number of reads (Fig. 2), a large percentage of contigs contain reads from many libraries. The drop in the percentage of contigs containing reads originated from 9 to 12 libraries is likely to reflect the difference in size among some of the libraries. We further characterized the contribution of the different libraries to the final assembly by comparing the number of reads from each library that corresponds to singletons, or either belongs to contigs formed by reads shared by different libraries, or to contigs formed by reads from a single library (Fig. 6A). Two libraries, MAP and SGAP, stand out for their seemingly larger specific composition because reads classified into singletons or assembled into library-specific contigs appear overrepresented when compared with other libraries. However, these results could potentially be biased by the differences in the total number of reads existing between libraries. Thus, we also represented the data normalized against the number of reads per library (Fig. 6B). After normalization, the library generated from inactive buds from Arbequina, MIA, displayed an abnormally high level of specificity with the majority of its reads belonging to library-specific contigs. A more detailed look at the composition of this library revealed an overrepresentation of a few contigs (14) formed by an unusually high number of reads per contig (over 1000 to more than 12 000). We believe this to be a technical issue associated with the generation or sequencing of this particular library and, thus, without biological relevance. Therefore, the potential library specificity of MIA contigs should not be considered without additional evaluation.
Figure 5.
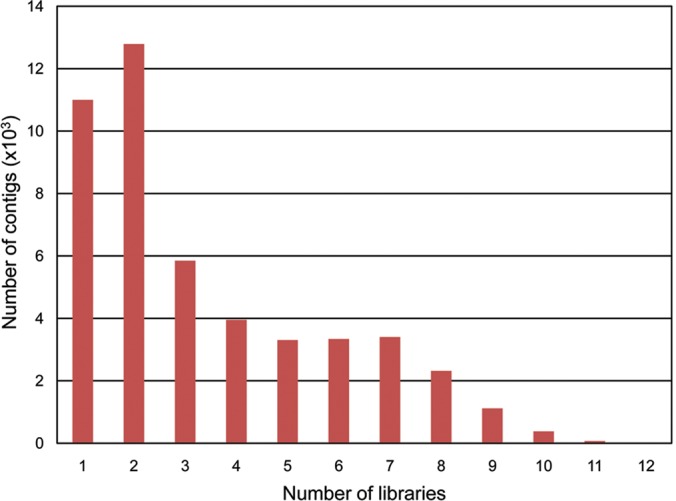
Distribution of number of libraries providing reads per contig. The total number of contigs generated in this work was analysed.
Figure 6.
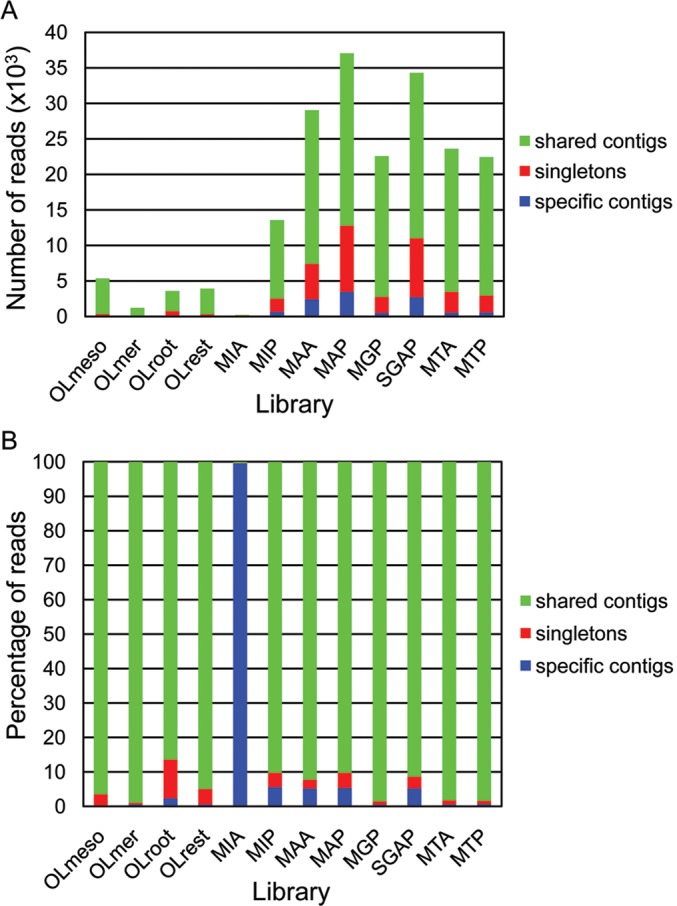
Distribution of number of reads contributing to the singleton category, or contributing to either library-specific or shared contigs, per library. (A) Numbers indicated correspondence to the actual number of reads of the libraries. (B) Numbers of reads per category have been normalized to the total number of reads per library. The number (A), or percentage (B), of contigs shared by more than one library is represented in green, contigs formed by reads from a single library are shown in blue, and singletons in red.
Because a large percentage of the contigs are formed by a reduced number of reads, potentially library-specific genes have to be considered with caution. However, when the number of reads per contig is considered in relation to the tissue specificity of each library, many of the contigs obtained show potential specificity. In regards to this, because some of the libraries were constructed using the same type of tissue, we also evaluated the level of redundancy between tissues. The assembled dataset was examined to identify unigenes formed by reads obtained from sequencing libraries generated from the same tissue. We identified a total of 26 430 unigenes that contained reads only sequenced in libraries generated from meristems, 11 352 unigenes formed by reads obtained from fruit mesocarp, 11 182 unigenes containing reads obtained from seeds, and 757 unigenes containing reads obtained from roots (Fig. 7). The reduced number of reads generated from roots, as compared to the other tissues, is likely to limit the identification of potentially specific ESTs. Because OLrest contains reads from seeds, and from stems and leaves, the results obtained from this library were not considered when establishing potential tissue specificity. Potentially tissue-specific ESTs could be of great interest, particularly considering the large number of reads generated from some of the tissues and the results from the rarefaction analysis indicating that we are close in saturating the corresponding transcriptomes (Supplementary Table S3 and Fig. 4).
Figure 7.
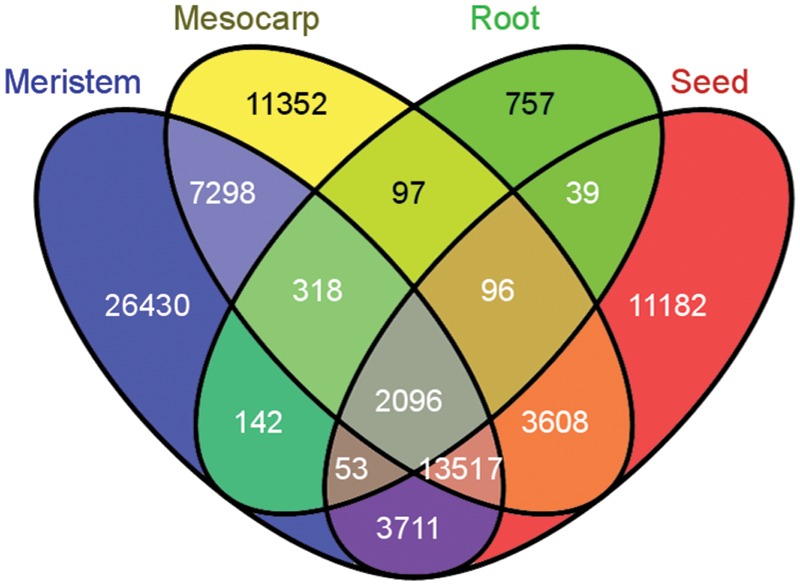
Venn diagram showing common and specific genes for mesocarp, meristem (buds), seeds, and roots.
3.5. Functional annotation
The assembled dataset still includes a considerable number of unassembled reads, a problem common to 454 pyrosequencing projects that may be aggravated by a relative abundance of short repeats within the species,13 the occurrence of alternative splicing, or heterozygosity.48 Theoretically, sequencing a single cultivar could reduce the limitations that heterozygosity may determine in the efficiency of the assembly. Nonetheless, we obtained similar efficiencies, when using our assembly pipeline in libraries generated from a single versus a mix of varieties (Supplementary Table S3 and data not shown). Despite these potential limitations, the functional annotation of our assembled dataset retrieved annotations from various databases for over 61.4% of the contigs (29 194 out of the total 47 520) and 27.8% of the singletons (9311 out of the total 33 500). Similar or much lower percentages of gene annotation have been reporte previously for olive ESTs sequencing projects.13,15 In addition, when we used BLAST to further evaluate the full set of unigenes against the plant sequences deposited in Uniprot, we found that 68.6% of the contigs (32 592 out of the total 47 520) and 35.4% of the singletons (11 863 out of the total 33 500) had a hit with a P-value greater than 10−6. Although the algorithm used in BLAST comparisons is based on local alignment, the relevance of this results is supported by the fact that more than 50% of the hits obtained for the contigs (16 489 of the 32 592) and over 83% of the hits obtained for the singletons (7770 out of the total 9311) extended over more than 75% of their lengths. In total, 47.5% of the unigenes have a significant hit with plant databases, having found for 63% (27 879) of these, a potential homologue. These results further support the notion of our assembly dataset being a fair representation of the olive transcriptome.
The distribution of hits obtained against entries for other plants within the NCBI database was used to get a descriptive view of the newly generated dataset. The highest number of hits was obtained against V. vinifera (VITVI), Ricinus communis (RICCO), and P. tricocharpa (POPTR) (Fig. 8A). However, O. europaea (OLEEU) is only the ninth species displaying the highest numbers of hits, just two positions ahead of Arabidopsis thaliana (ARATH), probably owing to the smaller number of olive sequences present in the NCBI database when compared with the other three species. In keeping with this, species phylogenetically closer to olive such as tomato (S. lycopersicum SOLLC) or potato (Solanum tuberosum SOLTU) did display lower number of hits. We include a phylogenetic tree enclosing the species relevant for our study as supplementary material (Supplementary Fig. S1).
Figure 8.

(A) Distribution of hits of the complete assembly obtained against sequences available in Uniprot for different plant species. (B) Distribution of hits of the complete assembly obtained against sequences available for other plant species, normalized according to the total number of entries for each species. The database code correspondence to plant species is as follows: VITVI, V. vinifera (Grape); RICCO, R. communis (Castor bean); POPTR, P. trichocarpa (Western balsam poplar) (Populus balsamifera subsp. trichocarpa); TOBAC, Nicotiana tabacum (Common tobacco); ARATH, A. thaliana (Mouse-ear cress); OLEEU, O. europaea (Common olive); SOLLC, S. lycopersicum (Tomato) (Lycopersicon esculentum); ORYSJ, Oryza sativa subsp. japonica (Rice); SOLTU, S. tuberosum (Potato); MEDTR, Medicago truncatula (Barrel medic) (Medicago tribuloides); SOYBN, Glycine max (Soybean) (Glycine hispida); CAPAN, Capsicum annuum (Bell pepper); CATRO, Catharanthus roseus (Madagascar periwinkle) (Vinca rosea); GOSHI, Gossypium hirsutum (Upland cotton) (Gossypium mexicanum); NICBE, Nicotiana benthamiana; PETHY, Petunia hybrida (Petunia); BETVU, Beta vulgaris (Sugar beet); PEA, P. sativum (Garden pea), IPOBA, Ipomoea batatas (Sweet potato) (Convolvulus batatas); PICSI, Picea sitchensis (Sitka spruce) (Pinus sitchensis); SESIN, Sesamum indicum (Oriental sesame) (Sesamum orientale); SOLDE, Solanum demissum (Wild potato); PLAMJ, Plantago major (Common plantain); WHEAT, Triticum aestivum (Wheat); NICLS, Nicotiana langsdorffii × Nicotiana sanderae (Ornamental tobacco); NICPL, Nicotiana plumbaginifolia (Leadwort-leaved tobacco or Tex-Mex tobacco); SALMI, Salvias miltiorrhiza (Chinese sage); PERFR, Perilla frutescens (Beefsteak mint) (Perilla ocymoides); MALDO, Malus domestica (Apple) (Pyrus malus); SORBI, Sorghum bicolor (Sorghum); CUCME, Cucumis melo (Muskmelon); LOTJA, Lotus japonicus; SILLA, Silene latifolia (White campion); HELAN, Helianthus annuus (Common sunflower); and ELAGV, Elaeis guineensis var. tenera (Oil palm).
To make up for the differences in the number of protein entries per each plant species, we also plotted the distribution of the number of hits per species normalized for the number of entries from each species within the NCBI database. We established 500 Uniprot entries per species to eliminate distortions frequently observed with very underrepresented species (data not shown). After this process, although many of the species present in the untreated graph (Fig. 8A) were still present, the relative order in which they appeared was considerably altered, with the highest number of hits being obtained against olive (OLEEU) (Fig. 8B). In the normalized graph, the six closest species to our dataset, including olive (OLEEU), correspond to members of the asterids clade (Fig. 8B and Supplementary Fig. S1). In addition, VITVI (V. vinifera) dropped from the first position in the non-normalized graph to eighth and Arabidopsis (ARATH) dropped from 11th to position 23rd, being these new positions more in agreement with the taxonomic relationships between the species (Fig. 8B; Supplementary Fig. S1).
The distribution of hits against different plant species is frequently used without taking into account the large differences between the total numbers of entries for each species included in the NCBI database. We show here that the results obtained without normalization are clearly influenced by the number of entries and far away from the results expected according to the taxonomical relationships between the species.
Because one of our main aims was to generate ESTs with information about the metabolism involved in oil production, we also retrieved enzyme IDs from the functional annotation obtained for our dataset. We found the following distribution into each of the six major enzyme classes (http://enzyme.expasy.org/cgi-bin/enzyme/): transferases 27% (in 87 unigenes), hydrolases 24% (in 76 unigenes), oxidoreductases 30% (in 95 unigenes), ligases 5% (in 15 unigenes), lyases 7% (in 23 unigenes), and isomerases 7% (in 24 unigenes) (Supplementary Fig. S2).
3.6. GO annotation
Blast2GO suite38 is often used for analysing functional annotation for purposes of biologically profiling a newly generated sequence dataset beyond the single-gene level. However, because the suite has limitations when handling large datasets, we could only use Blast2GO to retrieve the GO terms previously assigned to our unigene dataset by Sma3s. To facilitate data processing, we established a cutoff for GO terms that were present in only one sequence within the DAG38 generated (data not shown). A total of 87 309 GO terms were obtained from a total of 27 494 unigenes for which at least 3 GO were obtained. The distribution of assignments into the GO categories was 14 930 unigenes with at least 3 GO terms from BP, 24 568 unigenes with at least 3 GO terms from molecular function (MF), and 11 481 unigenes with at least 3 GO terms from cellular components (CC). The most abundant high-level GO counts within these categories were BP, the very general categories of metabolic processes associated with 10 471 unigenes, and cellular processes, associated with 11 872 unigenes, and more specific, biological regulation, localization, and response to stimulus with 2832, 2168, and 2246 unigenes, respectively; MF, binding, associated with 16 902 unigenes, and catalytic activity associated with 14 657 unigenes; and CC, the very general cell, associated with 11 182 and more specific organelle, with 5220, membrane with 4789, and macromolecular complex with 2557 (Fig. 9).
Figure 9.

Level 2 GO term assignment to the olive fully assembled dataset and distribution in categories of BP, MF, and CC.
Comparisons between the functional annotations associated with tissue-specific genes can provide insights into the expression profile in relation to the nature and biological function of a given tissue. We analysed the functional enrichment of GO terms in meristem-specific genes using Fisher's exact test.39 GO terms associated with cellular division and DNA replication, as well as response to stimuli and hormones, were remarkable overrepresented among meristem-specific genes in comparison with the rest of the transcriptome (Table 2). Because meristems are actively growing sites, key for plant development and shoot branching, both processes strongly influenced by environmental and endogenous signals, such as hormones, the overrepresented GO terms in this tissue are full in keeping with these activities. Interestingly, a clear underrepresentation of terms associated with ubiquitin-mediated protein degradation and regulation could also be seen at several GO levels (Table 2), suggesting that such regulatory mechanism does not have a major role in the regulation of meristem-specific processes.
Table 2.
Significantly enriched terms (FDR < 0.05) for potentially meristem-specific unigenes
| Level | GO term | Name | FDR |
|---|---|---|---|
| Overrepresented GO terms | |||
| Meristematic activity | |||
| 4 | GO:0048532 | Anatomical structure arrangement | 7.6 × 10⁻³ |
| 6 | GO:0009933 | Meristem structural organization | 7.6 × 10⁻³ |
| 6 | GO:0048509 | Regulation of meristem development | 7.0 × 10⁻³ |
| Responses to stimuli | |||
| 4 | GO:0009725 | Response to hormone stimulus | 3.0 × 10⁻³ |
| 3 | GO:0009719 | Response to endogenous stimulus | 5.5 × 10⁻³ |
| 5 | GO:0009755 | Hormone-mediated signalling pathway | 3.2 × 10⁻² |
| 4 | GO:0010033 | Response to organic substance | 3.5 × 10⁻² |
| 4 | GO:0009314 | Response to radiation | 3.3 × 10⁻³ |
| 5 | GO:0009914 | Hormone transport | 1.1 × 10⁻³ |
| 5 | GO:0009416 | Response to light stimulus | 1.7 × 10⁻² |
| 5 | GO:0009733 | Response to auxin stimulus | 1.4 × 10⁻⁵ |
| 6 | GO:0060918 | Auxin transport | 2.5 × 10⁻³ |
| 6 | GO:0071365 | Cellular response to auxin stimulus | 8.3 × 10⁻⁵ |
| 6 | GO:0010332 | Response to gamma radiation | 3.7 × 10⁻² |
| 7 | GO:0009926 | Auxin polar transport | 2.5 × 10⁻³ |
| DNA replication and cell division | |||
| 3 | GO:0071554 | Cell wall organization or biogenesis | 2.3 × 10⁻³ |
| 3 | GO:0007049 | Cell cycle | 3.1 × 10⁻⁹ |
| 3 | GO:0051301 | Cell division | 9.0 × 10⁻⁶ |
| 5 | GO:0042546 | Cell wall biogenesis | 1.7 × 10⁻² |
| 4 | GO:0070882 | Cellular cell wall organization or biogenesis | 7.0 × 10⁻³ |
| 3 | GO:0007059 | Chromosome segregation | 2.2 × 10⁻² |
| 6 | GO:0071103 | DNA conformation change | 1.3 × 10⁻² |
| 8 | GO:0006323 | DNA packaging | 3.3 × 10⁻⁴ |
| 5 | GO:0071669 | Plant-type cell wall organization or biogenesis | 1.0 × 10⁻³ |
| 3 | GO:0032993 | Protein–DNA complex | 8.8 × 10⁻³ |
| 4 | GO:0022402 | Cell cycle process | 5.2 × 10⁻¹² |
| 6 | GO:0030261 | Chromosome condensation | 2.5 × 10⁻⁶ |
| 4 | GO:0000910 | Cytokinesis | 2.4 × 10⁻³ |
| 4 | GO:0000278 | Mitotic cell cycle | 2.5 × 10⁻⁹ |
| 6 | GO:0048285 | Organelle fission | 3.5 × 10⁻⁶ |
| 6 | GO:0009832 | Plant-type cell wall biogenesis | 3.7 × 10⁻³ |
| 4 | GO:0007062 | Sister chromatid cohesion | 2.6 × 10⁻³ |
| 5 | GO:0033205 | Cell cycle cytokinesis | 8.5 × 10⁻⁶ |
| 5 | GO:0022403 | Cell cycle phase | 5.4 × 10⁻⁷ |
| 5 | GO:0032870 | Cellular response to hormone stimulus | 5.5 × 10⁻³ |
| 4 | GO:0032506 | Cytokinetic process | 1.5 × 10⁻³ |
| 7 | GO:0000280 | Nuclear division | 7.9 × 10⁻⁷ |
| 5 | GO:0090304 | Nucleic acid metabolic process | 1.3 × 10⁻²⁴ |
| 5 | GO:0051726 | Regulation of cell cycle | 1.1 × 10⁻³ |
| 7 | GO:0009834 | Secondary cell wall biogenesis | 8.0 × 10⁻⁴ |
| 6 | GO:0044427 | Chromosomal part | 9.3 × 10⁻³ |
| 6 | GO:0000911 | Cytokinesis by cell plate formation | 8.5 × 10⁻⁶ |
| 6 | GO:0015074 | DNA integration | 3.2 × 10−36 |
| 6 | GO:0006259 | DNA metabolic process | 7.0 × 10−56 |
| 6 | GO:0034061 | DNA polymerase activity | 3.5 × 10⁻¹⁰ |
| 6 | GO:0006310 | DNA recombination | 3.1 × 10⁻³ |
| 6 | GO:0006260 | DNA replication | 8.1 × 10⁻²¹ |
| 6 | GO:0009008 | DNA-methyltransferase activity | 5.5 × 10⁻³ |
| 6 | GO:0051325 | Interphase | 3.7 × 10⁻⁴ |
| 6 | GO:0051329 | Interphase of mitotic cell cycle | 3.7 × 10⁻⁴ |
| 6 | GO:0000279 | M phase | 6.8 × 10⁻⁵ |
| 6 | GO:0000087 | M phase of mitotic cell cycle | 7.9 × 10⁻⁷ |
| 6 | GO:0010564 | Regulation of cell cycle process | 1.8 × 10⁻² |
| 6 | GO:0009934 | Regulation of meristem structural organization | 2.4 × 10⁻³ |
| 6 | GO:0007346 | Regulation of mitotic cell cycle | 1.2 × 10⁻³ |
| 6 | GO:0030894 | Replisome | 6.2 × 10⁻³ |
| 7 | GO:0003886 | DNA (cytosine-5-)-methyltransferase activity | 5.5 × 10⁻³ |
| 7 | GO:0003887 | DNA-directed DNA polymerase activity | 1.5 × 10⁻⁵ |
| 7 | GO:0000086 | G2/M transition of mitotic cell cycle | 6.1 × 10⁻⁴ |
| 7 | GO:0007067 | Mitosis | 7.9 × 10⁻⁷ |
| 7 | GO:0043601 | Nuclear replisome | 6.2 × 10⁻³ |
| 7 | GO:0017111 | Nucleoside-triphosphatase activity | 5.2 × 10⁻¹⁰ |
| 8 | GO:0010389 | Regulation of G2/M transition of mitotic cell cycle | 2.4 × 10⁻³ |
| 8 | GO:0003896 | DNA primase activity | 6.2 × 10⁻³ |
| 8 | GO:0006261 | DNA-dependent DNA replication | 6.7 × 10⁻¹⁷ |
| 8 | GO:0042555 | MCM complex | 2.1 × 10⁻² |
| 8 | GO:0043596 | Nuclear replication fork | 6.2 × 10⁻³ |
| 9 | GO:0003678 | DNA helicase activity | 1.5 × 10⁻³ |
| 9 | GO:0006269 | DNA replication, synthesis of RNA primer | 6.2 × 10⁻³ |
| 10 | GO:0043138 | 3′-5′ DNA helicase activity | 2.1 × 10⁻³ |
| 11 | GO:0043140 | ATP-dependent 3′-5′ DNA helicase activity | 2.1 × 10⁻³ |
| Under-represented GO terms | |||
| Ubiquitine-associated processes | |||
| 5 | GO:0000151 | Ubiquitin ligase complex | 3.6 × 10⁻² |
| 6 | GO:0031461 | Cullin–RING ubiquitin ligase complex | 1.3 × 10⁻² |
| 9 | GO:0006511 | Ubiquitin-dependent protein catabolic process | 4.8 × 10⁻³ |
Unfortunately, no such a clear specific profile could be identified for the other tissues. Few relevant differences could be established with confidence in unigenes potentially specific for roots, probably owing to their significantly smaller number, likely determined by the considerably smaller number of reads obtained from this tissue. However, this underrepresentation of root genes probably allowed us to obtain the clear functional enrichment found in meristems because the likely overlap expected between the functional annotation of both tissues (e.g. abundance of GO terms associated with cell division and DNA replication) could have potentially hindered the statistical validation of such specific enrichment in meristem-specific genes. Interestingly, among the very few overrepresented GO terms associated with root-specific genes were acropetal auxin transport (GO:0010541; FDR 3 × 10⁻²) and basipetal auxin transport (GO:0010540; FDR 3 × 10⁻²).
A functional overlap can also be expected between mesocarp and seeds regarding GO terms (i.e. abundance of GO terms associated with oil production), and it is probably the reason why our comparative analysis has not rendered clearer functional profiles for these two tissues. However, a number of unigenes from our assembled dataset have the annotation of GO terms associated with oil production. Quantitative analysis on the relative level of expression of unigenes associated with oil production-related GO terms would probably give insight into the gene expression profile in relation to the biological activities within these tissues.
The functional profiles obtained through GO annotation from the unigenes expressed in meristems are in good agreement with the biological characteristics and activities expected for this tissue, indicating that the transcriptome hereby assembled is a valuable representation of the full transcriptome for this tissue. Thus, the dataset can be highly useful for the identification of interesting candidate genes in traits associated with meristematic activity such as regulation of the juvenility period or tree architecture. Additional work will be necessary to test the potential for the identification of candidate genes involved in oil composition and quality. However, the presence of almost 300 unigenes annotated with the GO level 4 term lipid metabolic process, or lipid biosynthesis (Table 3), does support such potential. This report represents a major contribution to the molecular knowledge of the species, opening the possibility of developing molecular tools to the level currently available for other model plant species, such as Populus or apple tree.
Table 3.
Number of annotations within the full assembly (AS8) to GO terms associated with oil production
| GO level | Name | Number of hits in AS8 |
|---|---|---|
| 4 | Lipid metabolic process | 250 |
| 4 | Lipid biosynthetic process | 25 |
| 6 | Fatty acid biosynthetic process | 156 |
| 6 | Fatty acid metabolic process | 46 |
Supplementary data
Supplementary Data are available at www.dnaresearch.oxfordjournals.org.
Funding
This work was supported by OLEAGEN Project funded by Fundación Genoma España, Junta de Andalucía through Instituto de Investigación y Formación Agraria y Pesquera (IFAPA) and Corporación Tecnológica de Andalucía (CTA).
Supplementary Material
Acknowledgements
We are extremely grateful to the cooperative breeding program carried out by the University of Cordoba, Spain and the Instituto de Investigación y Formación Agraria y Pesquera (IFAPA), Junta de Andalucía, Spain, for providing all the samples used in this work. We also wish to thank E.R. Bejarano and M.A. Botella for their helpful discussions.
Footnotes
Edited by Dr Satoshi Tabata
References
- 1.Loumou A., Giourga C. Olive groves: ‘The life and identity of the Mediterranean. Agric. Hum. Values. 2003;20:87–95. [Google Scholar]
- 2.FAOSTAT. 2008. home page Columbia URL: http://www.columbia.edu/cgi-bin/cul/resolve?ASL9609 .
- 3.Baldoni L., Cultrera N., Mariotti R., et al. A consensus list of microsatellite markers for olive genotyping. Mol. Breed. 2009;24:213–31. [Google Scholar]
- 4.Conde C., Delrot S., Geros H. Physiological, biochemical and molecular changes occurring during olive development and ripening. J. Plant Physiol. 2008;165:1545–62. doi: 10.1016/j.jplph.2008.04.018. [DOI] [PubMed] [Google Scholar]
- 5.Rugini E., Pannelli G., Ceccarelli M., Muganu M. Isolation of triploid and tetraploid olive (Olea europaea L.) plants from mixoploid cv. ‘Frantoio’ and ‘Leccino’ mutants by in vivo and in vitro selection. Plant Breed. 1996;115:23–7. [Google Scholar]
- 6.De la Rosa R., Angiolillo A., Guerrero C., et al. A first linkage map of olive (Olea europaea L.) cultivars using RAPD, AFLP, RFLP and SSR markers. Theor. Appl. Genet. 2003;106:1273–82. doi: 10.1007/s00122-002-1189-5. [DOI] [PubMed] [Google Scholar]
- 7.Doležel J., Bartoš J., Voglmayr H., Greilhuber J., Thomas R.A. Nuclear DNA content and genome size of trout and human. Cytometry A. 2003;51:127–9. doi: 10.1002/cyto.a.10013. [DOI] [PubMed] [Google Scholar]
- 8.Gucci R., Tattini M. Salinity Tolerance in Olive, in Horticultural Reviews. In: Janick J., editor. Vol. 21. UK: John Wiley & Sons, Inc.: Oxford,; 2010. pp. 177–214. [Google Scholar]
- 9.Bellini E. Genetic variability and heritability of some characters in cross-bred olive seedlings. Olivae. 1993;49:21–34. [Google Scholar]
- 10.Moreno-Alias I., Rapoport H.F., Lopez R., Leon L., De la Rosa R. Optimizing early flowering and pre-selection for short juvenile period in olive seedlings. HortScience. 2010;45:519–22. [Google Scholar]
- 11.Rallo L., Barranco D., De La Rosa R., León L. ‘Chiquitita’ olive. HortScience. 2008;43:529–31. [Google Scholar]
- 12.León L., De la Rosa R., Gracia A., Barranco D., Rallo L. Fatty acid composition of advanced olive selections obtained by crossbreeding. J. Sci. Food Agric. 2008;88:1921–6. [Google Scholar]
- 13.Alagna F., D'Agostino N., Torchia L., et al. Comparative 454 pyrosequencing of transcripts from two olive genotypes during fruit development. BMC Genomics. 2009;10:399. doi: 10.1186/1471-2164-10-399. [DOI] [PMC free article] [PubMed] [Google Scholar]
- 14.Galla G., Barcaccia G., Ramina A., et al. Computational annotation of genes differentially expressed along olive fruit development. BMC Plant Biol. 2009;9:128. doi: 10.1186/1471-2229-9-128. [DOI] [PMC free article] [PubMed] [Google Scholar]
- 15.Ozgenturk N.O., Oruc F., Sezerman U., et al. Generation and analysis of expressed sequence tags from Olea europaea L. Comp. Funct. Genomics. 2010;2010:757512. doi: 10.1155/2010/757512. [DOI] [PMC free article] [PubMed] [Google Scholar]
- 16.Donaire L., Pedrola L., De la Rosa R., Llave C. High-throughput sequencing of RNA silencing-associated small RNAs in olive (Olea europaea L.) PLoS ONE. 2011;6:e27916. doi: 10.1371/journal.pone.0027916. [DOI] [PMC free article] [PubMed] [Google Scholar]
- 17.Velasco R., Zharkikh A., Troggio M., et al. A high quality draft consensus sequence of the genome of a heterozygous grapevine variety. PLoS ONE. 2007;2:e1326. doi: 10.1371/journal.pone.0001326. [DOI] [PMC free article] [PubMed] [Google Scholar]
- 18.Jaillon O., Aury J.M., Noel B., et al. The grapevine genome sequence suggests ancestral hexaploidization in major angiosperm phyla. Nature. 2007;449:463–7. doi: 10.1038/nature06148. [DOI] [PubMed] [Google Scholar]
- 19.Tuskan G.A., DiFazio S., Jansson S., et al. The genome of black cottonwood, Populus trichocarpa (Torr. & Gray) Science. 2006;313:1596–604. doi: 10.1126/science.1128691. [DOI] [PubMed] [Google Scholar]
- 20.Bracci T., Busconi M., Fogher C., Sebastiani L. Molecular studies in olive (Olea europaea L.): overview on DNA markers applications and recent advances in genome analysis. Plant Cell Rep. 2011;30:449–62. doi: 10.1007/s00299-010-0991-9. [DOI] [PubMed] [Google Scholar]
- 21.Castillejo C., De La Fuente J.I., Iannetta P., Botella M.A., Valpuesta V. Pectin esterase gene family in strawberry fruit: study of FaPE1, a ripening-specific isoform. J. Exp. Bot. 2004;55:909. doi: 10.1093/jxb/erh102. [DOI] [PubMed] [Google Scholar]
- 22.Hernández M.L., Mancha M., Martínez-Rivas J.M. Molecular cloning and characterization of genes encoding two microsomal oleate desaturases (FAD2) from olive. Phytochemistry. 2005;66:1417–26. doi: 10.1016/j.phytochem.2005.04.004. [DOI] [PubMed] [Google Scholar]
- 23.Simms D., Cizdziel P.E., Chomczynski P. TRIzol: A new reagent for optimal single-step isolation of RNA. Focus. 1993;15:99–102. [Google Scholar]
- 24.Urbańczyk-Wochniak E., Filipecki M., Przybecki Z. A useful protocol for in situ RT-PCR on plant tissues. Cell. Mol. Biol. Lett. 2002;7:7–18. [PubMed] [Google Scholar]
- 25.Zhu Y.Y., Machleder E.M., Chenchik A., Li R., Siebert P.D. Reverse transcriptase template switching: a SMART approach for full-length cDNA library construction. Biotechniques. 2001;30:892–7. doi: 10.2144/01304pf02. [DOI] [PubMed] [Google Scholar]
- 26.Zhulidov P.A., Bogdanova E.A., Shcheglov A.S., et al. Simple cDNA normalization using kamchatka crab duplex specific nuclease. Nucleic Acids Res. 2004;32:e37. doi: 10.1093/nar/gnh031. [DOI] [PMC free article] [PubMed] [Google Scholar]
- 27.Shagin D.A., Rebrikov D.V., Kozhemyako V.B., et al. A novel method for SNP detection using a new duplex-specific nuclease from crab hepatopancreas. Genome Res. 2002;12:1935–42. doi: 10.1101/gr.547002. [DOI] [PMC free article] [PubMed] [Google Scholar]
- 28.Xie Y.F., Wang B.C., Li B., et al. Construction of cDNA library of cotton mutant (Xiangmian-18) library during gland forming stage. Colloids Surf. B Biointerfaces. 2007;60:258–63. doi: 10.1016/j.colsurfb.2007.06.020. [DOI] [PubMed] [Google Scholar]
- 29.Raymond J.A., Janech M.G. Ice-binding proteins from enoki and shiitake mushrooms. Cryobiology. 2009;58:151–6. doi: 10.1016/j.cryobiol.2008.11.009. [DOI] [PubMed] [Google Scholar]
- 30.Vera J., Wheat C., Fescemyer H., et al. Rapid transcriptome characterization for a nonmodel organism using 454 pyrosequencing. Mol. Ecol. 2008;17:1636–47. doi: 10.1111/j.1365-294X.2008.03666.x. [DOI] [PubMed] [Google Scholar]
- 31.Margulies M., Egholm M., Altman W.E., et al. Genome sequencing in microfabricated high-density picolitre reactors. Nature. 2005;437:376–80. doi: 10.1038/nature03959. [DOI] [PMC free article] [PubMed] [Google Scholar]
- 32.Huang X., Madan A. CAP3: a DNA sequence assembly program. Genome Res. 1999;9:868–77. doi: 10.1101/gr.9.9.868. [DOI] [PMC free article] [PubMed] [Google Scholar]
- 33.Oliveros J.C. VENNY. An interactive tool for comparing lists with Venn Diagrams. 2007. http://bioinfogp.cnb.csic.es/tools/venny/index.html .
- 34.Franssen S., Shrestha R., Brautigam A., Bornberg-Bauer E., Weber A. Comprehensive transcriptome analysis of the highly complex Pisum sativum genome using next generation sequencing. BMC Genomics. 2011;12:227. doi: 10.1186/1471-2164-12-227. [DOI] [PMC free article] [PubMed] [Google Scholar]
- 35.Altschul S.F., Gish W., Miller W., Myers E.W., Lipman D.J. Basic local alignment search tool. J. Mol. Biol. 1990;215:403–10. doi: 10.1016/S0022-2836(05)80360-2. [DOI] [PubMed] [Google Scholar]
- 36.Sander C., Schneider R. Database of homology-derived protein structures and the structural meaning of sequence alignment. Proteins. 1991;9:56–68. doi: 10.1002/prot.340090107. [DOI] [PubMed] [Google Scholar]
- 37.Rost B. Twilight zone of protein sequence alignments. Protein Eng. 1999;12:85–94. doi: 10.1093/protein/12.2.85. [DOI] [PubMed] [Google Scholar]
- 38.Conesa A., Gotz S., Garcia-Gomez J.M., Terol J., Talon M., Robles M. Blast2GO: a universal tool for annotation, visualization and analysis in functional genomics research. Bioinformatics. 2005;21:3674–6. doi: 10.1093/bioinformatics/bti610. [DOI] [PubMed] [Google Scholar]
- 39.Bremer M., Doerge R.W. Statistics at the Bench: A Step-By-Step Handbook for Biologists. Cold Spring Harbor Laboratory Press: Cold Spring Harbor, New York; 2010. [Google Scholar]
- 40.Benjamini Y., Hochberg Y. Controlling the false discovery rate: a practical and powerful approach to multiple testing. J. Roy. Stat. Soc. B Met. 1995;57:289–300. [Google Scholar]
- 41.Tous J., Del Río C., Caballero J.M., Rallo L. Libro II. Variabilidad y Selección. In: Rallo L., Barranco D., Caballero J.M., et al., editors. Variedades de olivo en España, Junta de Andalucía. Madrid: MAPA y Ediciones Mundi-Prensa; 2005. [Google Scholar]
- 42.Fortanier E.J., Jonkers H. Juvenility and maturity of plants as influenced by their ontogenetical and physiological ageing. Acta Hort. (ISHS) 1976;56:37–44. [Google Scholar]
- 43.Greenwood M.S. Juvenility and maturation in conifers: current concepts. Tree Physiol. 1995;15:433–8. doi: 10.1093/treephys/15.7-8.433. [DOI] [PubMed] [Google Scholar]
- 44.Poethig R. Phase change and the regulation of shoot morphogenesis in plants. Science. 1990;250:923–30. doi: 10.1126/science.250.4983.923. [DOI] [PubMed] [Google Scholar]
- 45.Van der Hoeven R., Ronning C., Giovannoni J., Martin G., Tanksley S. Deductions about the number, organization, and evolution of genes in the tomato genome based on analysis of a large expressed sequence tag collection and selective genomic sequencing. Plant Cell. 2002;14:1441–56. doi: 10.1105/tpc.010478. [DOI] [PMC free article] [PubMed] [Google Scholar]
- 46.McCourt R.M., Chapman R.L., Buchheim M., Mishler B.D. Green plants. 1996. http://tolweb.org/Green_plants/2382/1996.01.01. in The Tree of Life Web Project http://tolweb.org/
- 47.Uniprot taxonomy. http://www.uniprot.org/taxonomy/
- 48.Belaj A., Dominguez-García M., Atienza S., et al. Developing a core collection of olive (Olea europaea L.) based on molecular markers (DArTs, SSRs, SNPs) and agronomic traits. Tree Genet. Genomes. 2012;8:365–78. [Google Scholar]
Associated Data
This section collects any data citations, data availability statements, or supplementary materials included in this article.
Supplementary Materials
Data Availability Statement
The 454 sequenced read data reported in this manuscript have been deposited in the National Center for Biotechnology Information (NCBI) Sequence Read Archive and are available under the Accession Number (NCBI: SRA059461). The results from the assembly reported in this manuscript have been deposited in the NCBI Transcriptome Shotgun Assembly Archive and are available under the Accession Number (GABQ00000000).