Abstract
Mining operations are potential sources of airborne metal and metalloid contaminants through both direct smelter emissions and wind erosion of mine tailings. The warmer, drier conditions predicted for the Southwestern US by climate models may make contaminated atmospheric dust and aerosols increasingly important, with potential deleterious effects on human health and ecology. Fine particulates such as those resulting from smelting operations may disperse more readily into the environment than coarser tailings dust. Fine particles also penetrate more deeply into the human respiratory system, and may become more bioavailable due to their high specific surface area. In this work, we report the size-fractionated chemical characterization of atmospheric aerosols sampled over a period of a year near an active mining and smelting site in Arizona. Aerosols were characterized with a 10-stage (0.054 to 18 μm aerodynamic diameter) multiple orifice uniform deposit impactor (MOUDI), a scanning mobility particle sizer (SMPS), and a total suspended particulate (TSP) collector. The MOUDI results show that arsenic and lead concentrations follow a bimodal distribution, with maxima centered at approximately 0.3 and 7.0 μm diameter. We hypothesize that the sub-micron arsenic and lead are the product of condensation and coagulation of smelting vapors. In the coarse size, contaminants are thought to originate as aeolian dust from mine tailings and other sources. Observation of ultrafine particle number concentration (SMPS) show the highest readings when the wind comes from the general direction of the smelting operations site.
Keywords: Mining Operations, MOUDI, SMPS, Aerosol, Metal Contaminants, Metalloid Contaminants
1. Introduction
Mining operations are a potential source of particulate matter containing metal and metalloid contaminants, such as lead and arsenic. High winds and mining activities such as grinding, milling and mine tailings management create coarse particles (≥1 μm diameter) through mechanical action while smelting and refining can result in ultrafine (≤ 0.1 μm) and accumulation-mode (0.1 - 1.0 μm) particles by condensation of high temperature vapors and subsequent diffusion and coagulation (Jacob 1999, Banic et al. 2006, Wong et al. 2006, Zdanowicz et al. 2006). It has been estimated that 40% of the total atmospheric emissions of arsenic arise from smelting operations (Alloway and Ayres 1997).
Particle diameter affects the fate and transport of the aerosols. Small dust particles can be transported thousands of miles before being deposited. For example, Wilkening et al. (2000) reported satellite remote sensing images of trans-Pacific transport of aerosols in April 1998, originating from a massive dust storm in the Gobi desert. Aerosols can affect ecosystem health and biogeochemical cycles. Copper-containing aerosols have been found to exert toxic effects on marine phytoplankton (Paytan et al. 2009). Trace elements, including As, Pb and Cr, have been detected worldwide in cloud, fog, rain and snow, with mining activities in some cases cited as possible sources (Schemenauer and Cereceda 1992; Barbaris and Betterton 1996; Cherif et al. 1998; Rattigan et al. 2002; Mancinelli et al. 2005; Hutchings et al. 2009; Taylor et al. 2010). Furthermore, metal-containing aerosols can provide a catalytically active surface for heterogeneous reactions and affect significantly the cycles of atmospheric species (Dickerson et al. 1997).
The effects of urban aerosols on human health are well documented (Ning and Sioutas 2010, and references therein), although the precise mode of interaction is not known. Particle diameter affects aerosol deposition efficiency in the human respiratory system with coarse particles mainly deposited in the upper respiratory tract while fine particles are capable of being transported and deposited deep in the lungs where they can then be transported to the blood stream by macrophages (Park and Wex 2008; Valiulis et al. 2008; Krombach et al. 1997) or allow contaminants (e.g. metal and metalloid ions) to diffuse into the blood stream. Elevated blood lead levels and urinary arsenic have been observed in children living near nonferrous metal smelters, and this has been partly attributed to dust inhalation (Baker et al. 1977).
We hypothesize that atmospheric transport of aerosols from mining operations is an important source of contaminants (such as arsenic and lead) in specific communities of the arid US Southwest, and will become increasingly important with predicted drought intensification due to regional climate change. We have sampled atmospheric aerosols for a year near an active copper mine and smelter located in Hayden, Arizona. The main objective of our work was to determine the concentrations of metal and metalloid contaminants as a function of particle diameter as a means to better understand potential sources, transport and human toxicity.
The Hayden site is located approximately 80 km northeast of Tucson, Arizona. It is comprised of two towns – Hayden and Winkelman – with a combined population of approximately 1200. The site includes a concentrator, a smelter and tailings facilities. It is located at the confluence of the Gila and San Pedro Rivers and is characterized by complex terrain that gives rise to unusual wind patterns. Although it is not officially a Superfund site, it is currently administered through an Administrative Settlement Agreement and Order on Consent between EPA, ASARCO (the plant proprietor) and the Arizona Department of Environmental Quality. In 2005, soil analysis showed that arsenic, lead and copper levels exceeded their respective residential soil remediation levels and in 2008/9, topsoil was removed from over 260 residential properties that had relatively high concentrations of these elements (EPA 2008). The Environmental protection agency has reported elevated concentrations of arsenic, lead, copper, chromium and cadmium in atmospheric air samples in Hayden and Winkelman (EPA 2008).
2. Materials and Methods
2.1. Sampling
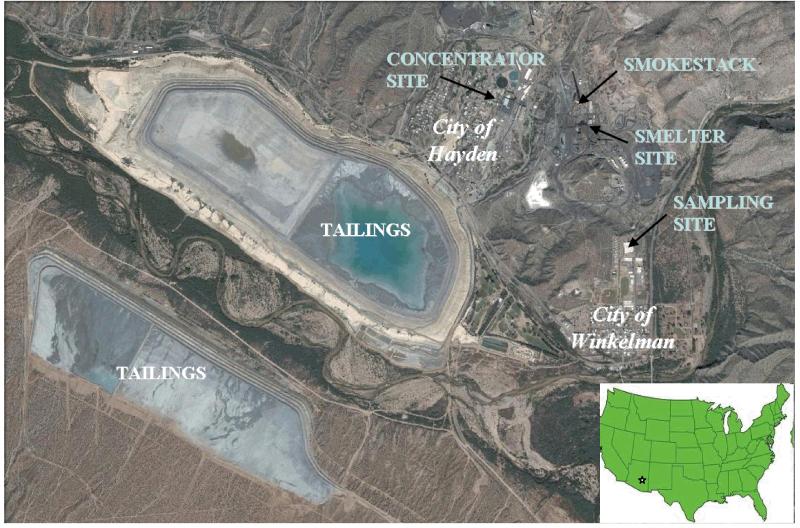
The main sampling site was located on the roof of the single-story Hayden High School building in Winkelman, Arizona, approximately 2 km from the mine tailings pile and 1 km from smelting operations, the main smokestack, and slag pile (Figure 1). A meteorological station and an EPA PM10 monitor are co-located at this site.
Figure 1.
Satelite map of Hayden-Winkelman, Arizona, with locations of mining and sampling operations. Top of the map is North and size of map is approximately 4.3 km by 6.6 km. The smokestack is 305 m tall. Terrain topography around the shown area is complex: elevation increases towards the North with a narrow valley extending in the NW-SE direction. Source: Google Maps.
A ten-stage micro-orifice uniform deposit impactor, MOUDI (M110-R, MSP Corporation, Minneapolis, Minnesota) (Marple et al. 1991) was used to collect aerosol samples. The MOUDI was operated at an air flow rate of 30 L min−1 for 96-hour sampling periods, which was determined to provide enough sample mass for subsequent analyses. The calibrated cut-points (d50-values) for the inlet and 10 stages of the MOUDI sampler are 18, 9.9, 6.2, 3.1, 1.8, 1.0, 0.55, 0.32, 0.18, 0.10 and 0.054 μm equivalent aerodynamic diameter. The MOUDI was protected from the weather by a metal box that had a 13-mm wide gap around the perimeter to ensure unimpeded sampling of even the coarsest particles.
For comparison purposes, total suspended particulates (TSP) were collected on pre-cleaned glass fiber filters (1 μm, 102 mm, Pall Corporation) with a portable high-volume air sampler (CF-1002BRL, HI-Q Environmental Products Company, San Diego, California) operated at a flow rate of 400 L min−1 for 24-hour sampling periods. Total suspended particulate samples were collected at three other field sites in southeast Arizona, including at the city of Green Valley, within 1.5 km of a metal-free mine tailings pile; at the city of Wilcox, near a natural dry lake bed (playa), which is an important natural source of dust; and in Tucson, on the roof of the Physics and Atmospheric Sciences building of The University of Arizona, a typical urban environment.
Teflon filter substrates (PTFE membrane, 2 μm pore, 46.2 mm, Whatman) were used in the MOUDI. The substrates were cleaned with deionized water and with methanol to remove any impurities. Teflon substrates were washed and dried in a particle-free laminar flow cabinet. They were transported to and from the field site with an impactor holder (MSP Corporation) for MOUDI substrates, and sealed envelopes for TSP filters. Occasionally, aluminum foil substrates (47 mm, MSP Corporation) were used in the MOUDI to facilitate microscopic analysis. A thin coating of heavy-duty silicone spray (MSP Corporation) was applied to prevent particle bounce.
The aerosol number concentration as a function of diameter was measured using a Scanning Mobility Particle Sizer (SMPS 3936L, TSI Inc.) system (Wang and Flagan 1990). The SMPS consists of an Electrostatic Classifier (TSI 3080) with a DMA (differential mobility analyzer) 3081 and a butanol-based condensation particle counter (CPC 3772, TSI Inc.). The classifier was operated at a sheath flow rate of 3 L min−1 and a sample flow rate of 0.3 L min−1, scanning up for 240 seconds and retracing for 50 seconds, resulting in a collection diameter range from 14 to 749 nm. The aerosol was collected through a 5.6 m copper sampling tube (GC grade, Ohio Valley Specialty Chemical, ID 4.83 mm). The penetration efficiency with respect to laminar diffusion for a sampling tube of this length is estimated to be 57.2% for 14 nm particles and 81.9 % for 30 nm particles (Hinds 1999). Given the very low relative humidity at this desert location (below 20% for most of the measurement period), no diffusion drying system was used.
Temperature, relative humidity, wind speed and wind direction were recorded with 5-second resolution by a weather station and data logger (CR800, Cambell Scientific, Logan, Utah). Wind speed and direction were analyzed using five-minute averages with WindRose Pro (Enviroware) software.
2.2. Sample Extraction
Substrates were transferred to sealed glass vials and extracted with aqua regia in a sonicator at 80°C for 60 min (Harper et al. 1983). Fifteen mL of aqua regia (1.03 M HNO3/2.23 M HCl trace metal grade) were used to extract the MOUDI substrates while 40 mL were used for the larger TSP filters. Extract aliquots of 1.2 mL were diluted to 4 mL with deionized water and then refrigerated prior to Inductively-Coupled Plasma Mass Spectrometry (ICP-MS) or Ion Chromatography (IC) analysis. The relative values of the field blanks were (As) 0.2 (Cd) 13.5, and (Pb) 8.3 expressed as the percentage of the annual mean maximum concentration found for any individual MOUDI size bin. The average relative standard deviation of the field blanks were 1.1, 10.6, 7.2 for As, Cd, and Pb, respectively. These values were found from the average of 36 blank samples that were taken for the yearlong sampling program. Blanks were subtracted from the field sample concentrations.
2.3. Sample Analysis
The ICP (Agilent 7500ce with an Octopole Reaction System) was tuned for robust plasma conditions to reduce matrix effects to 2% or less. Calibration standards were run every 20 samples and are certified AA or ICP standards from Aldrich made with milliQ water, 0.669 M HCl (Fisher, Trace-Metal Grade) and 0.309 M HNO3 (EMD, Omnitrace) to match MOUDI sample matrix. Additionally, NIST standard reference material (SRM 1643e Trace Elements in Water) was analyzed with each set of data. The separate MOUDI fractions yield size-fractionated mass concentration data for toxic metals and metalloids (mainly As, Pb, Cd). Size-fractionated concentrations of metal and other species in atmospheric samples have been reported before (e.g. Allen et al. 2001) but, to our knowledge, not in relation to mining operations.
For gravimetric analysis, samples were weighed using EPA Class I equivalent methods on an ultra-microbalance (Mettler Toledo XP2U) to weigh substrates before and after sampling. Mass loading on the substrates was used to convert concentrations from ng species/m3 of atmospheric air to ppm (mg species/kg dry solids).
Samples were characterized chemically and morphologically at University Spectroscopy and Imaging Facilities (USIF) of The University of Arizona using a combination of Field-Emission Scanning Electron Microscope (Hitachi S-4800 Type II SEM) and Electron Dispersive Spectroscopy (ThermoNORAN NSS EDS). The substrates were coated with a 10 nm layer of platinum (Hummer 6 Sputtering Device).
The SMPS raw particle counts were processed through the TSI Aerosol Instrument Manager software, which includes a multiple charge correction and a correction for diffusion losses within the SMPS itself.
3. Results and Discussion
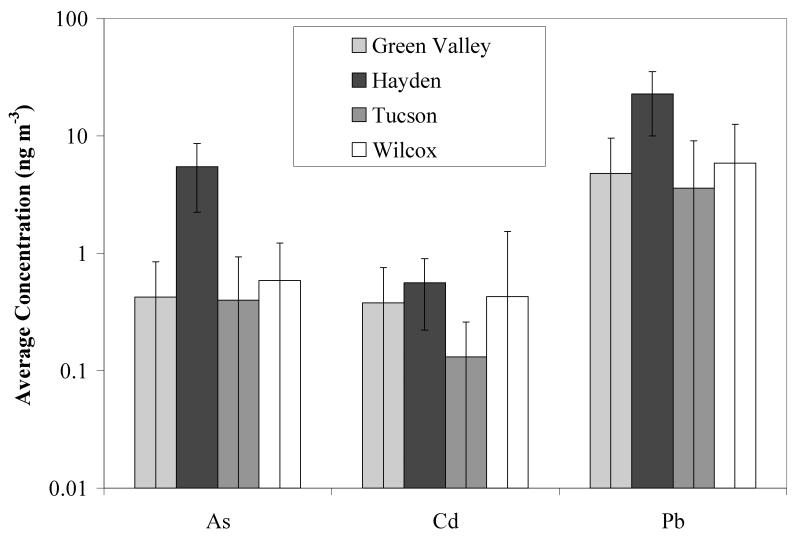
The concentrations of As and Pb observed in TSP at the Hayden site are consistently higher than those observed at other sites in southeastern Arizona (Figure 2). On average, both arsenic and lead concentrations are at least 9 and 4 times higher, respectively, in Hayden than at Green Valley, Wilcox or Tucson, while cadmium is not significantly different. Though the Green Valley site is adjacent to mine tailings, independent analysis has shown that these tailings contain only background levels of As, Pb and Cd. Even though the Hayden concentrations are elevated, lead, at 23 ng/m3, is below the EPA annual-average standard of 150 ng/m3 (EPA 2008a). There are no standards for atmospheric arsenic in the US. The European Union has set a target value of 6 ng/m3 (annual average), which has been suggested for enforcement in 2012 (EU 2008). The World Health Organization (Krzyzanowski and Cohen 2008) has set a guideline for arsenic of 0.66 ng/m3, based on estimates that this concentration represents a 1:1,000,000 lifetime risk level. The EPA Regional Residential Air Screening Level for As (in PM10, not TSP) is 0.57 ng/m3, which is only slightly exceeded at the Wilcox site, but is exceeded at the Hayden site by an order of magnitude (Figure 2).
Figure 2.
Comparisons of As, Cd and Pb content in atmospheric air (TSP samples). Values are averages over ten 24-hour sampling periods at various sites in Southeast Arizona from July to December 2009. Error bars represent standard deviations over the ten sampling periods.
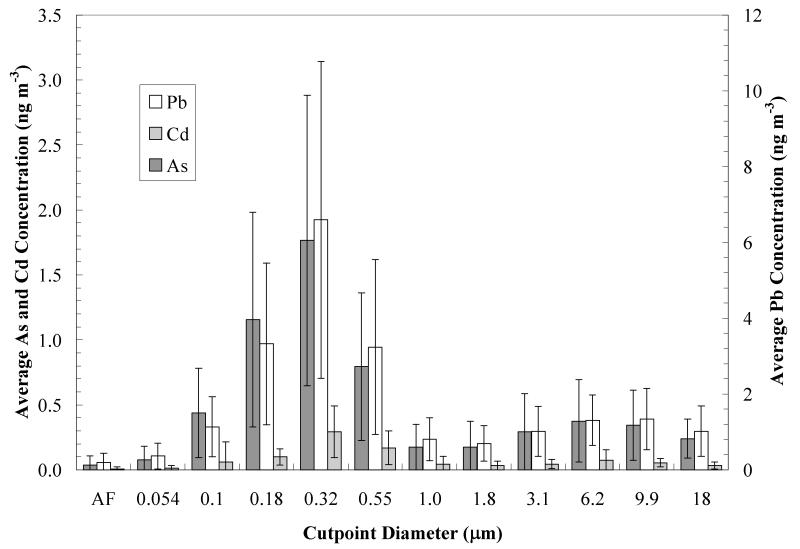
The MOUDI measurements from December 2008 through November 2009 at the Hayden site for thirty six 96-hour sampling periods are summarized in Figure 3. Contaminant concentrations follow a bimodal distribution, with means around 0.3 μm and 7 μm diameter. Although there is a wide range of variability, the bimodal nature of the distribution is generally preserved in all samples (results not shown; see Figure 6 and discussion below for data from a single sampling period). The total arsenic and lead concentrations in the size fraction (< 1 μm) are 4.3±1.9 and 14.9±7.5 ng/m3, respectively and in the size fraction (>1 μm) are 1.6±0.8 and 6.2±1.7 ng/m3, respectively. It is clear that the fine particle size (< 1 μm) fraction represents the most important contribution of these contaminants to atmospheric air at the site.
Figure 3.
Annual averaged lead, arsenic and cadmium concentrations from MOUDI observations at the Hayden site for the period December 2008 through November 2009. Data represent average concentrations over thirty six 96-hour sampling periods; AF denotes after filter sample.
Figure 6.
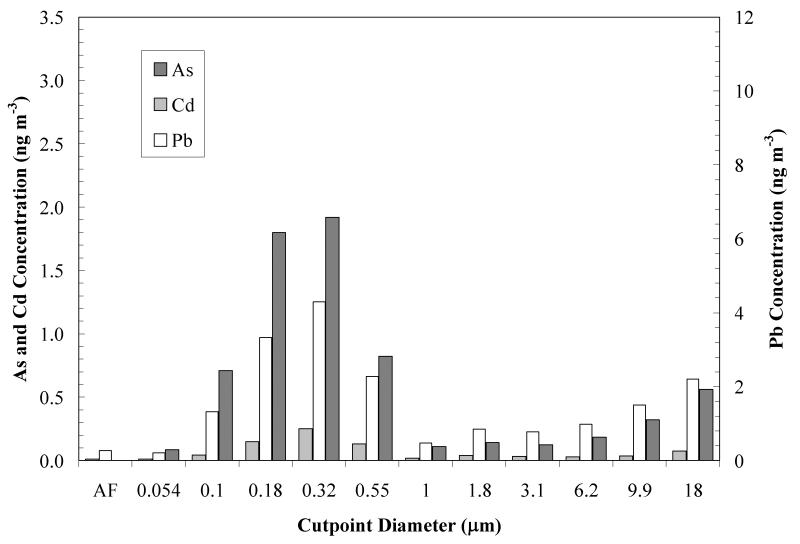
Lead, arsenic and cadmium concentrations from MOUDI observations at the Hayden site for a single 96-hour sampling period starting on October 14, 2009.
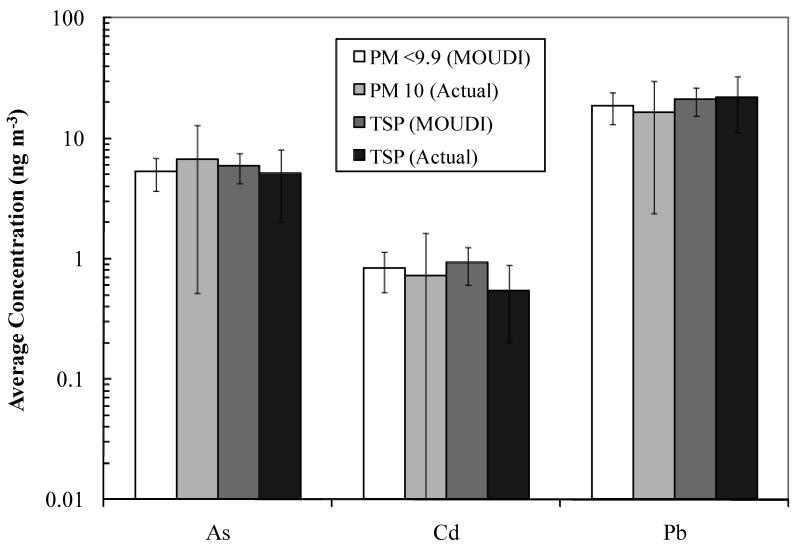
To validate the MOUDI data, observed values of PM9.9 (i.e., the sum of all fractions ≤ 9.9 μm diameter as obtained with the MOUDI sampler) were compared with the co-located EPA PM10 monitor and our TSP collector. Although the size fractions are not exactly coincident, the averaged results show excellent agreement (Figure 4). A t-test for two sample sets assuming unequal variances was performed. All sets proved to accept the null hypothesis with p>0.05 except for the comparison of Cd – TSP. The results from the statistical analysis are as follows: MOUDI compared to TSP: p = 0.43 (As), 0.008 (Cd), and 0.76 (Pb); MOUDI compared to PM10: p=0.17 (As), 0.49 (Cd), and 0.41 (Pb) with all values reported for two-tailed test. Therefore, it can be inferred that the three measurements techniques are not statistically different, except for the TSP and MOUDI measurements of cadmium.
Figure 4.
Comparisons of metal and metalloid content of MOUDI samples with PM10 data from EPA, and TSP observations at the Hayden site. Samples were taken between December 2008 and November 2009 for 36 and 55 sampling periods for the MOUDI and PM10 monitor, respectively. The TSP concentrations were averaged for 18 sampling periods spanning July 2009 to March 2010. Sampling periods may not have occurred on the exact same days. For MOUDI samples, PM9.9 represents the average of the summed mass concentrations in the corresponding size range, and TSP represents the average total concentration.
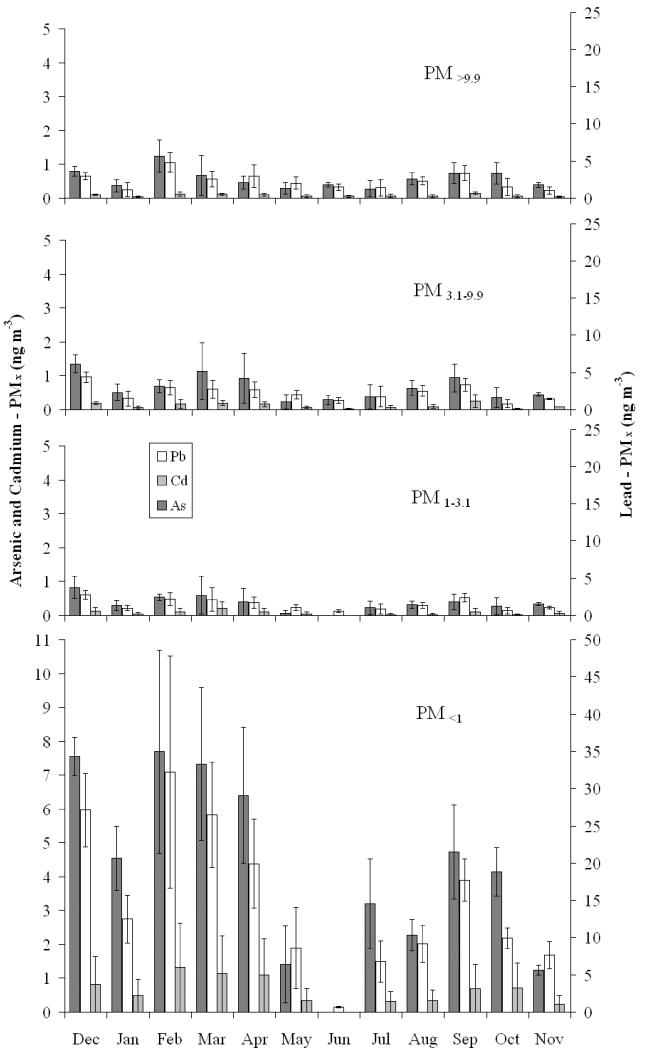
Measurements using the MOUDI over a full calendar year were divided into a time series by particle diameter to observe possible seasonal changes. Figure 5 shows the monthly averaged concentrations for arsenic, cadmium and lead in different size ranges. These results emphasize that Pb, As and Cd are found predominantly in the fine particle size range. A seasonal dependence is observed for all PM diameters, with lower concentrations obtained during the summer months (May-August) and higher during the winter. Precipitation rates were appreciably higher in the summer than for the rest of the year for the area, which might explain, in part, the lower concentrations in the summer months, owing to rain-induced particle deposition. A more likely explanation is the strong convective mixing and consequent dilution that occurs during summer.
Figure 5.
Monthly averages of arsenic, cadmium, and lead PMx measured with the MOUDI sampler at the Hayden site from December 2008 to November 2009. The size ranges are defined as follows: PM<9.9 is the summation of cutpoint diameters 9.9 and 18 μm, PM3.1-9.9 is the summation of cutpoint diameters 3.1 and 6.1μm, PM1-3.1 is the summation of cutpoint diameters 1 and 1.8μm, and PM<1 is the summation of cutpoint diameters lower than 1μm.
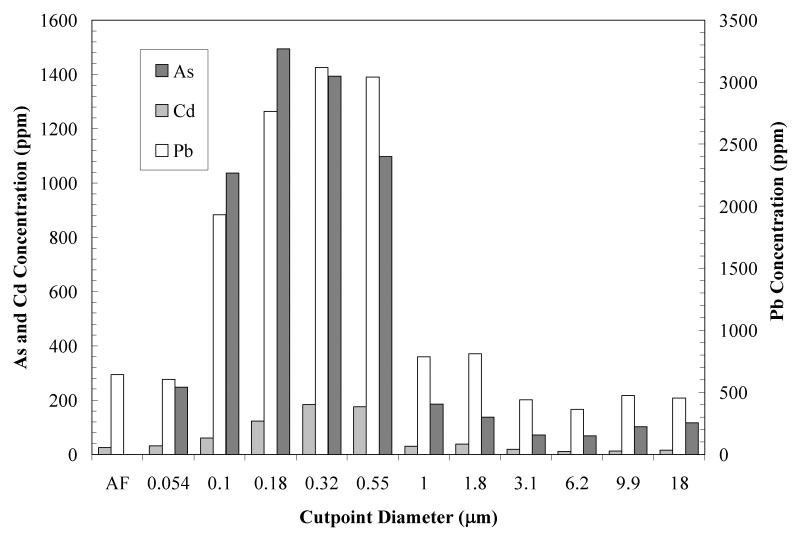
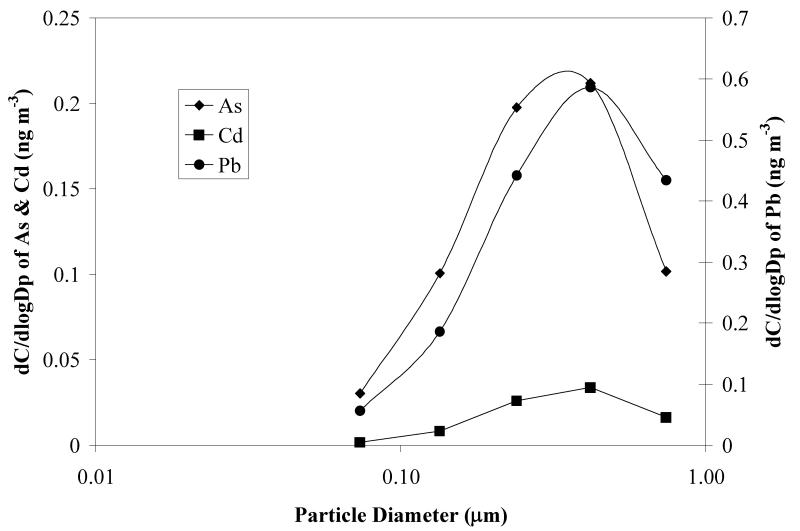
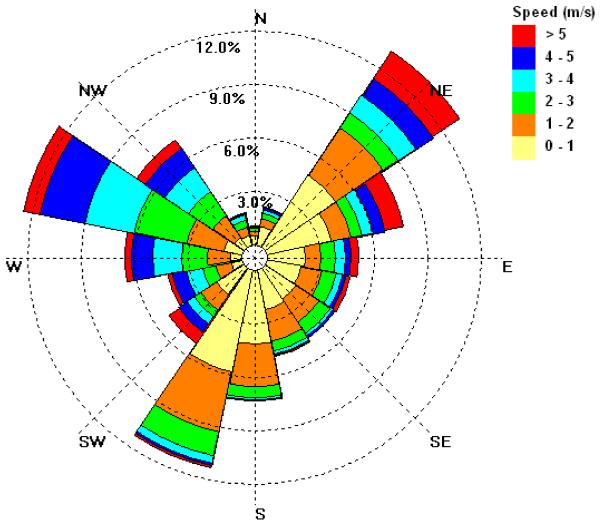
Metal and metalloid concentrations reported above have been expressed as ng of contaminant per unit m3 of air (MOUDI data for a representative single sampling period are shown in Figure 6). Gravimetric measurements of the total solid mass collected at each stage of the MOUDI sampler allowed us to calculate intrinsic solids concentrations (mg contaminant/kg dry solid) for the contaminants. Figure 7 shows results corresponding to the data in Figure 6. In this particular example, maximum concentrations occur at cutpoint diameters of 0.32 and 18 μm. According to Shacklette and Boerngen (1984), Western United States soils have a geometric mean of 5.5 ppm arsenic (range <0.10 to 97 ppm). Surface soils taken from residential and non-residential sites in Hayden and Winkelman before remediation had levels for arsenic and lead of 60 ± 124 ppm and 1,939 ± 11,164 ppm, respectively (EPA 2008). Mine tailings from the Hayden site were found to have 14.0 ± 6.8 ppm and 46.4 ± 33.7 ppm of arsenic and lead, respectively (EPA 2008). The results in Figure 7 show highly enriched concentrations in the range of particle diameters between 0.1 and 0.55 μm, when compared to area soils and tailings. This suggests that soil and mine tailings are not the source of these particles. It is likely that these particles are a consequence of condensation and agglomeration of particles formed from smelting operation emissions. From the single sampling period discussed, a log-normal distribution plot was generated for particle size <1 μm for As, Pb, and Cd (Figure 8). The mean diameter of the distribution was found to be 0.17 μm and the geometric standard deviation was 2.68. The near symmetry of the As and Pb curves indicates a log-normal distribution for the concentration of the respective metals. Figure 9 shows the wind rose developed for the same sampling period. Relatively high wind speeds were seen in the general direction of the mine tailings (WNW, Figure 1) for this MOUDI sampling period, which could have produced a higher collection of larger wind-swept particles when compared to the annual average.
Figure 7.
Solids concentrations of lead, arsenic and cadmium in MOUDI samples taken at the Hayden site for a 96-hour sampling period starting on October 14, 2009. These concentrations were obtained by dividing the concentrations in Figure 5 for each particle size range by the total mass of particles per unit air volume in the same size range.
Figure 8.
Log-normal plot of lead, arsenic and cadmium concentrations for particle diameters <1 μm in MOUDI samples taken at the Hayden site for a 96-hour sampling period starting on October 14, 2009 (Figure 6). From these results, the calculated mean diameter is 0.17 μm and the geometric standard deviation is 2.68.
Figure 9.
Wind rose obtained from the weather station co-located with the MOUDI sampler for the 96-hour sampling period starting on October 14, 2009 (corresponding to data in Figures 6 to 8). The results show a relatively high frequency of high wind speeds (> 3 m/s) from the WNW direction, which corresponds with the orientation of the mine tailings with respect to the sampler.
The annual-average (Figure 3) MOUDI coarse (>1 μm) and fine (<1 μm) size fraction data were compared to Hayden tailings analysis performed by the EPA in terms of arsenic to lead concentration ratios (EPA 2008). The EPA reported tailings ratio was 0.39 ±0.27. From our measurements, the coarse aerosol As/Pb ratio was 0.26±0.14 and the fine aerosol ratio was 0.29±0.20. These values suggest that arsenic and lead in aerosol might not have generated exclusively from mine tailings, although ranges overlap. It is somewhat surprising that the ratios for the two particle diameter fractions in our measurements are so similar, which makes source apportionment inconclusive. Lead isotope ratios have been use for source apportionment in the past (e.g. Cheng et al. 2010). We will quantify lead isotope ratios for our samples in future work.
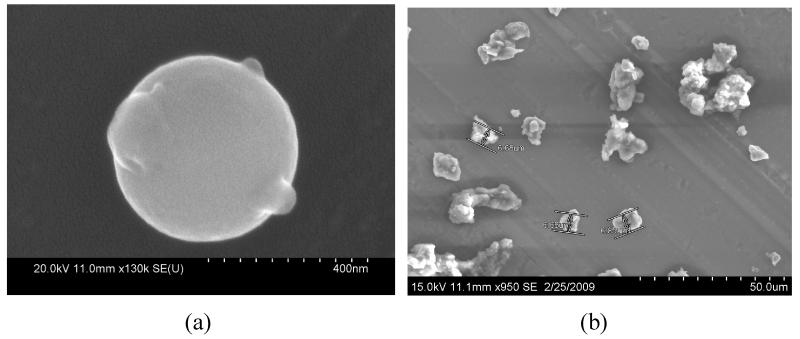
Scanning electron microscopy images from MOUDI samples collected on aluminum foil filters are shown in Figure 10. Utilizing electron dispersive spectroscopy, the spherical particle in Figure 10 (a) was found to contain 21.19± 4.45 % lead by weight, and similar spherical particles, which were ubiquitous in sub-micron samples, were found to contain 10-20% lead by weight and 0-10% arsenic by weight. The sphericity of the particle suggests that it was formed by gas-to-particle transformation of a high temperature vapor. The particle in Figure 10 (a) has a diameter of about 0.5 μm, and it was collected on a stage with a cutpoint diameter of 0.32 μm. This accumulation range diameter also suggests an atmospheric condensation/coagulation mechanism (Seinfeld and Pandis, 1998), which have been directly observed to form aerosol from smelting plumes (Roberts and Williams, 1979). Figure 10 (b) shows particles collected on a stage with a cutpoint diameter of 6.1 μm. The irregular morphology of these particles suggests that they originated by mechanical action such as crushing, grinding or windblown dust, and were probably sourced from the tailings site and or from waste materials on the smelter and concentrator sites (Figure 1).
Figure 10.
Scanning Electron Microscope images from MOUDI stages with cutpoint particle diameter of (a) 0.32 μm, particle depicted was identified to contain 21.19± 4.45 % Pb by weight by Electron Dispersive Spectroscopy; and (b) 6.1 μm.
A correlation analysis between metals and metalloids for each size range of the MOUDI has been performed to identify the number of possible sources that contribute to atmospheric contamination around the site. Tables 1 and 2 present inter-element correlation matrices for particles with diameters <1 μm and >1 μm, respectively. The tables report linear correlation coefficients, R, between the concentrations of element pairs. The results show that Al-Sc-Mg and Cd-Pb-As are strongly correlated for all particles. The As, Cd, and Pb inter-dependence in the fine particle size fraction (<1 μm), could indicate that these three elements come from the same source, possibly the smelting area. This correlation, however, is also strong in the coarse particle size fraction (>1 μm). However, this could be a consequence of coagulation of fine particles into larger particles and/or sedimentation on area soils where fine-sized particles deposit on coarse particles that then become wind-blown dust. It is also suspected that the groups where Cu is present come from mining activity (i.e. mechanical action) and that the Fe-Mg, Cr-Fe, Al-Sc, Sc-Fe, and Mg-Al correlation may be of soil origin (e.g. tailings). More specific information that leads to direct source apportionment can be gained by relating size-resolved contaminant concentrations with wind patterns at the site, which we are currently investigating.
Table 1. Inter-element correlation matrix for particles < 1 μm obtained from MOUDI samples for all the sampling periods. Values represent the linear coefficient of correlation (R) between elements in pairs. The shaded fields indicate the strongest correlations (R>0.7).
| Be | Mg | Al | Sc | Fe | Cu | As | Cd | Pb | |
|---|---|---|---|---|---|---|---|---|---|
| Be | 0.221 | 0.194 | 0.237 | 0.225 | 0.281 | 0.367 | 0.589 | 0.539 | |
| Mg | 0.859 | 0.845 | 0.741 | 0.545 | 0.082 | 0.086 | 0.094 | ||
| Al | 0.887 | 0.473 | 0.506 | 0.023 | 0.109 | 0.157 | |||
| Sc | 0.424 | 0.402 | -0.051 | 0.05 | 0.103 | ||||
| Fe | 0.552 | 0.304 | 0.256 | 0.226 | |||||
| Cu | 0.596 | 0.643 | 0.686 | ||||||
| As | 0.893 | 0.931 | |||||||
| Cd | 0.931 | ||||||||
| Pb |
Table 2. Inter-element correlation matrix for particles > 1 μm obtained from MOUDI samples for all the sampling periods. Values represent the linear coefficient of correlation (R) between elements in pairs. The shaded fields indicate the strongest correlations (R>0.7).
| Be | Mg | Al | Sc | Fe | Cu | As | Cd | Pb | |
|---|---|---|---|---|---|---|---|---|---|
| Be | 0.334 | 0.232 | 0.31 | 0.467 | 0.374 | 0.231 | 0.454 | 0.432 | |
| Mg | 0.895 | 0.916 | 0.864 | 0.443 | -0.114 | -0.116 | -0.093 | ||
| Al | 0.895 | 0.686 | 0.516 | -0.02 | -0.01 | 0.035 | |||
| Sc | 0.774 | 0.472 | -0.141 | -0.114 | -0.05 | ||||
| Fe | 0.507 | -0.043 | 0.006 | 0.007 | |||||
| Cu | 0.513 | 0.584 | 0.618 | ||||||
| As | 0.894 | 0.936 | |||||||
| Cd | 0.936 | ||||||||
| Pb |
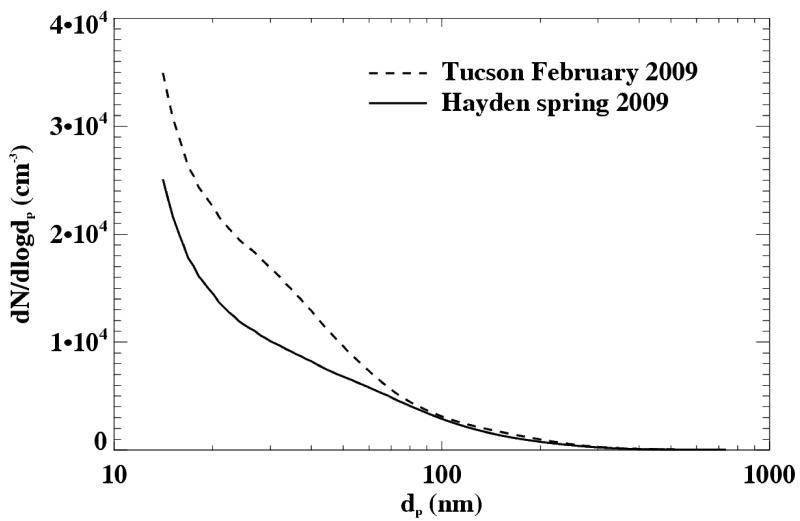
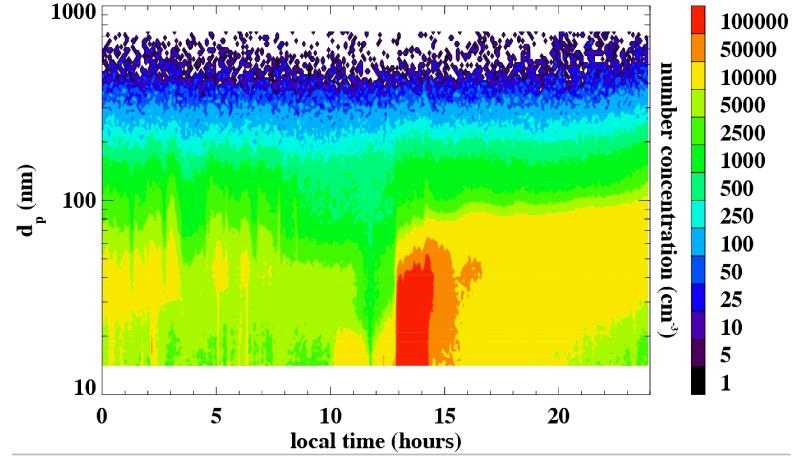
Aerosol number distributions were measured continuously from March 17 through May 20, 2009, and from September 30 through November 11, 2009 at the Hayden site, using the SMPS. With 288 5-minute scans per day, a high time resolution was achieved compared to the MOUDI 96-hour sample and the TSP 24-hour sample, which yields the short term evolution of the local aerosol size distribution. Figure 11 shows the average of all size distributions over the entire spring measurement period. For comparison, size distributions from an urban location in the city of Tucson, averaged over a 17-day time period, are shown. The Tucson size distribution reflects the higher number concentrations that would be expected in an urban location due to multiplicity of delocalized sources. The Hayden size distribution shows lower overall concentrations, which could reflect absence of widespread vehicle and industrial activity, but number concentrations in the ultrafine size range that are relatively high. Since the lifetime of such small particles is short (on the order of an hour for concentrations typically observed at Hayden), this could indicate the influence of a local source (primary or gas-to particle conversion from smelting operations), as opposed to long range transport. Episodes of high concentrations of ultrafine particles (nucleation events) within daily cycles (Figure 12) were observed frequently at the Hayden site. Similar observations of nucleation events have been made by Stanier et al. (2004a,b) in Pittsburgh, PA, and were attributed to sulfuric acid production. Sulfuric acid is a product of the smelting process in Hayden, which is thought to reach high concentrations in the ambient air.
Figure 11.
Average SMPS size distribution over one MOUDI measurement period (March 17 through May 20, 2009) compared to an average (February 25 through March 13, 2009) from the city of Tucson.
Figure 12.
A full day of size distribution data (SMPS measurements for April 18, 2009). Note the relatively high concentrations of 14 – 50 nm particles, starting at 1 pm.
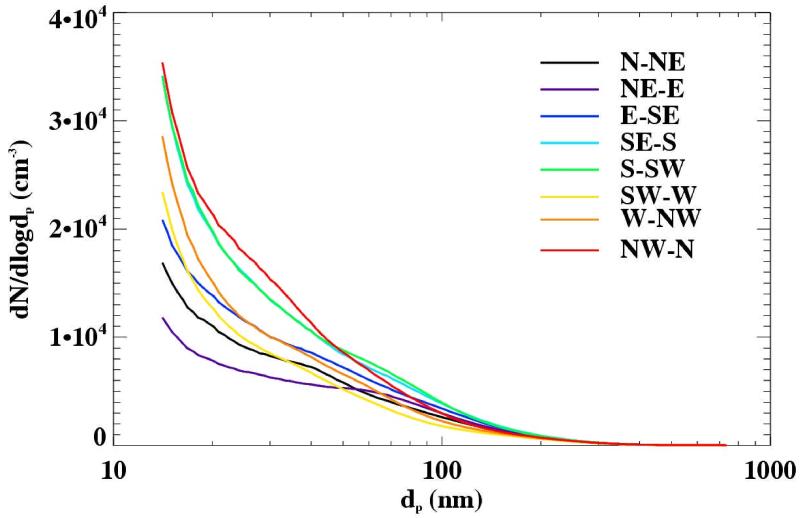
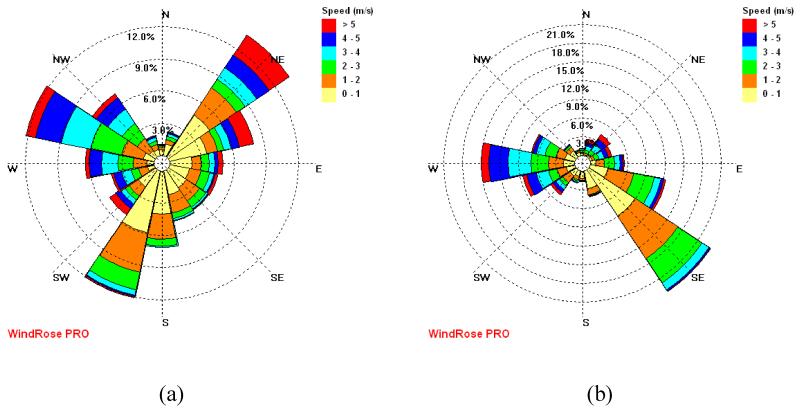
The size resolved number concentrations were averaged by wind direction over the entire spring measurement period, using data from the weather station located at the Hayden site (Figure 13). The highest concentration of fine particles can be seen from the NW - N direction, which in relation to the SMPS is the general direction of the smelting operations (Figure 1). The lowest concentrations of fine particles were observed for winds from N to E, an area characterized by open desert, a river valley and little human influence. It is important to point out, however, that the topography of the Hayden/Winkelman site is complex, with two river valleys, hills and mountains channeling wind patterns. Figure 14 shows two wind roses, one located in Hayden and the other located less than two miles away in Winkelman at the sampling site (Figure 1), from identical sampling periods. Note that they have wind patterns that are appreciably different.
Figure 13.
Aerosol number size distributions as a function of wind direction for the measurement period March 17 through May 20, 2009.
Figure 14.
Wind roses from two weather stations located within two miles of each other for December 2008 through November 2009: (a) Winkelman, where the MOUDI is located, and (b) Hayden, where the smelter is located. Differences show the complex terrain’s effect on wind patterns.
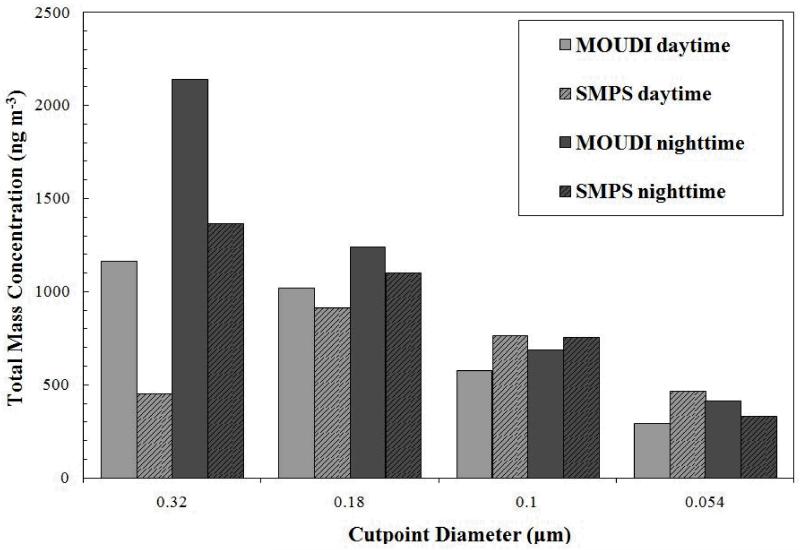
A preliminary comparison of mass distributions between the SMPS and the MOUDI is shown in Figure 15. The detection ranges of the two instruments had an overlap in the size range from 54 to 320 nm. The SMPS number distributions were converted to volume distributions, averaged in time over the MOUDI sampling period and in size over MOUDI stage diameter ranges. A particle density of 1.5 g/cm3 was assumed to convert the volume distribution into a mass distribution. It can be seen that the general features of the mass distribution measured by the MOUDI is reproduced by the SMPS data except at 0.32 μm.
Figure 15.
Estimate of mass concentrations from and SMPS volume distributions assuming a density of 1.5 g/cm3 and using MOUDI gravimetric analysis.
4. Concluding Remarks
The results presented in this work indicate that atmospheric aerosols in the vicinity of mining operations contain higher concentrations of arsenic, lead and cadmium than what would be expected from natural background values. A bimodal distribution with respect to particle diameter is seen for the three elements, with maximum concentrations occurring at a cutpoint diameter of 0.32 μm. To our knowledge, this is the first time that size-resolved characterization of metals and metalloids has been reported in the vicinity of mining operations. Evidence presented suggests that the fine particle diameter maximum in species concentration corresponds to particles produced by vapor condensation and coagulation, which would be consistent with sources related to smelting operations that include emission of high-temperature vapors. Presence of arsenic, lead and cadmium in the coarse particle size range, as well as particle morphology, suggests a local source of windblown dust. High correlation coefficients among contaminants (As, Cd and Pb) in both the fine and coarse particle size ranges indicates a unique source, which would be the case if windblown dust particles acquire aerosol contaminants via deposition of fine particles.
Acknowledgements
This work was supported by grant number P42 ES04940 from the National Institute of Environmental Health Sciences (NIEHS), National Institutes of Health (NIH). The views of authors do not necessarily represent those of the NIEHS, NIH. The authors are grateful to Ms. Leah Butler of EPA Region 9 and gratefully acknowledge the work by University Spectroscopy and Imaging Facilities (USIF), Tucson, AZ (http://usif.arizona.edu/).
References
- Allen AG, Nemitz E, Shi JP, Harrison RM, Greenwood JC. Size distributions of trace metals in atmospheric aerosols in the United Kingdom. Atmospheric Environment. 2001;35:4581–4591. [Google Scholar]
- Alloway BJ, Ayres DC. Chemical Principles of Environmental Pollution. Blackie Academic & Professional; New York: 1997. [Google Scholar]
- Baker EL, Hayes CG, Landrigan PJ, Handke JL, Leger RT, Housworth WJ, Harrington JM. A nationwide survey of heavy metal absorption in children living near primary copper, lead, and zinc smelters. American Journal of Epidemiology. 1977;106:261–273. doi: 10.1093/oxfordjournals.aje.a112462. [DOI] [PubMed] [Google Scholar]
- Banic C, Leaitch WR, Strawbridge K, Tanabe R, Wong H, Gariépy C, Simonetti A, Nejedly Z, Campbell JL, Lu J, Skeaff J, Paktunc D, MacPherson JI, Daggupaty S, Geonac’h H, Chatt A, Lamoureux M. The physical and chemical evolution of aerosols in smelter and power plant plumes: an airborne study. Geochemistry: Exploration, Environment, Analysis. 2006;6:111–120. [Google Scholar]
- Barbaris B, Betterton EA. Initial snow chemistry survey of the Mogollon Rim in Arizona. Atmospheric Environment. 1996;30:3093–3103. [Google Scholar]
- Cheng H, Hu Y. Lead (Pb) isotopic fingerprinting and its applications in lead pollution studies in China: A review. Environmental Pollution. 2010;158:1134–1146. doi: 10.1016/j.envpol.2009.12.028. [DOI] [PubMed] [Google Scholar]
- Cherif S, Millet M, Sanusi A, Herckes P, Wortham H. Protocol for analysis of trace metals and other ions in filtered and unfiltered fogwater. Environmental Pollution. 1998;103:301–308. [Google Scholar]
- Dickerson RR, Kondragunta S, Stenchikov G, Civerolo KL, Doddridge BG, Holben BN. The impact of aerosols on solar ultraviolet radiation and photochemical smog. Science. 1997;278:827–830. doi: 10.1126/science.278.5339.827. [DOI] [PubMed] [Google Scholar]
- Environmental Protection Agency (EPA) ASARCO Hayden Plant: Site Overview. 2008 http://yosemite.epa.gov/r9/sfund/r9sfdocw.nsf/ce6c60ee7382a473882571af007af70d/3940634 a9aec311e88257478006736ce!OpenDocument. [Google Scholar]
- Environmental Protection Agency (EPA) Lead in Air: Regulatory Actions. 2008 http://www.epa.gov/oaqps001/lead/actions.html. [Google Scholar]
- European Union (EU) Air Quality: Existing Legislation. 2008 http://ec.europa.eu/environment/air/quality/legislation/existing_leg.htm. [Google Scholar]
- Harper SL, Walling JF, Holland DM, Pranger LJ. Simplex optimization of multielement ultrasonic extraction of atmospheric particulates. Analytical Chemistry. 1983;55:1553–1557. [Google Scholar]
- Hinds WC. Aerosol Science and Technology. 2nd edition John Wiley & Sons; New York: 1999. [Google Scholar]
- Hutchings L, Roberts MR, Verheye HM. Marine environmental monitoring programmes in South Africa: a review. South African Journal of Science. 2009;105:94–102. [Google Scholar]
- Jacob DJ. Introduction to atmospheric chemistry. Princeton University Press; Princeton, NJ: 1999. [Google Scholar]
- Krombach F, Münzing S, Allmeling AM, Gerlach JT, Behr J, Dörger M. Cell size of alveolar macrophages: an interspecies comparison. Environmental Health Perspectives. 1997;105:1261–1263. doi: 10.1289/ehp.97105s51261. [DOI] [PMC free article] [PubMed] [Google Scholar]
- Krzyzanowski M, Cohen A. Update of WHO air quality guidelines. Air Quality, Atmosphere & Health. 2008;1:7–13. [Google Scholar]
- Mancinelli V, Decesari S, Facchini MC, Fuzzi S, Mangani F. Partitioning of metals between the aqueous phase and suspended insoluble material in fog droplets. Annali di Chimica. 2005;95:275–290. doi: 10.1002/adic.200590033. [DOI] [PubMed] [Google Scholar]
- Marple VA, Rubow KL, Behm SM. A microorifice uniform deposit impactor (MOUDI) - description, calibration, and use. Aerosol Science and Technology. 1991;14:434–446. [Google Scholar]
- Ning Z, Sioutas C. Atmospheric processes influencing aerosols generated by combustion and the inference of their impact on public exposure: a review. Aerosol and Air Quality Research. 2010;10:43–58. [Google Scholar]
- Park SS, Wex AS. Size-dependent deposition of particles in the human lung at steady-state breathing. Journal of Aerosol Science. 2008;39:266–276. [Google Scholar]
- Paytan A, Mackey KRM, Chen Y, Lima ID, Doney SC, Mahowald N, Labiosa R, Post AF. Toxicity of atmospheric aerosols on marine phytoplankton. Proceedings of the National Academy of Sciences. 2009;106:4601–4605. doi: 10.1073/pnas.0811486106. [DOI] [PMC free article] [PubMed] [Google Scholar]
- Rattigan OV, Mirza MI, Ghauri BM, Khan AR, Swami K, Yang K, Husain L. Aerosol sulfate and trace elements in urban fog. Energy Fuels. 2002;16:640–646. [Google Scholar]
- Roberts DB, Williams DJ. The kinetics of oxidation of sulphur dioxide within the plume from a sulphide smelter in a remote region. Atmospheric Environment. 1979;13:1485–1499. [Google Scholar]
- Schemenauer RS, Cereceda P. Monsoon cloudwater chemistry on the Arabian Peninsula. Atmospheric Environment. 1992;26:1583–1587. [Google Scholar]
- Seinfeld JH, Pandis SN. Atmospheric Chemistry and Physics: From Air Pollution to Climate Change. Wiley; New York: 1998. [Google Scholar]
- Shacklette HT, Boerngen JG. Element concentrations in soils and other surficial materials of the conterminous United States. U.S. Geological Survey Professional Paper. 1984;1270:105. [Google Scholar]
- Stanier CO, Khlystov AY, Pandis SN. Ambient aerosol size distributions and number concentrations measured during the Pittsburgh Air Quality Study (PAQS) Atmospheric Environment. 2004a;38:3275–3284. [Google Scholar]
- Stanier CO, Khlystov AY, Pandis SN. Nucleation Events during the Pittsburgh Air Quality Study (PAQS): description and relation to key meteorological, gas phase and aerosol parameters. Aerosol Science and Technology. 2004b;38:253–264. [Google Scholar]
- Taylor MP, Mackay AK, Hudson-Edwards KA, Holz E. Soil Cd, Cu, Pb and Zn contaminants around Mount Isa city, Queensland, Australia: Potential sources and risks to human health. Applied Geochemistry. 2010;25:841–855. [Google Scholar]
- Valiulis D, Sakalys J, Plauskaite K. Heavy metal penetration into the human respiratory tract in Vilnius. Lithuanian Journal of Physics. 2008;48:349–355. [Google Scholar]
- Wang SC, R C. Flagan. Scanning Electrical Mobility Particle Spectrometer. Aerosol Science and Technology. 1990;13:230–240. [Google Scholar]
- Wilkening KE, Barrie LA, Engle M. Atmospheric science: trans-Pacific air pollution. Science. 2000;290:65–67. doi: 10.1126/science.290.5489.65. [DOI] [PubMed] [Google Scholar]
- Wong HKT, Banic CM, Robert S, Nejedly Z, Campbell JL. In-stack and in-plume characterization of particulate metals emitted from a copper smelter. Geochemistry: Exploration, Environment, Analysis. 2006;6:131–137. [Google Scholar]
- Zdanowicz CM, Banic CM,, Paktunc DA. Metal emissions from a Cu smelter, Rouyn-Noranda, Québec: characterization of particles sampled in air and snow. Geochemistry: Exploration, Environment, Analysis. 2006;6:147–162. [Google Scholar]


