

Abstract
The Myc transcription factor is commonly dysregulated in many human cancers, including breast carcinomas. However, the precise role of Myc in the initiation and maintenance of malignancy is unclear. In this study we compared the ability of wild-type Myc (wt Myc) or Myc phosphorylation deficient mutants (T58A, S62A or T58A/S62A) to immortalize and transform human mammary epithelial cells (HMECs). All Myc constructs promoted cellular immortalization. As previously reported in other cells, the Myc T58A mutant tempered apoptotic responses and increased Myc protein stability in HMEC cells. More importantly, we now show that HMECs overexpressing the Myc T58A mutant acquire a unique cellular phenotype characterized by cell aggregation, detachment from the substrate and growth in liquid suspension. Coincident with these changes, the cells become anchorage-independent for growth in agarose. Previous studies have shown that wt Myc can collaborate with hTERT in inducing HMEC anchorage-independent growth. We have verified this observation and further shown that Myc T58A was a stronger facilitator of such co-transformation. Thus, our findings indicate that differences in Myc protein phosphorylation modulate its biological activity in human breast epithelial cells and specifically that the T58A mutation can facilitate both cellular immortalization and transformation. Finally, we used the isogenic cell lines generated in this study to identify a subset of genes whose expression is greatly altered during the transition from the immortal to the anchorage-independent states.
Keywords: Mammary cells, Myc, immortalization, anchorage-independent growth, phosphorylation
Introduction
Cellular immortalization is a critical step in the oncogenic progression of a normal cell [1]. In order for cells to become immortalized, they first must bypass cellular senescence, which is a non-replicative state reached by cells following a finite number of divisions [2, 3]. Cultured human mammary epithelial cells (HMECs) undergo senescence in two distinct stages [4–6]. The first stage has recently been termed stasis [7], although it also is referred to as senescence or selection. While most cells cease proliferating at this point, a subpopulation can bypass stasis and continue to grow [4–6]. These HMECs are characterized by a loss of p16INK4A expression caused by promoter methylation [5, 8, 9] and are referred to as post-selection HMECs. Post-selection HMECs divide until they reach agonescence, a state characterized by shortened telomeres, genomic instability and senescent phenotypes [6, 10].
Although no post-selection HMECs have been reported to bypass agonescence spontaneously [11], the addition of a single oncogene can allow growth past this barrier, thus leading to HMEC immortalization. Examples of such oncogenes include the human papillomavirus E6 gene [12], human telomerase reverse transcriptase (hTERT) [13], the zinc-finger protein ZNF217 [14], the transcription repressor Bmi-1 [15] and the transcription factor Myc [16]. In addition to immortalization, another key characteristic of oncogenic cells is the capability for anchorage-independent growth [1]. In general, many immortalized HMEC lines lack this capability [12, 15, 17]. Several groups, however, have generated fully-transformed HMECs using two or more oncogenes [17–22]. Interestingly, limited evidence exists that overexpression of a single gene, Wnt-1, can lead to HMEC transformation [23].
The Myc oncogene is overexpressed in many types of human cancer, including breast carcinomas [24]. Myc is a transcription factor involved in the regulation of a wide variety of cellular genes, including those that modulate the cell cycle, protein synthesis, cellular adhesion, metabolism and apoptosis [25, 26]. The N-terminus of Myc contains the transactivation domain (TAD), which is involved in the induction of Myc target genes [27]. The TAD contains several phosphorylation sites, including threonine-58 (T58) and serine-62 (S62) [28–30], and the area surrounding T58 constitutes a mutational hotspot in Burkitt’s lymphomas (BLs) [31, 32]. In addition, the specific mutation of threonine-58 to alanine (T58A) is found in some BL cell lines [31–33].
The T58 and S62 sites have been implicated in regulating several biological properties of Myc, including protein stability, apoptosis and cellular transformation. Mitogenic stimulation or signaling through the Ras pathway increases both phosphorylation at S62 and Myc protein stability in cells [34–36]. In contrast, the half-life of the Myc serine-62 to alanine point mutant (S62A) is less than that of wild-type (wt) Myc and cannot be increased by activated Ras.[36] Glycogen synthase kinase-3 (GSK3) phosphorylates Myc at T58 [34, 37], which only occurs following prior phosphorylation at S62 [34, 36]. Phosphorylation at T58 leads to dephosphorylation at S62 and decreases Myc stability, whereas the T58A point mutation increases the protein half-life [36–38]. A single phosphorylation event at T58 acts as a signal for Myc ubiquitination, marking the protein for destruction by the proteasome [39].
Point mutations at T58 and S62 also can modulate Myc’s ability to promote apoptosis and transformation. In rodent fibroblast systems, serum starvation conditions lead to a higher rate of apoptosis in cells overexpressing wt Myc compared to cells overexpressing Myc T58A [33, 40]. Myc S62A, on the other hand, induces apoptosis at a rate comparable to the wt protein [33]. In addition to attenuating apoptotic responses, Myc T58A has been shown to enhance cellular transformation in tissue culture systems. For example, Myc T58A induces greater anchorage-independent growth than wt Myc when co-expressed with Ras in rodent cells [30, 33]. However, transfections with Ras and Myc S62A resulted in decreased anchorage-independent growth. The T58A, but not the S62A, point mutation also has been shown to increase the transforming ability of Myc in conjunction with additional oncogenes in human embryonic kidney cells and BJ fibroblasts [41]. Finally, a mouse model of Burkitt’s lymphoma has shown Myc T58A to be more oncogenic than wt Myc [42].
The existing data in the literature pertaining to Myc immortalization of post-selection HMECs are limited [16], and it has been suggested that such immortalization is a rare event [11]. Even more importantly, there are no studies on the effect of Myc phosphorylation deficient mutant proteins on human breast cell immortalization or transformation. DNA sequencing of breast tumor samples and cancer cell lines has failed to uncover point mutations at either T58 or S62 ([43] and our unpublished data). However, point mutations are not the only way to modulate Myc phosphorylation. Aberrant Ras or GSK3 signaling in breast cancer may mimic the effects of the Myc phosphorylation deficient mutants, as these are the pathways involved in phosphorylation at S62 and T58, respectively [34–37]. In addition, Rodrik, et al found that in the MCF-7 breast cancer cell line both estrogen and phospholipase D (PLD) decreased Myc phosphorylation at T58 [44], thus having a similar effect as a T58A point mutation. Therefore, investigating Myc phosphorylation in HMECs may lead to important insight into the onset and development of breast cancer.
In this study, we demonstrate that wt Myc and Myc phosphorylation deficient mutants can immortalize breast cells and that this does not appear to be a rare event. More importantly, cells immortalized by the tumor-derived Myc T58A mutant spontaneously underwent a unique morphological change coupled with anchorage-independent growth. Myc T58A cells also demonstrated a reduced sensitivity to apoptotic stimuli and the anticipated increase in Myc protein half-life. Finally, we have identified changes in gene expression that correlate with the acquisition of anchorage-independent growth.
Materials and Methods
Cell Culture, Immortalization and Photomicrographs
HeLa cells were obtained from the American Type Culture Collection (Manassas, VA) and were maintained in Dulbecco’s Modified Eagle Media supplemented with 10% fetal bovine serum, glutamine and penicillin/streptomycin (DMEM complete) (Invitrogen, Carlsbad, CA). Post-selection human mammary epithelial cells (HMECs) from two individual donors were purchased from Lonza Walkersville, Inc. (Walkersville, MD) and Cell Applications, Inc. (San Diego, CA). HMEC cultures were grown in Mammary Epithelial Growth Media (MEGM) (Lonza Walkersville, Inc., Walkersville, MD) and were passaged at a ratio of 1:4 when 60–80% confluent. Each passage represents two population doublings. Cultures than did not reach 60% confluency after 28–35 days were discarded. The cumulative number of days between passages was plotted against number of population doublings to obtain growth curves. Cell images were visualized with a Zeiss Axiovert 10 microscope (Carl Zeiss, Inc., Thornwood, NY). Digital phase-contrast micrographs were captured using an InSight camera and Spot Advanced software (Diagnostic Instruments, Inc., Sterling Heights, MI).
Retroviruses and Retroviral-Mediated Gene Transfer
Post-selection and hTERT-immortalized HMECs were transduced with amphotropic LXSN empty vector and cDNA-containing retroviruses constructs for wt Myc, Myc T58A, Myc S62A, Myc T58A/S62A or HPV E6. Amphotropic empty vector pBabe-puro or pBabe-puro-hTERT constructs, which were generously provided by Dr. Robert A. Weinberg [45], also were used for transduction. Retroviruses were produced and HMECs were transduced as previously described [46–48]. Transduced cells were positively selected in 100 μg/ml G418 (Invitrogen, Carlsbad, CA) or 0.5 μg/ml puromycin (Calbiochem, San Diego, CA) as appropriate for 10 days.
Apoptosis Assays
T-75 tissue culture flasks were seeded with 1.5×10⁶ wt Myc or Myc T58A HMECs. The following day, the flasks were subjected to 24 Gy of ionizing radiation using a 137Cs source γ-irradiator (JL Shepherd, San Fernando, CA) to induce apoptosis. Samples were rotated during irradiation. Seventy-two hours later, cells were harvested, fixed with ethanol and taken to the Flow Cytometry and Cell Sorting Shared Resource at the Georgetown University Lombardi Comprehensive Cancer Center (Washington, DC) for staining with propidium iodide and DNA content analysis.
Myc Protein Stability Assays
Wt Myc and Myc T58A HMECs were incubated for 2 hours in serum-free DMEM lacking methionine and cysteine (Invitrogen, Carlsbad, CA). After 2 hours, 198 μCi per plate of EasyTag Express 35S Protein Labeling Mix (PerkinElmer, Boston, MA) was added to the media and cells were incubated for 1 hour. Following 1 hour, the 35S labeling mix was removed and MEGM supplemented with 0.2 mM methionine and 0.2 mM cysteine (Sigma-Aldrich, St. Louis, MO) was added to the plates. The plates then were lysed at various timepoints from 0 to 90 minutes following removal of the 35S. Cells were lysed in SDS lysis buffer (Invitrogen, Carlsbad, CA) with 20% TX-100 (Fisher Scientific, Waltham, MA). Protein A Sepharose beads (Pierce, Rockford, IL) were incubated with cell lysates and Myc polyclonal antibody (sc-764, Santa Cruz Biotechnology, Santa Cruz, CA) and rotated for immunoprecipitation. The immunoprecipitated lysates were loaded onto 4–20% gradient Tris-glycine gels (Invitrogen, Carlsbad, CA). Proteins were separated by electrophoresis and transferred to polyvinylidene difluoride (PVDF) membranes (Millipore, Bedford, MA). The membranes were dried and exposed to Kodak BioMax MS film (Eastman Kodak Company, Rochester, NY). Linear regression analysis was performed using GraphPad Prism software (GraphPad Software, San Diego, CA) to determine protein half-life data.
Western Blot Analysis
Cell lysates were prepared and loaded onto 4–20% gradient Tris-glycine gels (Invitrogen, Carlsbad, CA), and gel electrophoresis and polyvinylidene difluoride (PVDF) membrane transfer were performed as previously described [49]. Membranes were probed with antibodies against T58 or T58/S62 phospho-Myc (9401, Cell Signaling Technology, Danvers, MA) or total Myc (sc-40, Santa Cruz Biotechnology, Santa Cruz, CA) at 1:1,000. Membranes were probed with secondary antibodies conjugated to alkaline phosphatase (Sigma-Aldrich, St. Louis, MO) at 1:1,000 and detected with CDP-Star chemiluminescent substrate (Sigma-Aldrich, St. Louis, MO). As a loading control, membranes were probed with an antibody against β-actin (Sigma-Aldrich, St. Louis, MO) at 1:10,000. Membranes were stripped after each primary antibody detection using Restore Western Blot Stripping Buffer (Pierce, Rockford, IL).
Soft Agar Assays and Images
Immortalized HMECs and HeLa cells were tested for growth in soft agar in 6-well tissue culture plates (2 × 10³ cells per well) or 60 mm tissue culture dishes (1×10⁴ cells per dish) with appropriate media as previously described [50]. Colonies were allowed to form for two to four weeks, during which time fresh media was added to the plates once a week. All experiments were done in triplicate. Colonies in 60 mm dishes were stained with 2 ml 0.005% crystal violet (Sigma-Aldrich, St. Louis, MO) and washed 3 times with dH2O for destaining. Colony images were visualized with a Zeiss Axiovert 10 microscope (Carl Zeiss, Inc., Thornwood, NY), and digital phase-contrast micrographs were captured using an InSight camera and Spot Advanced software (Diagnostic Instruments, Inc., Sterling Heights, MI). Digital 1x photographs of 6-well plates were captured using a Kodak DC290 digital camera and Kodak Molecular Imaging software (Eastman Kodak Company, Rochester, NY). Digital 1x images of stained 60 mm dishes were obtained and colony counts were performed using BioRad Quantity One imaging system and software (Bio-Rad Laboratories, Hercules, CA).
Microarray Analysis
Four microarray assays were performed, representing two biological repeats, each with two technical repeats, to compare gene expression changes in Myc T58A HMECs at pre-and post-anchorage-independent growth timepoints. Total RNA was harvested from HMECs using the RNAqueous-4PCR kit (Ambion, Inc., Austin, TX) per manufacturer’s protocol and sent to MOgene, LC (St, Louis, MO) for microarray analysis using a two-color Agilent Whole Human Genome slide with 4 × 44K format. Results from the microarray analysis were provided to the Bioinformatics and Biostatistics Shared Resource at the Georgetown University Lombardi Comprehensive Cancer Center (Washington, DC) for statistical analysis. Data was derived from the digital array image using Feature Extraction Software (Agilent Technologies, Santa Clara, CA). The data was normalized for variations in the intensities of the dyes by applying the Lowess model to localized subsets of the data across the entire array. Following normalization, all data were included in subsequent analyses; no minimum intensity cutoff was used to filter the data. Averages were calculated for each gene intensity across the four arrays, and fold change calculations were made based on these averages. Marray software and linear models for microarray data (limma) analysis and software [51] (both are BioConductor open-source packages, http://www.bioconductor.org) were used to generate p-values.
Results
All Myc constructs immortalize post-selection HMECs
In order to determine the relative efficiency of Myc immortalization, retroviral transductions of post-selection HMECs were performed. Cells were transduced with either wt Myc or Myc phosphorylation deficient mutants: Myc T58A, Myc S62A or Myc T58A/S62A. LXSN and p-Babe-puro empty vectors were used as negative immortalization controls, while p-Babe-hTERT or LXSN-HPV E6 was used as a positive control. As anticipated from earlier studies, either hTERT or E6 alone was sufficient to immortalize HMECs [12, 13]. Interestingly, all Myc constructs were capable of immortalizing HMECs in two separate transductions using cells from two independent donors (Figure 1). However, one donor showed a lag in initial growth in lines overexpressing wt Myc compared to the Myc mutants (Figure 1a). The growth lag was observed when the empty vector controls ceased proliferation. No such growth lag was seen in two experiments with a second donor (Figure 1b). These results suggest there may be donor-specific events that regulate the ability of wt Myc to efficiently immortalize HMECs. Regardless of the variation of wt Myc immortalization efficiency, our data indicate for the first time that phosphorylation deficient Myc mutants reproducibly immortalize HMECs with similar efficiency. Cells from the immortalization experiment depicted in Figure 1a were used in all subsequent experiments.
Fig. 1. Wt Myc and mutant Myc overexpression leads to immortalization of HMECs.

Growth curves illustrate the immortalization of HMECs from two individual donors (a and b) and in two separate experiments with each donor (top and bottom panels). The cumulative number of days was plotted against the number of population doublings to obtain the growth curves. Two population doublings represent one tissue culture passage.
The T58A mutation reduces Myc-induced apoptosis in HMECs
Previous studies indicate that the T58A mutation impairs the apoptotic potential of Myc in rodent cells [33, 40, 42]. We further evaluated the apoptotic potentials of immortalized wt Myc and Myc T58A to determine if the mutation has a similar effect in HMECs. Ionizing radiation was used to induce apoptosis in HMECs, and following irradiation, the cells were fixed and stained with propidium iodide to measure DNA content. The percentage of apoptotic cells seen 72 hours following 24 Gy of ionizing radiation was higher in wt Myc HMECs than Myc T58A HMECs, as indicated by the sub-G1 DNA content population measured by flow cytometry (Figure 2a). Representative histograms of DNA content in the irradiated cells are shown in Figure 2b.
Fig. 2. Myc T58A affects apoptosis in HMECs.
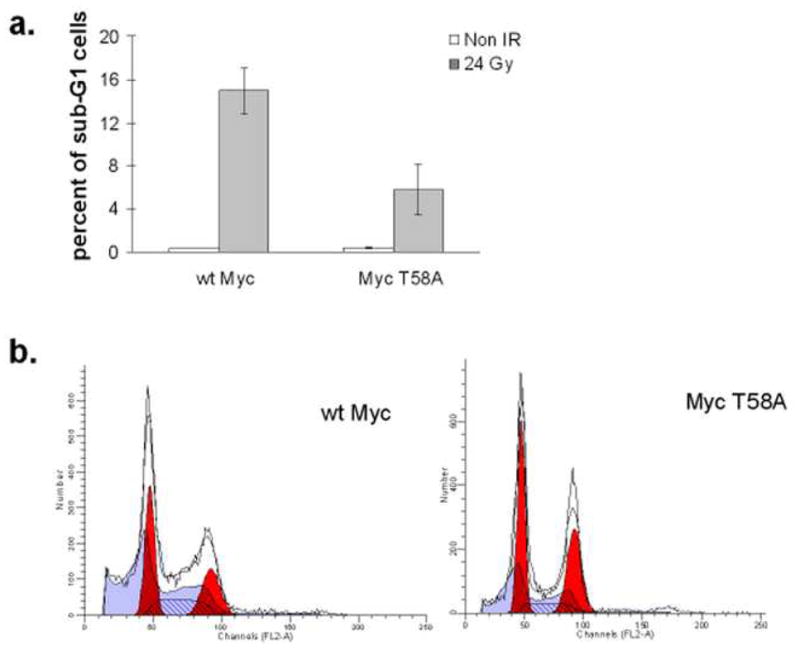
HMECs overexpressing either wt Myc or Myc T58A were subjected to 0 Gy or 24 Gy of ionizing radiation. After 72 hours, cells were fixed in ethanol, stained with propidium iodide and analyzed via flow cytometry for DNA content. a: Data shown represent the average percent +/− SD of cells in sub-G1 from three experiments. b: Representative DNA histograms showing the sub-G1 peaks for both cell lines.
The Myc T58A point mutation stabilizes Myc protein in HMECs
The Myc T58A mutation previously has been shown to also increase protein stability in rodent cells and cancer cells lines [36–38]. However, there is no data demonstrating this alteration of stability in HMECs. To address this question, we conducted pulse-chase experiments using asynchronously growing populations of immortalized wt Myc or Myc T58A HMEC lines. Following a one hour pulse with 35S to radioactively label cellular proteins, cells were chased with cold media and lysed at various timepoints. These lysates then were immunoprecipitated with Myc antibody to allow for specific protein detection. As seen in Figure 3a, labeled Myc protein was detected over a longer time course in cells with the Myc T58A mutant. Linear regression analysis was performed on results from three independent experiments to calculate a half-life for Myc protein in both cell lines. As seen in Figure 3b, the Myc half-life was significantly longer in Myc T58A HMECs compared to wt Myc HMECs, 25.7 minutes versus 14.6 minutes. Therefore, T58A acts as a Myc stabilizing mutation in the HMEC system.
Fig. 3. Myc T58A affects protein stability but not protein level in HMECs.

a: HMECs overexpressing either wt Myc or Myc T58A were labeled with 35S for one hour and then chased with 35S-free media. Lysates were made at the indicated timepoints, immunoprecipitated with Myc antibody and subjected to electrophoresis. b: Densitometry was performed on the films from (a) and the data was used in linear regression analyses. Following linear regression, the Myc half-life for each experiment was calculated. Data in the graph represent the average half-life +/− SD for each Myc construct from three experiments. c: Western blot analysis was performed to detect Myc and phospho-Myc protein from whole cells lysates in immortalized HMECs, with β-actin as a loading control. LXSN is the empty vector control and HeLa is the positive control. hT = hTERT.
The increased half-life of Myc T58A did not result in an appreciable increase in total Myc protein, similar to previously published reports [28, 33, 34, 40]. Western blots were performed on the immortalized HMEC cell lines to evaluate the expression and phosphorylation of the Myc protein (Figure 3c). All of the Myc-transduced cells expressed similar amounts of Myc protein, and these levels were significantly higher than those observed in either the LXSN-transduced cells or the hTERT-immortalized cells. Indeed, Myc expression in the Myc-immortalized cells was equivalent to the highly oncogenic HeLa cell line. As anticipated, despite overexpression, the Myc protein in cell lines expressing a phosphorylation deficient mutant was only weakly reactive with a phosphorylation-specific Myc antibody. In contrast, the Myc protein expressed in the wt Myc HMECs or the HeLa cells reacted more strongly with this antibody.
HMECs expressing Myc T58A undergo morphologic changes during cell passaging
The phase-contrast micrographs in the top panel of Figure 4 represent the Myc-transduced HMEC lines following successful transit through agonescence. After approximately 35–40 additional passages beyond agonescence, the Myc T58A HMECs grew in clusters that rounded up and detached from the tissue culture substrate (Figure 4, bottom panel). The detached clusters (inset) were not apoptotic but rather remained viable and could be replated and cultured further (data not shown). The Myc T58A HMECs were carried beyond the fully immortal state several times, and the described phenotype was observed each time. This dramatic morphological change was not observed with the other phosphorylation deficient Myc mutants. Both the Myc S62A line and the Myc T58A/S62A line retained their cuboidal shape and substrate attachment after the same number of additional passages (Figure 4, bottom panel). Wild-type Myc, on the other hand, mediated a different morphological change, in which cells assumed a more fibroblast-like appearance with cellular extensions (Figure 4, bottom panel). Despite this morphological alteration, the cells retained their substrate attachment. Interestingly, a previous report has described a similar fibroblastic morphological conversion following wt Myc overexpression in an hTERT-immortalized HMEC line [18].
Fig. 4. Myc T58 overexpression results in a unique morphological change in HMEC lines.

Representative phase-contrast micrographs at 32x magnification of HMEC lines were taken at timepoints corresponding to immortalization (top panel) and to the soft agar assays seen in Figure 5 (bottom panel). The inset in the Myc T58A bottom panel illustrates cells growing in suspension in the liquid medium. White size bars at the bottom of the micrographs represents 20 μm.
Myc T58A-immortalized HMECs form colonies in soft agar
Most immortalized HMEC lines are incapable of anchorage-independent growth [12, 15, 17]. However, due to the unique and undescribed growth and morphological alterations that we observed with Myc T58A cells, we screened the various immortalized HMECs for their ability to grow in soft agar. To our surprise, we found that Myc T58A HMECs proliferated and formed colonies in soft agar, whereas HMECs immortalized by the other Myc mutants did not (Figure 5a). HMECs overexpressing wt Myc showed limited growth in agarose. Importantly, the colonies formed by Myc T58A HMECs were larger and more numerous than those formed by the wt Myc HMECs, with some comparable in size to those formed by highly transformed HeLa cells. As anticipated, HMECs immortalized by hTERT were unable to form colonies [17] (Figure 5a). The onset of anchorage-independent growth for both wt Myc and Myc T58A HMECs correlated temporally with the changes in cell morphology shown in Figure 4; prior to these morphological changes, the Myc T58A HMECs did not form colonies in agarose (data not shown). Independent experiments with later passage cells were used to confirm these altered growth properties and to quantify growth in agarose (Figure 5b). Again, Myc T58A formed more colonies and larger colonies than those generated by wt Myc.
Fig. 5. HMECs overexpressing wt Myc and Myc T58A form colonies in soft agar.

a: Immortalized HMECs and HeLa cells were grown in soft agar in 6-well plates for four weeks. Experiments were done in triplicate. Representative 1x photographs (left column) and 10x phase-contrast micrographs (right column) are shown. White size bars at bottom of micrographs for HeLa, wt Myc and Myc T58A colonies represent 0.2 mm. b: Soft agar assays were repeated in 60 mm tissue culture dishes with wt Myc, Myc T58A and hTERT HMECs at a later passage number than in (a). Colonies were stained with crystal violet after 15 days and counted.
Myc T58A and wt Myc can also induce anchorage-independent growth in previously immortalized HMECs
A recent study has shown that wt Myc can induce hTERT-immortalized HMECs to proliferate in agarose, suggesting a direct role for Myc in anchorage-independent cell growth [18]. To determine if the biological activities that we have measured in Myc-immortalized cells also can be observed in cells that have been immortalized with an oncogene other than Myc, we performed the following experiment. hTERT-immortalized HMECs were transduced with LXSN empty vector, wt Myc or Myc T58A retroviruses and then assayed for growth in agarose. Confirming the previous study [18], wt Myc was able to induce growth of hTERT HMECs in soft agar (Figure 6). More interestingly, as shown in Figure 6, Myc T58A induced more frequent and much larger colonies than wt Myc in hTERT HMECs. The LXSN control vector showed only background colony formation. These experiments further indicate that the Myc T58A mutant is a stronger inducer of anchorage-independent growth than wt Myc, and this phenomenon is not related to the immortalization process.
Fig. 6. Wt Myc and Myc T58A overexpression facilitate anchorage-independent growth in HMECs immortalized with hTERT.
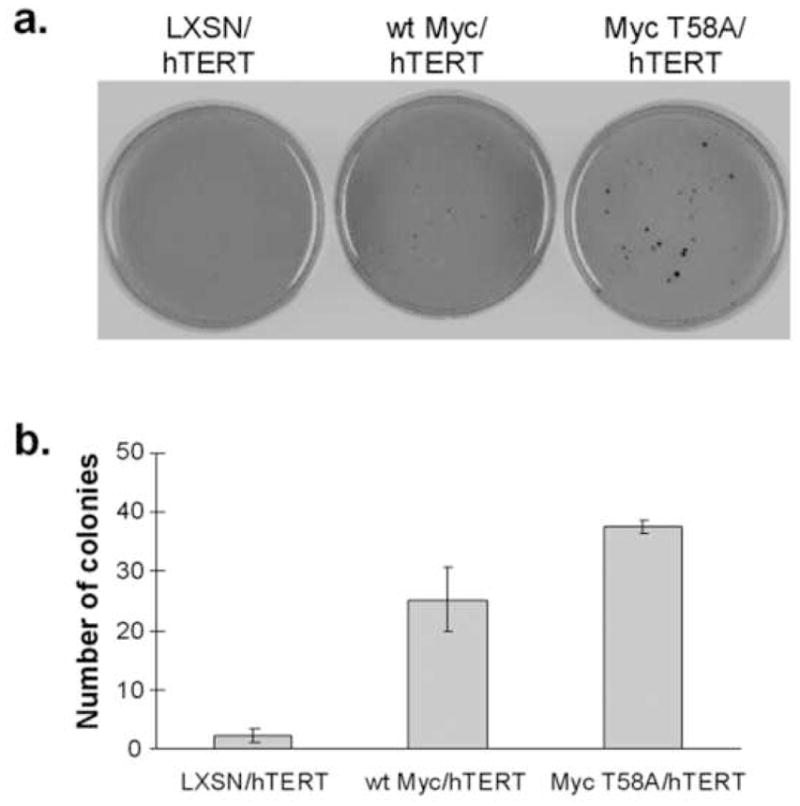
a: Immortalized HMECs were grown in soft agar in 60 mm tissue culture dishes. Experiments were done in triplicate. Colonies were stained with crystal violet after 23 days and counted. b: Stained colonies were counted, and the average number of colonies was calculated and graphed. Error bars represent +/− SD of the average.
HMEC gene expression during the transition to anchorage-independent growth
As stated previously, the Myc T58A-immortalized HMEC line evolved from anchorage-dependence to anchorage-independence following continued passaging in vitro. These cells, therefore, may serve as a model system for investigating the progression of breast epithelial cells to a transformed state. To examine changes in gene transcription during this progression, we harvested total RNA from Myc T58A HMECs prior to and after their conversion to anchorage-independent growth. Microarray assays then were performed using the Agilent Whole Human Genome two-color system to compare changes in gene expression. No minimum cutoff was used to filter the data generated from the microarrays. A subset of 149 genes with an absolute fold change of five or greater and a p-value less than 0.05 were identified following statistical analysis using marray and linear models for microarray data (limma) analysis and software. Table 1 lists the 95 genes downregulated upon acquisition of anchorage-independent growth, and Table 2 lists the 54 upregulated genes. The most dramatic reductions in expression (20-fold) included regulatory genes such as E-cadherin and annexin 3. Smaller but significant changes (more than 5-fold) were observed with genes such as caveolin-1, which has known tumor suppressor activity [52, 53]. A wide range of genes was overexpressed in the anchorage-independent HMEC cells, the most prominent (60-fold) being CD36 (thrombospondin receptor).
Table 1.
Downregulated genes in post-anchorage-independent growth c-Myc T58A HMECs
| Gene Symbol | Sequence Description | Fold Change |
|---|---|---|
|
| ||
| ANXA3 | Annexin A3 | −26.6 |
| KRT6B | Keratin 6B | −26.4 |
| TNFRSF8 | Tumor necrosis factor receptor superfamily, member 8, transcript variant 1 | −23.4 |
| CDH1 | Cadherin 1, type 1, E-cadherin (epithelial) | −22.1 |
| SPRR1B | Small proline-rich protein 1B (cornifin) | −20.7 |
| FLRT3* | Fibronectin leucine rich transmembrane protein 3, transcript variant 2 | −17.2 |
| CDKN2A | Cyclin-dependent kinase inhibitor 2A (melanoma, p16, inhibits CDK4), transcript variant 3 | −16.3 |
| AMIGO2 | Amphoterin induced gene 2 | −12.6 |
| NRG1* | Neuregulin 1, transcript variant GGF2 | −12.2 |
| ALDH1A3 | Aldehyde dehydrogenase 1 family, member A3 | −12.1 |
| ZBED2 | Zinc finger, BED domain containing 2 | −12.0 |
| PTPRZ1 | Protein tyrosine phosphatase, receptor-type, Z polypeptide 1 | −11.7 |
| NRG1* | Neuregulin 1 (NRG1), transcript variant GGF | −11.2 |
| MIG7 | MIG7, complete cds. | −11.2 |
| DSG3 | Desmoglein 3 (pemphigus vulgaris antigen) | −10.3 |
| ANGPTL4 | Angiopoietin-like 4, transcript variant 1 | −10.0 |
| full-length cDNA clone CS0DJ001YJ05 of T cells (Jurkat cell line) Cot 10 | −9.9 | |
| NEFM | Neurofilament 3 (150kDa medium) | −9.8 |
| CLCA2 | Chloride channel, calcium activated, family member 2 | −9.8 |
| CDKN2B | Cyclin-dependent kinase inhibitor 2B (p15, inhibits CDK4) (CDKN2B), transcript variant 2 | −9.7 |
| AOX1 | Aldehyde oxidase 1 | −9.7 |
| FGFBP1 | Heparin-binding growth factor binding protein | −9.7 |
| ABCA12 | ATP-binding cassette, sub-family A, transcript variant 1 | −9.6 |
| SFRP1 | Secreted frizzled-related protein 1 | −9.5 |
| PHACTR3 | Phosphatase and actin regulator 3, transcript variant 1 | −9.5 |
| FGD6 | FYVE, RhoGEF and PH domain containing 6 | −8.9 |
| LEPREL1 | Leprecan-like 1 | −8.8 |
| MYO5B | cDNA: FLJ21683 fis, clone COL09335 | −8.5 |
| IL18 | Interleukin 18 (interferon-gamma-inducing factor) | −8.5 |
| cDNA FLJ44186 fis, clone THYMU2038797 | −8.2 | |
| cDNA FLJ33320 fis, clone BNGH42007798 | −8.1 | |
| KRT15 | Keratin 15 | −7.9 |
| SERPINB7 | Serine (or cysteine) proteinase inhibitor, clade B (ovalbumin), member 7 | −7.9 |
| LAMA3 | Laminin, alpha 3, transcript variant 1 | −7.9 |
| FLJ12684 | Hypothetical protein FLJ12684 | −7.7 |
| COL8A1* | Collagen, type VIII, alpha 1, transcript variant 1 | −7.7 |
| SERPINA1 | Serpin peptidase inhibitor, clade A (alpha-1 antiproteinase, antitrypsin), member 1, transcript variant 2 | −7.6 |
| FAM113B | Hypothetical protein MGC16044 | −7.6 |
| FAM83B | cDNA: FLJ21274 fis, clone COL01781 | −7.5 |
| CD24 | CD24 signal transducer mRNA, complete cds and 3′ region | −7.5 |
| KLK8 | Kallikrein 8 (neuropsin/ovasin), transcript variant 2 | −7.4 |
| NRG1* | Neuregulin 1, transcript variant HRG-beta2 | −7.3 |
| CNN3 | Calponin 3, acidic | −7.3 |
| COL8A1* | mRNA full length insert cDNA clone EUROIMAGE 1913076 | −7.2 |
| TRIM29 | Tripartite motif-containing 29, transcript variant 1 | −7.1 |
| C1ORF116 | Specifically androgen-regulated protein | −7.1 |
| PDPN* | Lung type-I cell membrane-associated glycoprotein, transcript variant 1 | −7.1 |
| CDA | Cytidine deaminase | −6.9 |
| cDNA FLJ39181 fis, clone OCBBF2004235 | −6.6 | |
| KLK5 | Kallikrein 5 | −6.6 |
| FXYD3 | FXYD domain containing ion transport regulator 3, transcript variant 1 | −6.6 |
| LAMB3 | Laminin, beta 3, transcript variant 2 | −6.5 |
| FBN2 | Fibrillin 2 (congenital contractural arachnodactyly) | −6.4 |
| MST1R | Macrophage stimulating 1 receptor (c-met-related tyrosine kinase) | −6.4 |
| KIAA1257 | KIAA1257, mRNA (cDNA clone MGC:35174 IMAGE:5170293), complete cds | −6.3 |
| MAL2 | Mal, T-cell differentiation protein 2 | −6.3 |
| EST384910 MAGE resequences, MAGL Homo sapiens cDNA | −6.3 | |
| ABCC2 | ATP-binding cassette, sub-family C (CFTR/MRP), member 2 | −6.3 |
| ANK3 | Ankyrin 3, node of Ranvier (ankyrin G), transcript variant 1 | −6.2 |
| cDNA FLJ36835 fis, clone ASTRO2010996 | −6.2 | |
| EVA1 | Epithelial V-like antigen 1, transcript variant 2 | −6.2 |
| IL21R | Interleukin 21 receptor, transcript variant 2 | −6.1 |
| UPP1 | Uridine phosphorylase 1, transcript variant 2 | −6.1 |
| IGFBP7 | Insulin-like growth factor binding protein 7 | −6.0 |
| ICA1 | Islet cell autoantigen 1, 69kDa, transcript variant 2 | −6.0 |
| PREDICTED: Homo sapiens hypothetical LOC401131, transcript variant 1 (LOC401131) | −6.0 | |
| KRT6E | Keratin 6E | −5.9 |
| Endogenous retrovirus H protease/integrase-derived ORF1, ORF2, and putative envelope protein mRNA, complete cds | −5.9 | |
| FOXA2 | Forkhead box A2, transcript variant 1 | −5.8 |
| DHRS3 | Dehydrogenase/reductase (SDR family) member 3 | −5.8 |
| SCRN1 | Secernin 1 | −5.8 |
| GPR87 | G protein-coupled receptor 87 | −5.8 |
| ADAM19 | A disintegrin and metalloproteinase domain 19 (meltrin beta), transcript variant 2 | −5.8 |
| HIST2H2AA3 | Histone 2, H2aa | −5.7 |
| RRM2 | Ribonucleotide reductase M2 polypeptide | −5.6 |
| FLRT3* | Fibronectin leucine rich transmembrane protein 3, transcript variant 2 | −5.6 |
| CABYR | Calcium binding tyrosine-(Y)-phosphorylation regulated (fibrousheathin 2), transcript variant 1 | −5.5 |
| ADAM23 | A disintegrin and metalloproteinase domain 23 | −5.5 |
| LETM2 | Hypothetical protein FLJ25409 | −5.5 |
| PDPN* | Podoplanin, transcript variant 2 | −5.4 |
| FGFR2 | Fibroblast growth factor receptor 2, transcript variant 2 | −5.4 |
| MARK1 | MAP/microtubule affinity-regulating kinase 1 | −5.3 |
| STEAP1 | Six transmembrane epithelial antigen of the prostate | −5.3 |
| CLMN | Calmin (calponin-like, transmembrane) | −5.2 |
| CAV1 | Caveolin 1, caveolae protein, 22kDa | −5.2 |
| C10ORF47 | Chromosome 10 open reading frame 47 | −5.2 |
| GSTO2 | Glutathione S-transferase omega 2 | −5.2 |
| XIST | X (inactive)-specific transcript on chromosome X | −5.1 |
| RNF128 | Ring finger protein 128, transcript variant 1 | −5.1 |
| SCN4B | Sodium channel, voltage-gated, type IV, beta | −5.1 |
| TMEM40 | Hypothetical protein FLJ11036 | −5.1 |
| GLS2 | Glutaminase 2 (liver, mitochondrial), nuclear gene encoding mitochondrial protein, transcript variant 1 | −5.0 |
| FAM83A | Family with sequence similarity 83, member A, transcript variant 1 | −5.0 |
| DMD | Dystrophin (muscular dystrophy, Duchenne and Becker types), transcript variant Dp427p2 | −5.0 |
| POPDC3 | Popeye domain containing 3 | −5.0 |
Genes shown have an absolute fold change of five or greater and a p-value<0.05.
indicates genes with more than one transcript in the table.
Table 2.
Upregulated genes in post-anchorage-independent growth c-Myc T58A HMECs
| Gene Symbol | Sequence Description | Fold Change |
|---|---|---|
|
| ||
| CD36* | CD36 molecule (thrombospondin receptor), transcript variant 2 | 61.3 |
| OLFML2A | Olfactomedin-like 2A | 44.5 |
| CD36* | CD36=collagen type I/thrombospondin receptor {one exon} | 34.7 |
| PCDH18 | Protocadherin 18 | 23.9 |
| SDC2 | Syndecan 2 (heparan sulfate proteoglycan 1, cell surface-associated, fibroglycan) | 16.2 |
| COL6A1 | Collagen, type VI, alpha 1 | 15.6 |
| VASN | Vasorin | 15.1 |
| C2ORF32 | DKFZP566K1924 protein | 14.5 |
| cDNA FLJ39179 fis, clone OCBBF2004147 | 13.6 | |
| COL6A3 | Collagen, type VI, alpha 3, transcript variant 1 | 11.0 |
| ANPEP | Alanyl (membrane) aminopeptidase (aminopeptidase N, aminopeptidase M, microsomal aminopeptidase, CD13, p150) | 10.7 |
| APOE | Apolipoprotein E | 10.0 |
| GLIS1 | Likely ortholog of mouse Gli-similar 1 Kruppel-like zinc finger | 9.6 |
| COL5A1 | Collagen, type V, alpha 1 | 9.4 |
| CDKN1C | Cyclin-dependent kinase inhibitor 1C (p57, Kip2) | 9.1 |
| ABCA6 | ATP-binding cassette, sub-family A (ABC1), member 6, transcript variant 1 | 8.9 |
| OBSL1 | cDNA FLJ13792 fis, clone THYRO1000072 | 8.8 |
| LOXL1 | Lysyl oxidase-like 1 | 8.0 |
| PGCP | Plasma glutamate carboxypeptidase | 8.0 |
| TNFAIP2 | Tumor necrosis factor, alpha-induced protein 2 | 8.0 |
| HSPA1A | Heat shock 70kDa protein 1A | 7.8 |
| LMO2 | LIM domain only 2 (rhombotin-like 1) | 7.8 |
| BX098660 Soares placenta Nb2HP Homo sapiens cDNA clone | 7.6 | |
| FBN1 | Fibrillin 1 (Marfan syndrome) | 7.6 |
| DCN | Unknown | 7.6 |
| GJB2 | Gap junction protein, beta 2, 26kDa (connexin 26) | 7.4 |
| IFITM1 | Interferon induced transmembrane protein 1 (9–27) | 7.4 |
| GPRC5C | G protein-coupled receptor, family C, group 5, transcript variant 1 | 7.3 |
| KIAA1644 | mRNA for KIAA1644 protein, partial cds | 7.0 |
| DAPK1 | Death-associated protein kinase 1 | 6.8 |
| DIRAS1 | DIRAS family, GTP-binding RAS-like 1 | 6.7 |
| METRNL | Meteorin, glial cell differentiation regulator-like | 6.7 |
| GLRX | Glutaredoxin (thioltransferase) | 6.6 |
| NOV | Nephroblastoma overexpressed gene | 6.5 |
| PCDH7 | BH-protocadherin (brain-heart), transcript variant c | 6.4 |
| MME | Membrane metallo-endopeptidase (neutral endopeptidase, enkephalinase, CALLA, CD10), transcript variant 2b | 6.3 |
| FAM101B | Family with sequence similarity 101, member B | 6.3 |
| AHRR | mRNA for KIAA1234 protein, partial cds | 6.1 |
| LARP6 | Acheron (FLJ11196), transcript variant 1 | 6.0 |
| cDNA FLJ13740 fis, clone PLACE3000199 | 5.9 | |
| PMP22 | Peripheral myelin protein 22, transcript variant 1 | 5.9 |
| RECK | Reversion-inducing-cysteine-rich protein with kazal motifs | 5.9 |
| AKR1C1 | Aldo-keto reductase family 1, member C1 (dihydrodiol dehydrogenase 1; 20-alpha (3-alpha)-hydroxysteroid dehydrogenase) | 5.9 |
| C1R | Complement component 1, r subcomponent | 5.9 |
| NGEF | Neuronal guanine nucleotide exchange factor | 5.8 |
| NMI | N-myc (and STAT) interactor | 5.8 |
| DPT | Dermatopontin | 5.6 |
| cDNA clone MGC:88103 IMAGE:4693019, complete cds | 5.4 | |
| PLEKHG4 | Pleckstrin homology domain containing, family G (with RhoGef domain) member 4 | 5.3 |
| cDNA FLJ40165 fis, clone TESTI2015962 | 5.2 | |
| AKR1C3 | Aldo-keto reductase family 1, member C3 (3-alpha hydroxysteroid dehydrogenase, type II) | 5.2 |
| ITM2C | Integral membrane protein 2C | 5.1 |
| PTGFR | Prostaglandin F receptor (FP), transcript variant 1 | 5.1 |
| C4ORF34 | Hypothetical protein LOC201895 | 5.0 |
Genes shown have an absolute fold change of five or greater and a p-value<0.05.
indicates genes with more than one transcript in the table.
Discussion
The purpose of this study was to investigate the impact of wt Myc and Myc phosphorylation deficient mutants (T58A, S62A and T58A/S62A) on post-selection HMECs. Specifically, we were interested in the potential differences in cellular immortalization and transformation among the various Myc constructs. While there is evidence suggesting that wt Myc can immortalize HMECs [16], no studies have examined the efficiency of this process or the ability of phosphorylation deficient mutants to do so. Previous studies have shown that Myc phosphorylation status can affect cell transformation [29, 30, 33, 40, 41]. Yet for the most part, these studies were not conducted in human epithelial cells. In fact, most utilized rodent fibroblasts for their experiments. This is an important distinction to note, as results seen in one species or cell type do not always translate into similar results in other cell types. For example, the human papillomavirus E6 oncogene has been shown to induce telomerase activity in human foreskin keratinocytes and HMECs but not in human foreskin fibroblasts or IMR-90 fibroblasts [13, 16]. Therefore, although the transforming properties of Myc phosphorylation deficient mutants relative to wt Myc have been elucidated in other tissue culture systems, it was critical to determine if this activity was observed in human breast cells, where Myc has been implicated in oncogenesis.
Our results demonstrate that both wt Myc and the Myc phosphorylation deficient mutants were able to immortalize post-selection HMECs in two individual donors (Figure 1). However, in one of the donors the HMECs transduced with wt Myc exhibited a growth lag compared to the Myc mutants, suggesting that wt Myc’s ability to immortalize HMECs may vary from donor to donor. There is evidence that the immortalizing activity of wt Myc also may be cell-type specific. Gil, et al found that Myc efficiently immortalized human prostate epithelial cells from two donors [54]. Yet we have observed that similar Myc overexpression was extremely toxic to human ectocervical cells and resulted in cell death (data not shown). These opposing effects of Myc overexpression in human epithelial cells from two different tissue types underscore the importance of studying Myc’s effect on breast cells specifically.
Unlike other HMEC lines immortalized with a single oncogene, we found that the Myc T58A line and, to a lesser extent, the wt Myc line exhibited anchorage-independent growth (Figure 5). This growth capability was accompanied by specific changes in cell morphology (Figure 4). None of the other HMEC immortalized cell lines formed colonies in soft agar. This capability was at least partially due to Myc, as evidenced by the induction of anchorage-independent growth in hTERT-immortalized HMECs by either wt Myc [18] (Figure 6) or Myc T58A overexpression (Figure 6). However, growth for the wt Myc/hTERT line was not as robust as that reported previously [18, 55]. One possible explanation for this difference could be variations in the individual donor cells used in the studies. In addition, neither wt Myc/hTERT nor Myc T58A/hTERT HMECs exhibited the dramatic growth in soft agar as seen in Figure 5. This indicates that other molecular and/or genetic factors also played a role in this phenomenon. Hemann, et al reported that Myc T58A failed to upregulate the pro-apoptotic protein Bim, thus allowing cells to bypass apoptosis and become more oncogenic in a mouse model of lymphoma [42]. We did not see a similar pattern of Bim expression in our Myc T58A HMEC line (data not shown). However, we have seen that HMECs immortalized with Myc T58A are less sensitive to apoptotic stimuli than wt Myc HMECs (Figure 2). The observed decrease in apoptosis may be contributing to an increased capability for anchorage-independent growth in our system.
The HMECs from this study provide a unique tool for indentifying the molecular and genetic changes during transition from the immortal to anchorage-independent states. To this end, we employed microarray analyses comparing Myc T58A HMECs pre- and post-anchorage-independent growth. The preliminary data generated from these assays (Table 1 and Table 2) provide a good starting point for further research. In addition, given our results demonstrating a relationship between Myc T58A expression and anchorage-independent growth in breast cells, it will be important in the future to examine the phosphorylation status of Myc at T58 and/or Myc stability in breast cancer tissues.
Acknowledgments
This research was funded by Department of Defense grant W81XWH-05-0259 (CT) and CA106400-03/5 from the NCI (RS).
References
- 1.Hanahan D, Weinberg RA. The hallmarks of cancer. Cell. 2000;100:57–70. doi: 10.1016/s0092-8674(00)81683-9. [DOI] [PubMed] [Google Scholar]
- 2.Reddel RR. The role of senescence and immortalization in carcinogenesis. Carcinogenesis. 2000;21:477–484. doi: 10.1093/carcin/21.3.477. [DOI] [PubMed] [Google Scholar]
- 3.Newbold RF. The significance of telomerase activation and cellular immortalization in human cancer. Mutagenesis. 2002;17:539–550. doi: 10.1093/mutage/17.6.539. [DOI] [PubMed] [Google Scholar]
- 4.Hammond SL, Ham RG, Stampfer MR. Serum-free growth of human mammary epithelial cells: rapid clonal growth in defined medium and extended serial passage with pituitary extract. Proc Natl Acad Sci U S A. 1984;81:5435–5439. doi: 10.1073/pnas.81.17.5435. [DOI] [PMC free article] [PubMed] [Google Scholar]
- 5.Brenner AJ, Stampfer MR, Aldaz CM. Increased p16 expression with first senescence arrest in human mammary epithelial cells and extended growth capacity with p16 inactivation. Oncogene. 1998;17:199–205. doi: 10.1038/sj.onc.1201919. [DOI] [PubMed] [Google Scholar]
- 6.Romanov SR, Kozakiewicz BK, Holst CR, et al. Normal human mammary epithelial cells spontaneously escape senescence and acquire genomic changes. Nature. 2001;409:633–637. doi: 10.1038/35054579. [DOI] [PubMed] [Google Scholar]
- 7.Garbe JC, Holst CR, Bassett E, et al. Inactivation of p53 function in cultured human mammary epithelial cells turns the telomere-length dependent senescence barrier from agonescence into crisis. Cell Cycle. 2007;6:1927–1936. doi: 10.4161/cc.6.15.4519. [DOI] [PubMed] [Google Scholar]
- 8.Foster SA, Wong DJ, Barrett MT, et al. Inactivation of p16 in human mammary epithelial cells by CpG island methylation. Mol Cell Biol. 1998;18:1793–1801. doi: 10.1128/mcb.18.4.1793. [DOI] [PMC free article] [PubMed] [Google Scholar]
- 9.Huschtscha LI, Noble JR, Neumann AA, et al. Loss of p16INK4 expression by methylation is associated with lifespan extension of human mammary epithelial cells. Cancer Res. 1998;58:3508–3512. [PubMed] [Google Scholar]
- 10.Tlsty TD, Romanov SR, Kozakiewicz BK, et al. Loss of chromosomal integrity in human mammary epithelial cells subsequent to escape from senescence. J Mammary Gland Biol Neoplasia. 2001;6:235–243. doi: 10.1023/a:1011369026168. [DOI] [PubMed] [Google Scholar]
- 11.Yaswen P, Stampfer MR. Molecular changes accompanying senescence and immortalization of cultured human mammary epithelial cells. Int J Biochem Cell Biol. 2002;34:1382–1394. doi: 10.1016/s1357-2725(02)00047-x. [DOI] [PubMed] [Google Scholar]
- 12.Wazer DE, Liu XL, Chu Q, et al. Immortalization of distinct human mammary epithelial cell types by human papilloma virus 16 E6 or E7. Proc Natl Acad Sci U S A. 1995;92:3687–3691. doi: 10.1073/pnas.92.9.3687. [DOI] [PMC free article] [PubMed] [Google Scholar]
- 13.Kiyono T, Foster SA, Koop JI, et al. Both Rb/p16INK4a inactivation and telomerase activity are required to immortalize human epithelial cells. Nature. 1998;396:84–88. doi: 10.1038/23962. [DOI] [PubMed] [Google Scholar]
- 14.Nonet GH, Stampfer MR, Chin K, et al. The ZNF217 gene amplified in breast cancers promotes immortalization of human mammary epithelial cells. Cancer Res. 2001;61:1250–1254. [PubMed] [Google Scholar]
- 15.Dimri GP, Martinez JL, Jacobs JJ, et al. The Bmi-1 oncogene induces telomerase activity and immortalizes human mammary epithelial cells. Cancer Res. 2002;62:4736–4745. [PubMed] [Google Scholar]
- 16.Wang J, Xie LY, Allan S, et al. Myc activates telomerase. Genes Dev. 1998;12:1769–1774. doi: 10.1101/gad.12.12.1769. [DOI] [PMC free article] [PubMed] [Google Scholar]
- 17.Rao K, Alper O, Opheim KE, et al. Cytogenetic characterization and H-ras associated transformation of immortalized human mammary epithelial cells. Cancer Cell Int. 2006;6:15. doi: 10.1186/1475-2867-6-15. [DOI] [PMC free article] [PubMed] [Google Scholar]
- 18.Cowling VH, Cole MD. E-cadherin repression contributes to c-Myc-induced epithelial cell transformation. Oncogene. 2007;26:3582–3586. doi: 10.1038/sj.onc.1210132. [DOI] [PubMed] [Google Scholar]
- 19.Elenbaas B, Spirio L, Koerner F, et al. Human breast cancer cells generated by oncogenic transformation of primary mammary epithelial cells. Genes Dev. 2001;15:50–65. doi: 10.1101/gad.828901. [DOI] [PMC free article] [PubMed] [Google Scholar]
- 20.Zhao JJ, Gjoerup OV, Subramanian RR, et al. Human mammary epithelial cell transformation through the activation of phosphatidylinositol 3-kinase. Cancer Cell. 2003;3:483–495. doi: 10.1016/s1535-6108(03)00088-6. [DOI] [PubMed] [Google Scholar]
- 21.Kendall SD, Linardic CM, Adam SJ, et al. A network of genetic events sufficient to convert normal human cells to a tumorigenic state. Cancer Res. 2005;65:9824–9828. doi: 10.1158/0008-5472.CAN-05-1543. [DOI] [PubMed] [Google Scholar]
- 22.Duss S, Andre S, Nicoulaz AL, et al. An oestrogen-dependent model of breast cancer created by transformation of normal human mammary epithelial cells. Breast Cancer Res. 2007;9:R38. doi: 10.1186/bcr1734. [DOI] [PMC free article] [PubMed] [Google Scholar]
- 23.Ayyanan A, Civenni G, Ciarloni L, et al. Increased Wnt signaling triggers oncogenic conversion of human breast epithelial cells by a Notch-dependent mechanism. Proc Natl Acad Sci U S A. 2006;103:3799–3804. doi: 10.1073/pnas.0600065103. [DOI] [PMC free article] [PubMed] [Google Scholar]
- 24.Nesbit CE, Tersak JM, Prochownik EV. MYC oncogenes and human neoplastic disease. Oncogene. 1999;18:3004–3016. doi: 10.1038/sj.onc.1202746. [DOI] [PubMed] [Google Scholar]
- 25.Adhikary S, Eilers M. Transcriptional regulation and transformation by Myc proteins. Nat Rev Mol Cell Biol. 2005;6:635–645. doi: 10.1038/nrm1703. [DOI] [PubMed] [Google Scholar]
- 26.Dang CV, O’Donnell KA, Zeller KI, et al. The c-Myc target gene network. Semin Cancer Biol. 2006;16:253–264. doi: 10.1016/j.semcancer.2006.07.014. [DOI] [PubMed] [Google Scholar]
- 27.Kato GJ, Barrett J, Villa-Garcia M, et al. An amino-terminal c-myc domain required for neoplastic transformation activates transcription. Mol Cell Biol. 1990;10:5914–5920. doi: 10.1128/mcb.10.11.5914. [DOI] [PMC free article] [PubMed] [Google Scholar]
- 28.Gupta S, Seth A, Davis RJ. Transactivation of gene expression by Myc is inhibited by mutation at the phosphorylation sites Thr-58 and Ser-62. Proc Natl Acad Sci U S A. 1993;90:3216–3220. doi: 10.1073/pnas.90.8.3216. [DOI] [PMC free article] [PubMed] [Google Scholar]
- 29.Henriksson M, Bakardjiev A, Klein G, et al. Phosphorylation sites mapping in the N-terminal domain of c-myc modulate its transforming potential. Oncogene. 1993;8:3199–3209. [PubMed] [Google Scholar]
- 30.Pulverer BJ, Fisher C, Vousden K, et al. Site-specific modulation of c-Myc cotransformation by residues phosphorylated in vivo. Oncogene. 1994;9:59–70. [PubMed] [Google Scholar]
- 31.Bhatia K, Huppi K, Spangler G, et al. Point mutations in the c-Myc transactivation domain are common in Burkitt’s lymphoma and mouse plasmacytomas. Nat Genet. 1993;5:56–61. doi: 10.1038/ng0993-56. [DOI] [PubMed] [Google Scholar]
- 32.Albert T, Urlbauer B, Kohlhuber F, et al. Ongoing mutations in the N-terminal domain of c-Myc affect transactivation in Burkitt’s lymphoma cell lines. Oncogene. 1994;9:759–763. [PubMed] [Google Scholar]
- 33.Chang DW, Claassen GF, Hann SR, et al. The c-Myc transactivation domain is a direct modulator of apoptotic versus proliferative signals. Mol Cell Biol. 2000;20:4309–4319. doi: 10.1128/mcb.20.12.4309-4319.2000. [DOI] [PMC free article] [PubMed] [Google Scholar]
- 34.Lutterbach B, Hann SR. Hierarchical phosphorylation at N-terminal transformation-sensitive sites in c-Myc protein is regulated by mitogens and in mitosis. Mol Cell Biol. 1994;14:5510–5522. doi: 10.1128/mcb.14.8.5510. [DOI] [PMC free article] [PubMed] [Google Scholar]
- 35.Sears R, Leone G, DeGregori J, et al. Ras enhances Myc protein stability. Mol Cell. 1999;3:169–179. doi: 10.1016/s1097-2765(00)80308-1. [DOI] [PubMed] [Google Scholar]
- 36.Sears R, Nuckolls F, Haura E, et al. Multiple Ras-dependent phosphorylation pathways regulate Myc protein stability. Genes Dev. 2000;14:2501–2514. doi: 10.1101/gad.836800. [DOI] [PMC free article] [PubMed] [Google Scholar]
- 37.Gregory MA, Hann SR. c-Myc proteolysis by the ubiquitin-proteasome pathway: stabilization of c-Myc in Burkitt’s lymphoma cells. Mol Cell Biol. 2000;20:2423–2435. doi: 10.1128/mcb.20.7.2423-2435.2000. [DOI] [PMC free article] [PubMed] [Google Scholar]
- 38.Salghetti SE, Kim SY, Tansey WP. Destruction of Myc by ubiquitin-mediated proteolysis: cancer-associated and transforming mutations stabilize Myc. Embo J. 1999;18:717–726. doi: 10.1093/emboj/18.3.717. [DOI] [PMC free article] [PubMed] [Google Scholar]
- 39.Gregory MA, Qi Y, Hann SR. Phosphorylation by glycogen synthase kinase-3 controls c-myc proteolysis and subnuclear localization. J Biol Chem. 2003;278:51606–51612. doi: 10.1074/jbc.M310722200. [DOI] [PubMed] [Google Scholar]
- 40.Conzen SD, Gottlob K, Kandel ES, et al. Induction of cell cycle progression and acceleration of apoptosis are two separable functions of c-Myc: transrepression correlates with acceleration of apoptosis. Mol Cell Biol. 2000;20:6008–6018. doi: 10.1128/mcb.20.16.6008-6018.2000. [DOI] [PMC free article] [PubMed] [Google Scholar]
- 41.Yeh E, Cunningham M, Arnold H, et al. A signalling pathway controlling c-Myc degradation that impacts oncogenic transformation of human cells. Nat Cell Biol. 2004;6:308–318. doi: 10.1038/ncb1110. [DOI] [PubMed] [Google Scholar]
- 42.Hemann MT, Bric A, Teruya-Feldstein J, et al. Evasion of the p53 tumour surveillance network by tumour-derived MYC mutants. Nature. 2005;436:807–811. doi: 10.1038/nature03845. [DOI] [PMC free article] [PubMed] [Google Scholar]
- 43.Lee JW, Soung YH, Kim SY, et al. Mutational analysis of MYC in common epithelial cancers and acute leukemias. Apmis. 2006;114:436–439. doi: 10.1111/j.1600-0463.2006.apm_383.x. [DOI] [PubMed] [Google Scholar]
- 44.Rodrik V, Gomes E, Hui L, et al. Myc stabilization in response to estrogen and phospholipase D in MCF-7 breast cancer cells. FEBS Lett. 2006;580:5647–5652. doi: 10.1016/j.febslet.2006.09.013. [DOI] [PMC free article] [PubMed] [Google Scholar]
- 45.Counter CM, Hahn WC, Wei W, et al. Dissociation among in vitro telomerase activity, telomere maintenance, and cellular immortalization. Proc Natl Acad Sci U S A. 1998;95:14723–14728. doi: 10.1073/pnas.95.25.14723. [DOI] [PMC free article] [PubMed] [Google Scholar]
- 46.Miller AD, Rosman GJ. Improved retroviral vectors for gene transfer and expression. Biotechniques. 1989;7:980–982. 984–986, 989–990. [PMC free article] [PubMed] [Google Scholar]
- 47.Pear WS, Nolan GP, Scott ML, et al. Production of high-titer helper-free retroviruses by transient transfection. Proc Natl Acad Sci U S A. 1993;90:8392–8396. doi: 10.1073/pnas.90.18.8392. [DOI] [PMC free article] [PubMed] [Google Scholar]
- 48.Disbrow GL, Sunitha I, Baker CC, et al. Codon optimization of the HPV-16 E5 gene enhances protein expression. Virology. 2003;311:105–114. doi: 10.1016/s0042-6822(03)00129-6. [DOI] [PubMed] [Google Scholar]
- 49.Disbrow GL, Baege AC, Kierpiec KA, et al. Dihydroartemisinin is cytotoxic to papillomavirus-expressing epithelial cells in vitro and in vivo. Cancer Res. 2005;65:10854–10861. doi: 10.1158/0008-5472.CAN-05-1216. [DOI] [PubMed] [Google Scholar]
- 50.Suprynowicz FA, Sparkowski J, Baege A, et al. E5 oncoprotein mutants activate phosphoinositide 3-kinase independently of platelet-derived growth factor receptor activation. J Biol Chem. 2000;275:5111–5119. doi: 10.1074/jbc.275.7.5111. [DOI] [PubMed] [Google Scholar]
- 51.Gentleman RC, Carey VJ, Bates DM, et al. Bioconductor: open software development for computational biology and bioinformatics. Genome Biol. 2004;5:R80. doi: 10.1186/gb-2004-5-10-r80. [DOI] [PMC free article] [PubMed] [Google Scholar]
- 52.Lee SW, Reimer CL, Oh P, et al. Tumor cell growth inhibition by caveolin re-expression in human breast cancer cells. Oncogene. 1998;16:1391–1397. doi: 10.1038/sj.onc.1201661. [DOI] [PubMed] [Google Scholar]
- 53.Fiucci G, Ravid D, Reich R, et al. Caveolin-1 inhibits anchorage-independent growth, anoikis and invasiveness in MCF-7 human breast cancer cells. Oncogene. 2002;21:2365–2375. doi: 10.1038/sj.onc.1205300. [DOI] [PubMed] [Google Scholar]
- 54.Gil J, Kerai P, Lleonart M, et al. Immortalization of primary human prostate epithelial cells by c-Myc. Cancer Res. 2005;65:2179–2185. doi: 10.1158/0008-5472.CAN-03-4030. [DOI] [PubMed] [Google Scholar]
- 55.Cowling VH, D’Cruz CM, Chodosh LA, et al. c-Myc Transforms Human Mammary Epithelial Cells through Repression of the Wnt Inhibitors DKK1 and SFRP1. Mol Cell Biol. 2007;27:5135–5146. doi: 10.1128/MCB.02282-06. [DOI] [PMC free article] [PubMed] [Google Scholar]