Abstract
A novel method to quantitatively measure the binding of 1proteins to single-stranded DNA (ssDNA) aptamers that employs the inhibition of the DNAzyme hydrolysis of aptamer monolayers is described. A 28-base DNAzyme was designed to specifically bind to and cleave a 29-base ssDNA sequence that can fold into a G-quartet aptamer and bind the protein thrombin. The binding strength of the DNAzyme to the aptamer sequence was designed to be less than the binding strength of the thrombin to the aptamer (ΔG°=−43.1and −51.8 kJ/mol respectively). Formation of the thrombin-aptamer complex was found to block DNAzyme cleavage activity both in solution and in an ssDNA aptamer monolayer. We denote this method for detecting protein-aptamer complexation as “DNAzyme footprinting” in analogy to the process of DNase footprinting for the detection of protein-DNA interactions. By attaching a 40-base reporter sequence to the ssDNA aptamer monolayer, the detection of any protein-aptamer complexes remaining on the surface after DNAzyme activity can be greatly enhanced (down to one thrombin-aptamer complex per 10,000 ssDNA molecules corresponding to 100 fM thrombin in solution) by a subsequent surface RNA transcription amplification reaction followed by RNA detection with nanoparticle-enhanced SPR imaging. In addition to RNA transcription, DNAzyme footprinting can be coupled to a wide variety of other nucleic acid surface amplification schemes and thus is a powerful new route for the enzymatically amplified detection of proteins via protein-aptamer complex formation.
The development of novel surface bioaffinity methods to detect protein biomarkers at extremely low (sub-picomolar) concentrations is crucial for the early stage clinical detection of a variety of infectious diseases, cancers, and neurological disorders.1–4 Surface bioaffinity measurements that employ DNA or RNA aptamers in lieu of antibody microarrays have recently emerged as a rapid and robust alternative for the detection of protein biomarkers in biological samples.5–7 Aptamers possess several potential advantages over antibodies for bioaffinity sensing: better air stability and shelf life, ease of fabrication, and reduced cross-reactivity via non-specific adsorption.7,8 We have previously employed DNA and RNA aptamer microarrays for the direct detection of protein biomarkers with the techniques of surface plasmon resonance imaging (SPRI) and SPR phase imaging (SPR-PI) at concentrations as low as 100 picomolar.9,10 In this letter, we demonstrate a novel method for the ultrasensitive detection of protein biomarkers that uses DNAzymes to recognize the specific adsorption of proteins onto aptamer monolayers. This methodology can be used in conjunction with both nanoparticle-enhanced SPRI (NE-SPRI)10–12 and enzymatically amplified SPRI6,13,14 to detect protein biomarkers from nanomolar to sub-picomolar concentrations.
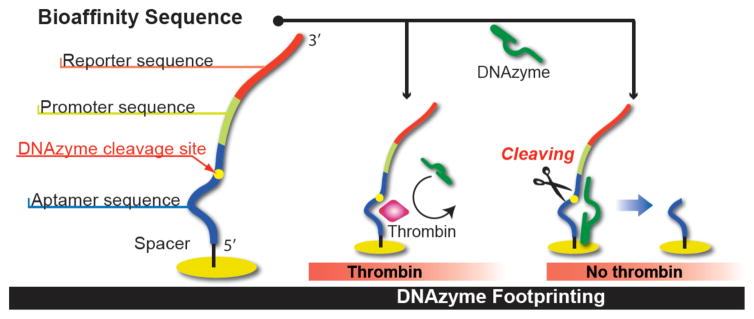
The key concept of this new method for the ultrasensitive_ detection of proteins with aptamer monolayers is the use of surface bound protein-aptamer complexes to block the site-specific nucleic acid cleavage activity of DNAzymes. We label this process “DNAzyme footprinting”, and Figure 1 shows how we use this concept. DNAzyme footprinting requires two components: (i) a single-stranded DNA (ssD-NA) molecule that we denote as the “bioaffinity sequence” that can reversibly fold into an aptamer structure and non-covalently bind to a protein, and (ii) an ssDNA DNAzyme engineered to cleave the aptamer in the bioaffinity sequence in the absence of protein-aptamer complex formation. As shown in Figure 1, bioaffinity adsorption of a protein biomarker onto the ssDNA aptamer will block the access of the DNAzyme to the cleavage site and prevent hydrolysis. To quantitatively measure the amount of protein blockage of DNAzyme cleavage activity, we attach an additional ssDNA sequence to the aptamer monolayer (labeled as a promoter-reporter sequence in Figure 1). If the aptamer-protein complex is not formed, then the DNAzyme will cut the ssDNA, removing the promoter-reporter sequence from the surface. Thus, the number of reporter-promoter sequences that remain on the surface is a measure of the number of adsorbed protein-aptamer complexes. This method of “protecting” the DNAzyme cleavage site with the protein-aptamer complex is reminiscent of the process of enzymatic footprinting, in which binding sites for protein transcription factors are identified by the protection of dsDNA from DNA endonuclease activity by the formation of protein-dsDNA complexes.15,16
Figure 1.

Schematic diagram of the DNAzyme footprinting methodology.
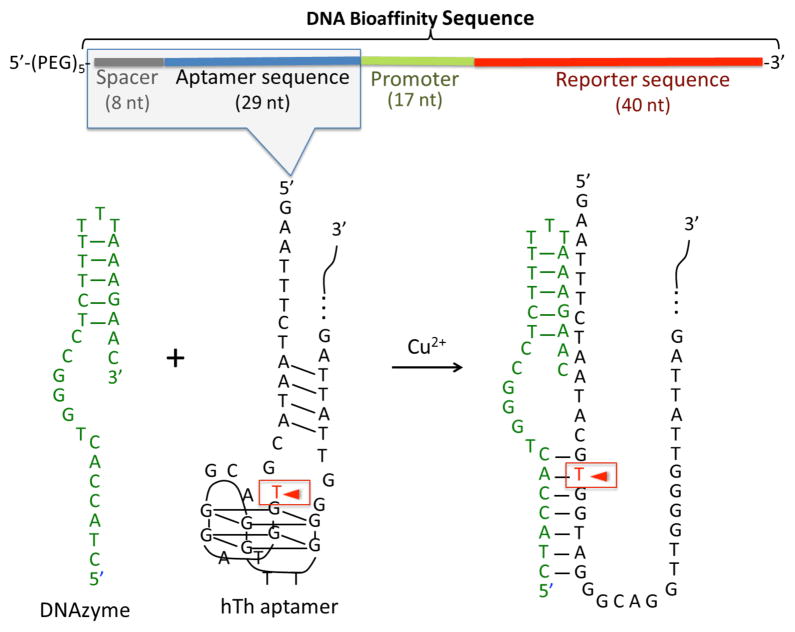
As an initial demonstration, we have designed the two ssDNA oligonucleotides depicted in Figure 2: (i) a 98-base “bioaffinity sequence” that consists of an 8 nucleotide spacer, a 29-base aptamer for the 37kD human thrombin protein (hTh)17 which has been used previously as a biomarker for various coagulation-related and cardiovascular diseases, a 17-base promoter sequence and a 40-base reporter sequence; and (ii) a 28-base ssDNA DNAzyme designed to cleave the thrombin aptamer at the thymine base position 7 in the aptamer sequence as shown in the figure. All sequences are listed in detail in the Supporting Information. As shown in the figure, the aptamer includes a G-quartet motif that interacts with hTh at the hTh-heparin binding exosite, leading to an aptamer-hTh binding energy of ΔG°=−51.8 kJ/mol at 25 °C.17 The design of the DNAzyme is based on a Cu2+-dependent DNA-cleaving deoxyribozyme reported by Breaker et al.18 In the presence of Cu2+ and ascorbic acid, this DNAzyme-substrate complex catalyzes a C4′ oxidation at position T7 of the aptamer sequence (see Figure 2).18 As shown in the figure, the DNAzyme is designed to bind to the aptamer sequence through a combination of a duplex and a triplex structure. The length of the duplex base-pairing sequence can be adjusted to vary the binding strength of the DNAzyme to the aptamer sequence.18 This 28-mer DNAzyme was designed to have a seven-base duplex structure with binding energy of ΔG°~−43.1 kJ/mol at 25 °C that is slightly less than the binding energy of the hTh-aptamer complex.
Figure 2.
The DNAzyme sequence and the thrombin aptamer sequence as part of “bioaffinity sequence”. The red arrow indicates the DNAzyme cleaving site T7.
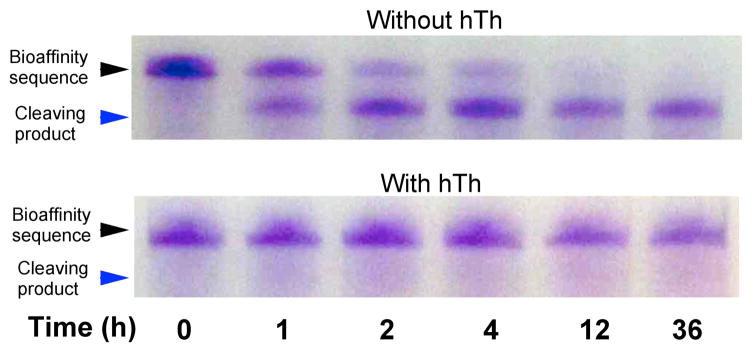
A set of gel electrophoresis measurements were used to demonstrate that the hTh protein can bind to the DNA aptamer and block DNAzyme cleavage activity in solution. Figure 3 is an electrophoresis gel image of a series of aliquots containing 1 μM DNA bioaffinity sequence that were first incubated either with or without 1 μM hTh, and then exposed to 2 μM DNAzyme in solution (containing Cu2+, and ascorbic acid) for 1 to 36 hours. The full image of the gel is provided in Supporting Information (Figure S1). The results clearly show that in the absence of hTh, a significant amount of cleavage of the aptamer sequence was observed after one hour, and complete cleavage of the aptamer was observed after 12 hours. In contrast, in the presence of hTh, the aptamer remained uncleaved even after 36 hours.
Figure 3.

Time-based gel electrophoresis of DNAzyme footprinting in solution.
Having verified that the thrombin-aptamer complex can block DNAzyme activity in solution, we then used the DNAzyme footprinting methodology to detect thrombin with aptamer monolayers attached to gold thin films. As depicted in Figure 1, any thrombin-aptamer complex that blocks the DNAzyme cleavage activity will leave a promoter-reporter sequence on the surface. Thus, the fractional surface coverage of promoter-reporter sequences is a measure of the fractional surface coverage of adsorbed thrombin molecules (θhTh), which at low concentrations is proportional to the solution concentration ChTh: θhTh = Kads·ChTh where Kads is the Langmuir adsorption coefficient (1.2 × 10⁸M−1 for hTh adsorption).10 The surface coverage of promoter-reporter sequences can be detected by various possible SPRI methods: (i) by direct SPRI detection of the hybridization adsorption of a complementary ssDNA sequence onto the monolayer, (ii) by SPRI detection of the adsorption of gold nanoparticles (AuNPs) modified with the complementary ssDNA sequence, or (iii) by NE-SPRI detection of RNA or DNA transcripts created in a surface polymerase reaction using the promoter-reporter sequence. We have verified that method (ii) can be used detect thrombin at nanomolar concentrations (see Supporting Information for an exemplary experiment, Figure S2), and demonstrate here the most sensitive method (iii) to show that this DNAzyme footprinting technique can be used at extremely low relative surface coverages (down to θhTh = 10−5), corresponding to sub-picomolar thrombin concentrations.
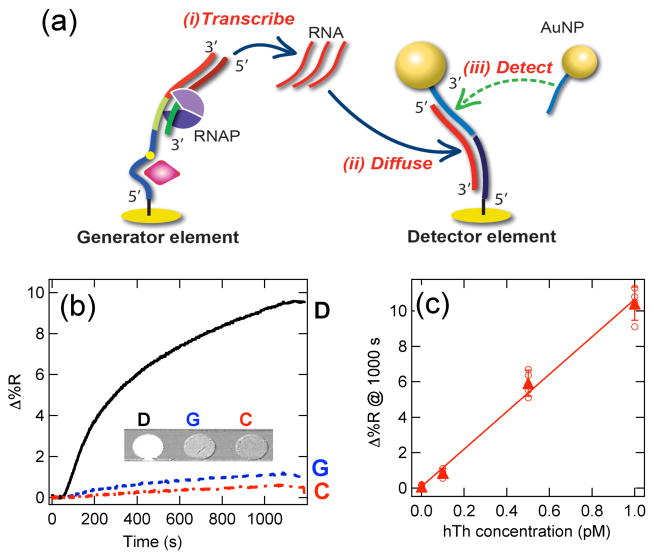
To detect the promoter-reporter sequences at these low surface coverages, we have employed an on-chip RNA amplification-detection strategy that we have used previously to detect ssDNA at femtomolar concentrations.12 The on-chip enzymatic amplification process is depicted schematically in Figure 4a. As seen in the figure, the DNA bioaffinity sequence is immobilized onto an SPRI microarray element (denoted as a generator element (G)). A surface RNA polymerase reaction is used to create multiple RNA transcripts of the 40-mer reporter sequence (approximately 2000 copies as measured previously).12 The transcribed RNA diffuses and adsorbs onto an adjacent SPRI microarray element (denoted as a detector element (D)) modified with a capture sequence of 20-mer ssDNA which is complementary to half of the RNA sequence. The adsorbed RNA transcript is detected by the further adsorption of AuNPs coated with ssDNA that is complementary to the other 20 bases of the RNA. This three-sequence hybridization assembly greatly enhances the SPRI signal from the detector elements.12
Figure 4.
(a) Schematic diagram of transcription amplification and AuNP-enhanced SPRI from an uncleaved bioaffinity sequence. (b) SPRI real-time binding data of AuNPs adsorbed onto detector (D), generator (G) and control (C) microarray elements from a 1 pM hTh sample. (c) Δ%R increase measured at 1000 seconds for AuNP adsorption onto detector microarray elements as a function of hTh concentration. The triangles indicate the average value from a set of microarray elements (hollow circles). A linear concentration dependence was observed with a detection limit of 100 fM.
Figure 4b plots the SPRI real-time binding curves for the final step in this DNAzyme footprinting experiment with enzymatic amplification detection: the adsorption of ssD-NA-modified AuNPs (2 nM) onto a microarray containing detector (D), generator (G) and control (C) elements. (The full SPRI difference image for this experiment is shown in Figure S3). Prior to this step, the microarray was exposed to (i) a 1 pM hTh solution for 12 hours, (ii) 0.2 μM DNAzyme solution for 12 hours, and finally (iii) an RNA polymerase solution (containing both the enzyme and ribonucleotides) for 2 hours. The ssDNA sequences for the microarray elements are listed in Table S1. A very large Δ%R increase of ~10% is observed from the Detector element after 1000s. A small amount of AuNP adsorption (~1%) is also observed on the Generator elements, but this signal does not interfere with the quantitation of the Detector element signal. A small Δ%R increase of less than 0.5% is observed from the Control elements, indicating very little nonspecific adsorption of the AuNPs onto these microarrays.
Figure 4c plots the Δ%R increase measured for AuNP adsorption to the microarray detector element after 1000 seconds for a series of SPRI experiments at different hTh concentrations from 0 to 1 pM. A linear slope for Δ%R was observed for hTh concentrations below 1 pM. A limit of detection of Δ%R= 0.7% corresponding to an hTh concentration of 100 fM was observed; at this concentration the hTh-aptamer complex surface coverage θhTh is equal to 10−5. To detect this very low surface coverage, the DNAzyme footprinting method must be very effective at cleaving all of the unblocked aptamers in the monolayer, leaving only one intact hTh-aptamer complex for every 10,000 aptamer sequences on the surface. Above 1 pM, the Δ%R continues to increase but saturates at 25% at approximately 100 pM (A complete Δ%R plot for hTh concentrations from 0.1 pM to 1 nM on a logarithmic concentration scale is shown in Figure S4). We attribute this saturation to the formation of a full AuNP monolayer on the Detector element as observed in previous NE-SPRI experiments.13 This saturation can be avoided by simply reducing the RNA transcription time (and thus the amount of enzymatic amplification), but it would also decrease the signal at the lower (sub-picomolar) concentrations.
The initial experiments described in this letter have demonstrated that process of DNAzyme footprinting is a highly sensitive process for the detection protein-aptamer complexes in a surface bioaffinity sensing format. The use of DNAzyme footprinting with aptamer microarrays for the detection of proteins has several advantages as compared to the use of secondary enzyme-coupled antibodies with antibody microarrays. Conventional enzymatic amplification methods typically require two separate bio-recognition sites on protein biomarkers for immobilization and signal enhancement.19–21 Moreover, the binding affinity of the DNAzyme to the substrate can be designed and tested by the stem-base pairing and the specific base pair sequence can also be modified.18 Additionally, the DNAzyme is relatively inexpensive, straightforward to handle, and less prone to nonspecific adsorption onto the microarray surface as compared with DNase I or other protein enzymes. A current limitation of the DNAzyme footprinting methodology is that the DNAzyme cleavage reaction is slow. For our protein biosensing measurements, we allowed the DNAzyme to react for 12h with the microarray surface to be absolutely sure that all unprotected ssDNA were removed from the surface. Further experiments are needed to optimize the DNAzyme reaction conditions and reduce this reaction time. This DNAzyme footprinting methodology can be potentially expanded to a multiplexed platform by using multiple aptamers each with a distinct reporter sequence.22 Finally, we note that in addition to SPRI, the use DNAzyme footprinting for the detection of aptamer-protein complexes can be incorporated into any number of surface-based bioaffinity measurements (e.g., fluorescence imaging, LSPR spectroscopy, microring resonators, QCM, etc.).
Supplementary Material
Acknowledgments
This work is supported by the National Institute of Health (2RO1 GM059622) and the University of California Cancer Research Coordinating Committee (CRCC). The authors would like to thank Prof. Andrej Luptak and Cassandra Burke at University of California-Irvine for helpful discussions, as well as Dr. Kohei Nakamoto for graphical design.
Footnotes
The authors declare no competing financial interests.
Supporting Information. Experimental methods, supporting table and figures. This material is available free of charge via the Internet at http://pubs.acs.org.
References
- 1.Vasan RS. Circulation. 2006;113:2335–2362. doi: 10.1161/CIRCULATIONAHA.104.482570. [DOI] [PubMed] [Google Scholar]
- 2.Shi M, Bradner J, Hancock AM, Chung KA, Quinn JF, Peskind ER, Galasko D, Jankovic J, Zabetian CP, Kim HM, Leverenz JB, Montine TJ, Ginghina C, Kang UJ, Cain KC, Wang Y, Aasly J, Goldstein D, Zhang J. Ann Neurol. 2011;69:570–580. doi: 10.1002/ana.22311. [DOI] [PMC free article] [PubMed] [Google Scholar]
- 3.Rissin DM, Kan CW, Campbell TG, Howes SC, Fournier DR, Song L, Piech T, Patel PP, Chang L, Rivnak AJ, Ferrell EP, Randall JD, Provuncher GK, Walt DR, Duffy DC. Nat Biotechnol. 2010;28:595–U25. doi: 10.1038/nbt.1641. [DOI] [PMC free article] [PubMed] [Google Scholar]
- 4.Lockhart DJ, Winzeler EA. Nature. 2000;405:827–836. doi: 10.1038/35015701. [DOI] [PubMed] [Google Scholar]
- 5.Ng EWM, Shima DT, Calias P, Cunningham ET, Guyer DR, Adamis AP. Nat Rev Drug Discov. 2006;5:1474–1776. doi: 10.1038/nrd1955. [DOI] [PubMed] [Google Scholar]
- 6.Li Y, Lee HJ, Corn RM. Anal Chem. 2007;79:1082–1088. doi: 10.1021/ac061849m. [DOI] [PMC free article] [PubMed] [Google Scholar]
- 7.Cho EJ, Collett JR, Szafranska AE, Ellington AD. Anal Chim Acta. 2006;564:82–90. doi: 10.1016/j.aca.2005.12.038. [DOI] [PubMed] [Google Scholar]
- 8.Eickhoff H, Konthur Z, Lueking A, Lehrach H, Walter G, Nordhoff E, Nyarsik L, Büssow K. Vol. 77. Springer; Berlin/Heidelberg: 2002. pp. 103–112. [DOI] [PubMed] [Google Scholar]
- 9.Halpern AR, Nishi N, Wen J, Yang F, Xiang CX, Penner RM, Corn RM. Anal Chem. 2009;81:5585–5592. doi: 10.1021/ac900938t. [DOI] [PMC free article] [PubMed] [Google Scholar]
- 10.Zhou WJ, Halpern AR, Seefeld TH, Corn RM. Anal Chem. 2011;84:440–445. doi: 10.1021/ac202863k. [DOI] [PubMed] [Google Scholar]
- 11.Gifford LK, Sendroiu IE, Corn RM, Luptak A. J Am Chem Soc. 2010;132:9265–9267. doi: 10.1021/ja103043p. [DOI] [PMC free article] [PubMed] [Google Scholar]
- 12.Sendroiu IE, Gifford LK, Luptak A, Corn RM. J Am Chem Soc. 2011;133:4271–4273. doi: 10.1021/ja2005576. [DOI] [PMC free article] [PubMed] [Google Scholar]
- 13.Zhou WJ, Chen Y, Corn RM. Anal Chem. 2011;83:3897–3902. doi: 10.1021/ac200422u. [DOI] [PMC free article] [PubMed] [Google Scholar]
- 14.Goodrich TT, Lee HJ, Corn RM. J Am Chem Soc. 2004;126:4086–4087. doi: 10.1021/ja039823p. [DOI] [PubMed] [Google Scholar]
- 15.Hampshire AJ, Rusling DA, Broughton-Head VJ, Fox KR. Methods. 2007;42:128–140. doi: 10.1016/j.ymeth.2007.01.002. [DOI] [PubMed] [Google Scholar]
- 16.Galas DJ, Schmitz A. Nucleic Acids Res. 1978;5:3157–3170. doi: 10.1093/nar/5.9.3157. [DOI] [PMC free article] [PubMed] [Google Scholar]
- 17.Tasset DM, Kubik MF, Steiner W. J Mol Biol. 1997;272:688–698. doi: 10.1006/jmbi.1997.1275. [DOI] [PubMed] [Google Scholar]
- 18.Carmi N, Breaker RR. Bioorgan Med Chem. 2001;9:2589–2600. doi: 10.1016/s0968-0896(01)00035-9. [DOI] [PubMed] [Google Scholar]
- 19.Gorris HH, Walt DR. J Am Chem Soc. 2009;131:6277–6282. doi: 10.1021/ja9008858. [DOI] [PubMed] [Google Scholar]
- 20.Sim HR, Wark AW, Lee HJ. Analyst. 2010;135:2528–2532. doi: 10.1039/c0an00457j. [DOI] [PubMed] [Google Scholar]
- 21.Tang L, Liu Y, Ali MM, Kang DK, Zhao W, Li J. Anal Chem. 2012;84:4711–4717. doi: 10.1021/ac203274k. [DOI] [PubMed] [Google Scholar]
- 22.Chen Y, Nakamoto K, Niwa O, Corn RM. Langmuir. 2012;28:8281–8285. doi: 10.1021/la300656c. [DOI] [PMC free article] [PubMed] [Google Scholar]
Associated Data
This section collects any data citations, data availability statements, or supplementary materials included in this article.


