INTRODUCTION
Although many undergraduate and graduate Cell and Molecular Biology courses study the bacterial cell cycle and the mechanisms that regulate prokaryotic cell division, few laboratory projects exist for the enhanced study of cell cycle characteristics in a standard teaching laboratory. One notable reason for this lack of engaging laboratory projects is, although bacterial cells can be grown fairly easily, these cultured cells are in a variety of cell cycle states. As such, to study and understand the factors that regulate bacterial cell division in morphological, physiological, and even molecular respects, it is necessary to have bacterial cells in the same stage of its cell cycle. This matching can be performed by a procedure called cell cycle synchronization.
The prokaryotic cell cycle is comprised of the B period, C period, and D period, which correspond broadly to G1, S, and G2/M phases of eukaryotic cell cycle, respectively (12). Cell cycle synchronization is a method that brings most cells in a cell population to an identical cell cycle stage. Such synchronization methods are necessary in many experimental protocols, such as in the expression and regulation of cell cycle related genes, in the isolation of cells of different morphological and physiological properties, and in the microscopic examination of cells during cell division.
In the past, several approaches have been used in different model bacterial organisms to obtain synchronized cell populations. For instance, one approach includes the usage of temperature sensitive mutants of dnaA or dnaC to arrest cells prior to DNA replication (2). Another method is known as the “baby machine” technique, which utilizes the difference of physical attachment to a membrane between newborn cells and adult cells (6, 7). However, both these methods have their own drawbacks and have varied yields. For instance, for the “baby machine” method, the amount of cells collected using this method is quite low, while for the temperature sensitive mutant method, the initiation of replication for cells is abnormal.
Here, the sucrose density gradient centrifugation method was applied in a modified form. This method separates cells from an asynchronously grown cell culture based on their fluctuating buoyant densities (3, 5, 9, 10). These fluctuations and differences in buoyant density during the bacterial cell cycle result from the properties of nucleoids, the differences in accumulations of macromolecules such as lipids, hydrocarbons, and biopolymers, and the change in cell volume (4, 5, 10). This method is inexpensive, does not require any heavy instrumentation, and is fairly simple to adapt to teaching and laboratory settings. The following procedure is written for the model photosynthetic and metabolically versatile bacterium, Rhodobacter sphaeroides, and the efficacy of the method is discussed in the Conclusion section below. However, it can be applied to almost any asynchronously dividing bacterium desired with minor modification.
PROCEDURE
Bacterial culture
R. sphaeroides 2.4.1 was grown in Sistrom’s (SIS) minimal medium, at its optimal growth temperature, 30°C (11). Bacterial cell cultures were grown under aerobic or photosynthetic growth conditions. Photosynthetic cultures were grown in tightly capped tubes wrapped with Parafilm under medium light intensity (15 W). As is apparent, the ideal culturing conditions may differ among different bacteria, so it is wise to consult a reference for the most appropriate conditions for the bacteria to be cultured.
Measurement of buoyant densities by sucrose density gradient
Density gradients of sucrose were made with a range of 40% to 80% (w/v) with 10% increments. Sucrose was dissolved in a solution containing 10 mM (EDTA) and 5 mM HEPES KOH, pH 7.5 (4). One mL aliquots of 80%, 70%, 60%, 50%, and 40% sucrose were carefully pipetted into Beckman 5 mL swinging-bucket polyallomer centrifuge tubes sequentially, so that the solution went down slowly on the top of the preceding solution with 10% higher concentration. The sucrose gradient was stored at 4°C for up to 4 hours. To determine buoyant densities of R. sphaeroides under both aerobic and photosynthetic growth conditions, 107–108 of R. sphaeroides cells grown under these conditions were harvested by centrifuging for 5 minutes at 4,000 rpm at 4°C; pelleted cells were then resuspended in 200 μl SIS medium, and the cell suspension was subsequently loaded on top of the sucrose gradient. Centrifugation was performed in a swinging-bucket rotor (Beckman SW 55 Ti) for 30 minutes at 20,000 rpm at 4°C. The density of the cells was calculated as described previously (1, 4).
Cell cycle synchronization of R. sphaeroides
One mL aliquots of 70%, 69%, and 68% sucrose, as well as 0.5 mL 65% sucrose, were carefully pipetted into a Beckman 5 mL swinging-bucket polyallomer centrifuge tube sequentially. About 107–108 of R. sphaeroides cells reaching mid-log phase (OD600 = 0.2) were harvested, and resuspended in SIS medium, and subsequently loaded on top of the sucrose gradient, as described in the previous section. After centrifugation, pelleted cells were collected and washed using SIS medium in 1.5 mL microcentrifuge tubes. Cells were spun down by centrifugation at 6,000 rpm for 5 minutes to get rid of any remaining sucrose, and then eventually resuspended in 1 mL SIS medium. Immediately after resuspension, cells were fixed by adding 1/5 volume of fixative (12.5% formaldehyde, 150 mM sodium phosphate, pH 7.5), and incubated for 15 minutes at room temperature. Cells were washed by SIS medium twice, and then cell pellets finally resuspended in 500 μl SIS medium. The resulting cell suspension was mixed with 4.5 mL 70% ethanol for 1 hour at 4°C prior to flow cytometric and microscopic analysis.
Microscopic analysis
In addition, cells present in different gradient layers were carefully collected for immediate microscopic examinations. The capability of cell growth recovery from sucrose was also observed by starting new cell cultures using cells collected from the pellet and different sucrose gradient layers. Cell samples were affixed onto the slide using equal volume of poly-L-lysine (Sigma-Aldrich P4832) and then air-dried. Affixed cells were examined using 100× objective lenses. The method for the scanning electron microscopy was modified from protocols described previously (8).
CONCLUSION
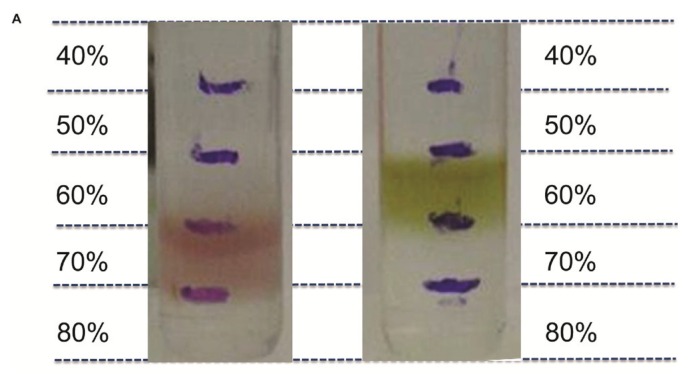
R. sphaeroides cells grown under aerobic or photosynthetic growth conditions usually have different patterns in accumulations of metabolites and macromolecules, such as lipids, hydrocarbons, and biopolymers, which together determine cell buoyant density. When centrifuged simultaneously in separate sucrose gradients with a concentration range of 40%–70%, photosynthetic and aerobic grown cells were found to have different buoyant densities (Fig. 1). The buoyant densities of the cells grown under photosynthetic and aerobic growth conditions had density ranges of 1.231–1.289 g/mL and 1.289–1.350 g/mL, respectively.
FIGURE 1.
Buoyant densities of R. sphaeroides under different growth conditions. The determination of buoyant densities of R. sphaeroides cells both aerobically (left panel) and photosynthetically (right panel).
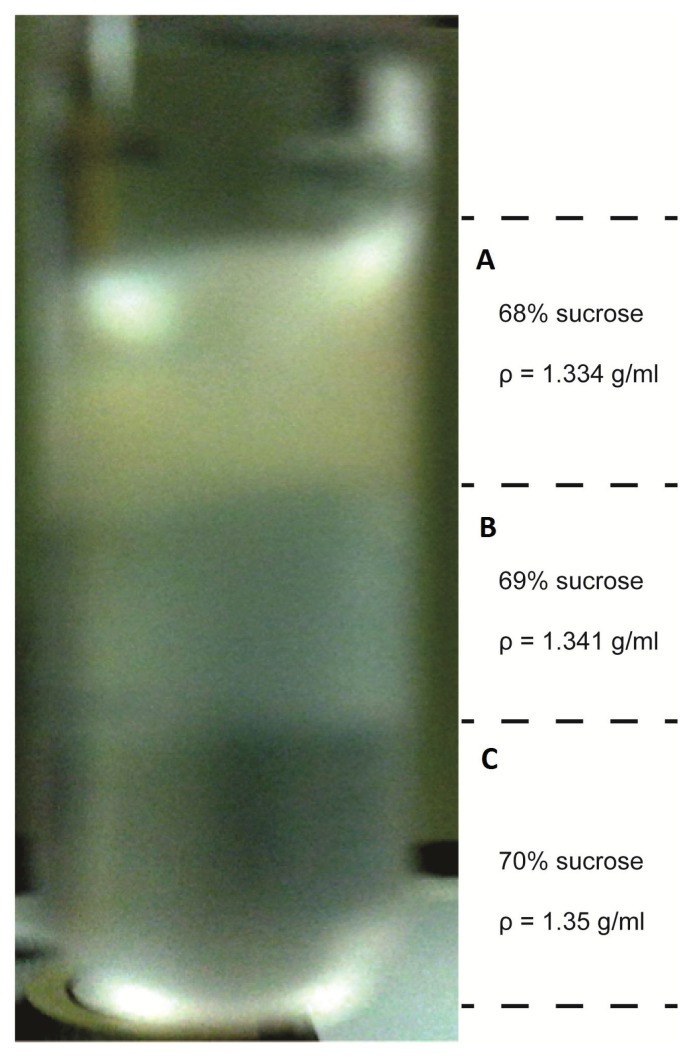
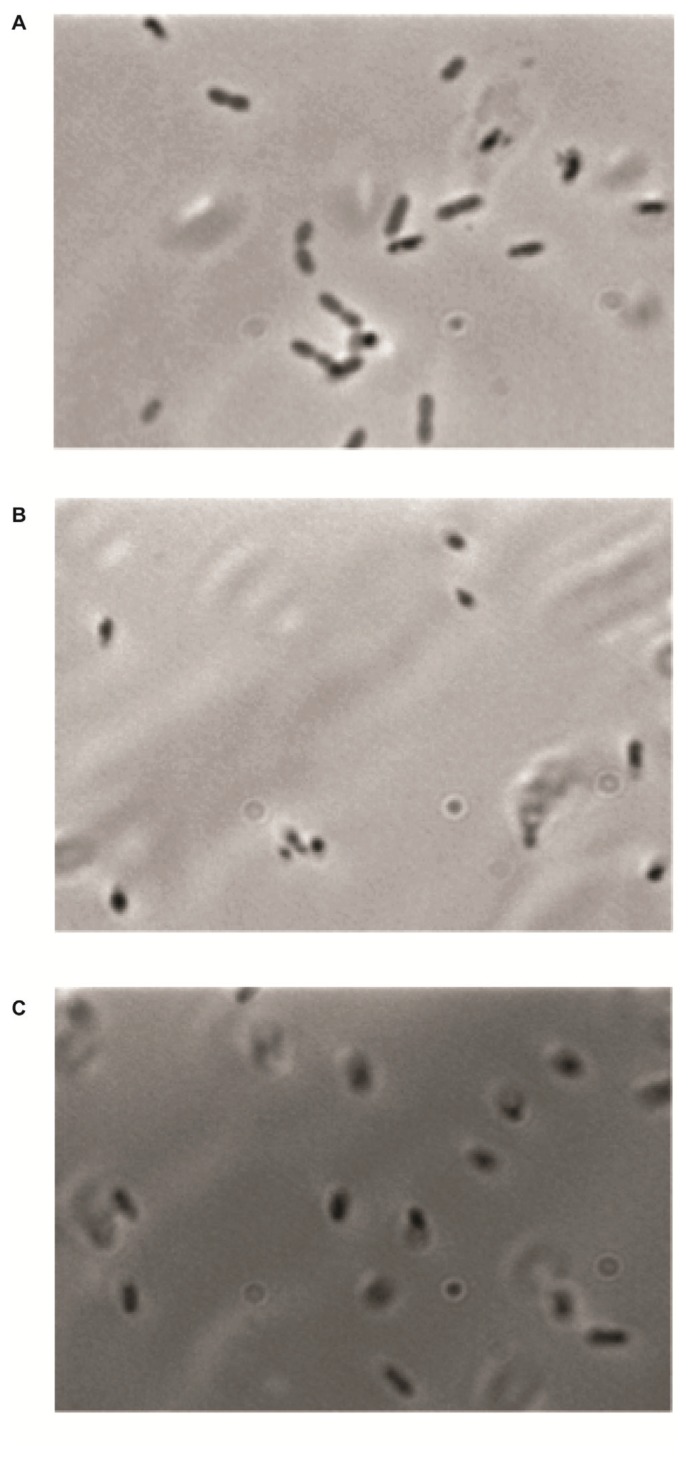
A low-range sucrose gradient was then used to separate aerobically grown cells from an asynchronous culture in which cell population is comprised of cells with different buoyant densities representing cells being distributed over different cell cycle stages (Fig. 2). Approximately 70% of cells were concentrated in the 68% sucrose gradient band, ~20% cells were in 69% sucrose gradient band, and < 10% cells were in the pellet. It was also noticed that when using different batches of sucrose solutions, the range of the sucrose gradient in which cells localize varied. Most cells of the 68% sucrose gradient band were dividing cells (Fig. 3(A)), most cells in the 69% sucrose gradient band were haploid cells (Fig. 3(B)), and almost all cells in the cell pellet were newborn cells (Fig. 3(C)). Thus, the results confirm that cells of different cell cycle stages have different buoyant densities and become localized to sucrose layers of different densities. The selection of the percent sucrose gradient can be varied for different bacterial species, and the method can be used to isolate different species from a mixed grown culture. The toxic effect of sucrose is minimal, and cells collected from the gradient can be washed several times with a successive dilution for normal growth to be restored.
FIGURE 2.
R. sphaeroides cells separated into two different sucrose gradient layers with corresponding buoyant densities.
FIGURE 3.
Microscopic analysis of cells collected from different gradient layers and synchronized pellets: (A) cells with majority of dividing cells were collected from 68% density layers; (B) cells with evenly mixed cell populations were taken from 69% layers; (C) cells were collected from bottom pellets with highest buoyant densities. Note: Most cells were newborn.
As shown, the sucrose gradient approach is simple and does not require any highly specialized instrumentation. Moreover, no specific molecular or genetic alterations are necessary, as with other synchronization methods. However, cell cycle synchronization is not only useful for specific cell-cycle research but also for the development of projects in teaching activities around understanding the cell cycle. For instance, this method shows the variability of different macromolecular compositions in different stages of the cell cycle and, therefore, can be utilized to allow for enhanced student understanding of cell cycle processes.
ACKNOWLEDGMENTS
This work was supported by the Enhancement Grant for Research (EGR) from Sam Houston State University to Madhusudan Choudhary. The authors declare that there are no conflicts of interest.
References
- 1.Buknik Z, Kadlec P, Urban D, Bruhns M. Sugar technologists manual: chemical and physical data for sugar manufacturers and users. Bartens Publishing Co.; Berlin: 1995. [Google Scholar]
- 2.Carl PL. Escherichia coli mutants with temperature-sensitive synthesis of DNA. Mol. Gen. Genet. 1970;109:107–122. doi: 10.1007/BF00269647. [DOI] [PubMed] [Google Scholar]
- 3.Dwek RD, Kobrin LH, Grossman N, Ron EZ. Synchronization of cell division in microorganisms by percoll gradient. J. Bacteriol. 1980;144:17–21. doi: 10.1128/jb.144.1.17-21.1980. [DOI] [PMC free article] [PubMed] [Google Scholar]
- 4.Eroglu E, Melis A. “Density equilibrium” method for the quantitative and rapid in situ determination of lipid, hydrocarbon, or biopolymer content in microorganisms. Biotechnol. Bioeng. 2009;102:1406–1415. doi: 10.1002/bit.22182. [DOI] [PubMed] [Google Scholar]
- 5.Evinger M, Agabian N. Envelope-associated nucleoid from Caulobacter crescentus stalked and swarmer cells. J. Bacteriol. 1977;132:294–301. doi: 10.1128/jb.132.1.294-301.1977. [DOI] [PMC free article] [PubMed] [Google Scholar]
- 6.Helmstetter CE, Cummings DJ. Bacterial synchronization by selection of cells at division. Proc. Natl. Acad. Sci. USA. 1963;50:767–774. doi: 10.1073/pnas.50.4.767. [DOI] [PMC free article] [PubMed] [Google Scholar]
- 7.Helmstetter CE, Eenhuis C, Theisen P, Grimwade J, Leonard AC. Improved bacterial baby machine: application to Escherichia coli K-12. J. Bacteriol. 1992;174:3445–3449. doi: 10.1128/jb.174.11.3445-3449.1992. [DOI] [PMC free article] [PubMed] [Google Scholar]
- 8.Hesse WR, Kim MJ. Visualization of flagellar interactions on bacterial carpets. J. Microsc. 2009;233:302–308. doi: 10.1111/j.1365-2818.2009.03119.x. [DOI] [PubMed] [Google Scholar]
- 9.Kahng LS, Shapiro L. The CcrM DNA methyltransferase of Agrobacterium tumefaciens is essential, and its activity is cell cycle regulated. J. Bacteriol. 2001;183:3065–3075. doi: 10.1128/JB.183.10.3065-3075.2001. [DOI] [PMC free article] [PubMed] [Google Scholar]
- 10.Poole RK. Fluctuations in buoyant density during the cell cycle of Escherichia coli K12: significance for the preparation of synchronous cultures by age selection. J. Microbiol. 1977;98:177–186. doi: 10.1099/00221287-98-1-177. [DOI] [PubMed] [Google Scholar]
- 11.Sistrom WR. A requirement for sodium in the growth of Rhodopseudomonas sphaeroides. J. Gen. Appl. Microbiol. 1960;22:778–785. doi: 10.1099/00221287-22-3-778. [DOI] [PubMed] [Google Scholar]
- 12.Skarstad K, Steen HB, Boye E. Cell cycle parameters of slowly growing Escherichia coli B/r studied by flow cytometry. J. Bacteriol. 1983;154:656–662. doi: 10.1128/jb.154.2.656-662.1983. [DOI] [PMC free article] [PubMed] [Google Scholar]


