

Abstract
β-site amyloid precursor protein cleaving enzyme 1 (BACE1) is a potential target for treating Alzheimer’s disease. BACE1’s binding site is partially covered by a flexible loop on its N-terminal domain, known as the “flap,” which has been found in several conformations in crystal structures of BACE1 and other aspartyl proteases. The side chain of the invariant residue Tyr71 on the flap adopts several rotameric orientations, leading to our hypothesis that the orientation of this residue dictates the movement and conformations available to the flap. We investigated this hypothesis by performing 220 ns of molecular dynamics simulations of bound and unbound wild-type BACE1 as well as the unbound Y71A mutant. Our findings indicate that the flap exhibits various degrees of mobility and adopts different conformations depending on the Tyr71 orientation. Surprisingly, the “self-inhibited” form is stable in our simulations, making it a reasonable target for drug design. The alanine mutant, lacking a large side chain at position 71, displays significant differences in flap dynamics from wild type, freely sampling very open and closed conformations. Our simulations show that Tyr71, in addition to its previously determined functions in catalysis and substrate binding, has the important role of modulating flap conformations in BACE1.
Keywords: beta-site amyloid precursor protein cleaving enzyme 1, beta-secretase, Alzheimer’s disease, molecular dynamics simulations, protein flexibility
Introduction
Alzheimer’s disease (AD), the most common cause of dementia in the elderly, is a devastating ailment that affects more than 30 million people worldwide.1 This neurodegenerative disorder progresses as a general decline in brain function, initially affecting one’s cognitive abilities and memories and eventually resulting in incapacitation and death. Although the cause of AD remains unclear, the current prevailing thought revolves around the “amyloid cascade hypothesis.” This hypothesis states that the overproduction and extracellular accumulation of the 42-residue β-amyloid peptide (Aβ) is involved in AD from its earliest stages onwards.2,3 Thus, lowering the concentration of Aβ in the brain may prevent or cure AD. Aβ is formed from the cleavage of amyloid precursor protein (APP), a 695–770-residue transmembrane protein. The initial cleavage event that commits APP to its degradation into Aβ is carried out by the protease β-site APP cleaving enzyme 1 (BACE1). The absence of BACE1 activity greatly attenuates Aβ production,4–6 so the inhibition of this enzyme has come under a tremendous amount of scrutiny as a potential therapeutic mechanism for the treatment of AD.
BACE1 is a 501-residue type-I transmembrane protein, consisting of a large extracellular N-terminal domain, a transmembrane domain, and a short C-terminal domain.7 The N-terminal domain, which performs the catalytic function, is ~30% identical to aspartyl proteases such as pepsin, cathepsin D, and renin and shares their general fold. This domain is predominantly β-sheet and consists of two lobes, formed from the domain’s N- and C-terminal halves (Figure 1A, green and blue, respectively).8 The substrate-binding site lies in a cleft between the two lobes and is partially covered by a flexible hairpin loop known as the flap, formed by residues 68 to 77 (BACE1 numbering; Figure 1A, yellow). When an inhibitor is present, the flap generally assumes a closed conformation over the inhibitor (Figure 1B, red).8 However, in the unbound state, the binding site is more open, and the flap is in an elevated conformation (Figure 1B, blue).9–11 Compared to the closed form, the elevated flap is 5–7 Å farther from the base of the cleft.
Figure 1.
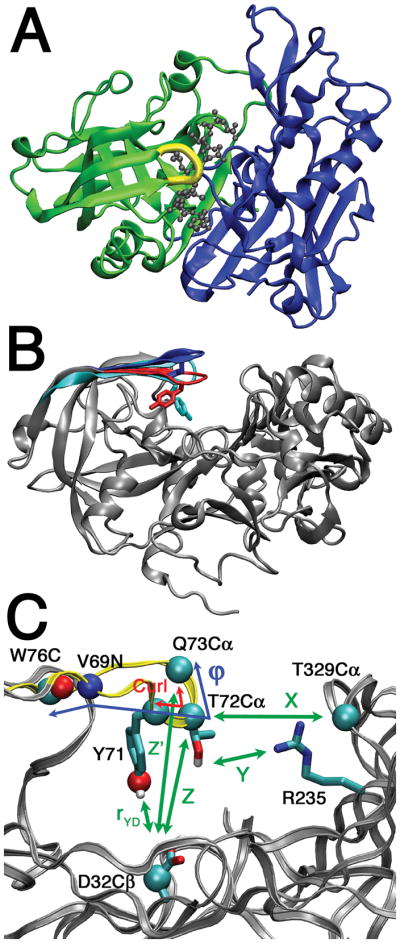
A. Top view of BACE1 bound by an inhibitor (PDB 1FKN). The inhibitor (gray balls and sticks) occupies a cleft between the N-terminal (green) and C-terminal lobes (blue). The flap is highlighted in yellow. B. Front view of BACE1 showing the different flap conformations and Tyr71 orientations. The conformations include closed (red; from bound structure 1FKN) and elevated (blue; from unbound structure 1SGZ), which have Tyr71 orientations TyrBack and TyrUp, respectively. Overlaid is the flap from a chymosin crystal structure (cyan; 1CMS) with a TyrDown orientation. This flap conformation resembles the twisted conformation observed in our studies. C. Zoomed-in view of the flap and catalytic site highlighting several metrics used in this work.
Just as the flap conformation varies in different crystal structures, the flap residue Tyr71 is found in several orientations that differ by the rotameric state of its side chain (as defined by χ1, the N-Cα-Cβ-Cγ dihedral angle). The most commonly observed orientation for Tyr71 in crystal structures has a χ1 angle near −60° (=300°), pointing the side chain back and away from the catalytic site (TyrBack in Figure 1B, red). This orientation allows for the formation of an important hydrogen bond network involving the Trp76 side chain NH, Tyr71 OH, an ordered water (known as W2), Ser35 OH, and an Asp32 side chain O atom that is conserved in most inhibitor-bound forms of pepsin-like aspartyl proteases.12 The second orientation is observed in the 1SGZ crystal structure.9 This is a “tyrosine up” conformation with χ1 ≈ +60°, placing the Tyr71 side chain flat against the underside of the flap (TyrUp in Figure 1B, blue).9 Most crystal structures of BACE1, including all of those that have a closed flap, display a TyrBack orientation. The two apo structures available at the initiation of the project both have an elevated flap but different Tyr71 orientations: TyrBack (1W50) and TyrUp (1SGZ).9,10 A later crystallographic study revealed that unbound BACE1 in different pH environments undergoes small conformational changes (RMSD < 1 Å) within the elevated-flap state, accompanied by small changes in the position of Tyr71.11 The structures at pH 4.5 (2ZHT) and pH 7.0 (2ZHV) are proposed to represent active and inactive states of the enzyme, respectively. The pH 7.0 structure very closely resembles the 1W50 structure, which was obtained at pH 6.6.10 Despite the small changes, it should be emphasized that both the 2ZHT and 2ZHV structures had Tyr71 in the TyrBack state and the flap in an elevated state; significant changes in the flap orientation and Tyr71 rotamer were not observed as the pH changed.
Tyr71 may exist in a third orientation (withχ1 ≈ 180°) that has its side chain pointed down toward the catalytic region, packed against the hydrophobic residues of a pocket of the binding cleft known as the S1 site. We termed this orientation “tyrosine down” (TyrDown in Figure 1B, cyan). Although it has not been observed in any BACE1 crystal structures to date, this orientation was seen in several crystal structures of the aspartyl proteases chymosin13–15 and saccharopepsin.16 Furthermore, it was observed in a molecular dynamics (MD) study of unbound BACE1, raising the possibility that TyrDown is a readily sampled rotamer for Tyr71 in the apo state.17 It has been called a self-inhibiting conformation because the occupancy of S1 by the Tyr71 side chain led to the idea that this orientation prevents substrate binding.18 It should be noted that the Tyr71 χ1 angle is 180° in several structures of BACE1: 2Q11, 2Q15, 2WJO, 2ZJK, and 3H0B.19–22 However, the side chains would not be classified as TyrDown by our definition because the S1 sites are occupied by ligands, not Tyr71.
Tyr71 is invariant among the pepsin-like aspartyl proteases, indicating that this residue is crucial to the function of these enzymes. While no experimental work has yet been done on the BACE1 mutants of this residue, mutation of the equivalent Tyr residues in other aspartyl proteases has been investigated to pinpoint its role. Its importance is underscored by the fact that in both chymosin and Rhizomucor pusillus pepsin, mutation of Tyr71 (BACE1 numbering) to almost any other amino acid resulted in negligible enzymatic activity.23,24 The authors concluded that because the residue at position 71 strongly influences both Km and kcat, this tyrosine both affects the substrate capture and plays a direct role in the catalytic mechanism. In both chymosin and pepsin, this Tyr residue is in nearly the same environment as it is in BACE1. Its side chain is well-positioned to accept a hydrogen bond from a Trp side chain in essentially the same physical location (although not homologous by sequence) as Trp76 in BACE1.10 Also, the S1 pockets of all three are lined entirely by hydrophobic side chains. The similarity of environment and the invariance of Tyr71 suggest that its role and effects of mutation should be no different for BACE1.
The fact that the flap conformations and Tyr71 orientations differ in the crystallographic data suggested the hypothesis that in addition to its roles in catalysis and substrate binding, Tyr71 affects BACE1 function by a third mechanism: modulating the flexibility and conformations of the flap. Previous MD studies have hinted at this role, noting that a closed conformation is favored by the presence of a Tyr71-Trp76 hydrogen bond (a characteristic of TyrBack) but disfavored by its disruption.17 We have performed 220 ns of MD simulations of BACE1 to more fully investigate our hypothesis and clarify the link between flap flexibility and Tyr71 orientation. A key aspect of our work is the analysis of a simulation of the Y71A mutant of BACE1 which shows significantly more flexibility than wild-type BACE1 and distinct conformations. This mutant was chosen because it eliminates nearly all the potential interactions of the Tyr71 side chain: the hydrogen bonding interactions of the OH as well as aromatic and hydrophobic interactions of the phenyl ring.
Materials and Methods
A total of 11 simulations were performed for 20 ns plus equilibration. For the apo state of wild-type BACE1, four independent simulations were initiated from the 1SGZ crystal structure (denoted 1SGZ-A to 1SGZ-D),9 four from 1W50 (1W50-A to 1W50-D),10 and one from 2ZHT.11 The 2ZHT structure was released at the conclusion of our study; multiple runs were not conducted with 2ZHT because the simulation was similar to the 1W50 simulations already completed. One simulation of BACE1 bound to the peptidic inhibitor OM99-2 (1FKN)8 and one of a Y71A mutant in the apo state were also performed. The Y71A model was created from the 1SGZ crystal structure by truncating the side chain of residue 71 at the Cβ atom.
System preparation
Crystal structures of BACE1 (PDB: 1FKN8, 1SGZ9, 1W5010, and 2ZHT11) were obtained from the Protein Data Bank.25 1FKN and 1SGZ contain multiple chains in their asymmetric units, so only the first chain was retained. All crystallographic water molecules within 4 Å of the protein were retained.
The 1W50 crystal structure is missing residues 158 to 167, part of a disordered loop. This loop was built into the 1W50 model using 2G94,26 the most highly resolved complete structure at the time. Because of the loop’s distance from the flap and the inherent flexibility of this insert, which allows it to move independently of the rest of the protein, the specific conformation adopted by this loop during our simulations was unlikely to influence flap dynamics.10
Hydrogen atoms were then added to the structures. The protonation states of the histidine residues were determined by visual inspection. It was clear from the hydrogen-bonding pattern for two residues, His45 and His360, that an uncharged side chain was most appropriate. The remaining five were modeled in the charged state, because BACE1 exhibits maximum function at low pH.11,27 The catalytic residues, Asp32 and Asp228, were modeled in a protonated and deprotonated state, respectively. This is the most likely state of the functional enzyme based on previous theoretical and experimental work.28,29
The complete protein structures were solvated with enough water to ensure that no protein atom was nearer than 10 Å from the edge of the periodic box. The resultant box was shaped like a truncated octahedron with a width of ~80 Å. To neutralize the system charge, sodium ions were added in the positions of lowest electrostatic potential 10 Å from the protein surface. The full systems contained ~40,000 atoms. The setup of the simulation box was performed with the tLEaP module of Amber 8.30
Molecular dynamics
Simulations were initiated from 1FKN (with its ligand), 1SGZ (four independent runs in which initial velocities were assigned based on different random number seeds), the 1W50 model (four independent runs), 2ZHT, and the Y71A model. All minimizations and simulations were performed with the sander module of Amber 8.30 Equilibration of the systems was achieved in six steps: hydrogen minimization; full system minimization; water heating while keeping the protein fixed (50 ps); equilibration of the water around the fixed protein (220 ps for the Y71A mutant, 200 ps for the others); heating of the fully unrestrained system (50 ps); and equilibration of the fully unrestrained system (200 ps for 1FKN, 1200 ps for the others). The steps with the protein constrained were performed to eliminate the void volume between water and protein that resulted from the solvation algorithm, which was found to be important in previous simulations.31
The Amber ff03 force field32 was used with TIP3P water parameters.33 The two unnatural residues of the ligand in 1FKN required special treatment. Atomic charges for these residues were determined with RED-II software, utilizing the protocol that was used to determine standard ff03 charges.34 Appropriate atom types were chosen from those that already existed in the force field, and no extra parameters were required.
During the simulations, the SHAKE algorithm was used to constrain the lengths of bonds involving hydrogen atoms, allowing us to use a time step of 2 fs. Coordinates were saved every 2 ps for the 20-ns simulations. A pressure of 1 bar was maintained by Berendsen coupling with a time constant of 1 ps.35 The temperature also was maintained by Berendsen coupling. During heating, the target temperature increased linearly over time from 10 to 310 K, and the time constant of the thermostat was 0.1 ps. During constant-temperature simulations, the target temperature was 310 K and the time constant was 0.5 ps. The cutoff for van der Waals and short-range electrostatic interactions was 10 Å, and long-range electrostatics were treated with PME. Structures and trajectories were viewed with VMD36 and PyMOL.37 Analysis of the simulations was performed primarily with the ptraj module of Amber 8.30
For clustering, we used frames taken every 10 ps (every 5 frames) from the simulations. Frames from the Y71A simulation were taken as one group (2001 frames). After combining all nine wild-type simulations, two other groups were created from all frames with a Tyr71 orientation of TyrDown (8118 frames) and TyrBack (9492 frames). TyrUp frames appeared for only a few ns of one simulation and were not clustered. Each snapshot was aligned by the Cα atoms of the protein core (all residues except the flap and residues 158–170 and 310–315, which are missing in some structures) and then clustered according to the Cα atoms of the flap (residues 69–75), similar to the procedure used in a previous MD analysis of BACE1.17 Clustering was performed with ptraj from AmberTools 1.2,38 using the means algorithm, 10 clusters, and a distance metric of root-mean-squared deviation (RMSD).
Results and Discussion
Global characteristics
The general characteristics of our simulations, including RMSDs from the crystal structures (Supporting Information Figure S1A), residue B-factors (Supporting Information Figure S1B), and correlated motions, are very similar to those for previously reported MD simulations of BACE1.17,28,39–42 This supports the quality of our simulations and indicates that it is appropriate to compare our results to others in the literature.
Evaluation of Tyr71 orientation
Choosing the χ1 angle to define the orientations of Tyr71 allows for a clear separation of each frame into the three distinct states, TyrUp, TyrDown, and TyrBack (Figure 2). The time dependence of χ1 demonstrates that the three states are not in rapid equilibrium; instead, transitions between Tyr71 orientation states occur infrequently so that Tyr71 remains in a single orientation for a long time with respect to MD time scales. Therefore, it is reasonable to break the simulations into distinct multi-ns segments based on the χ1 angle, resulting in one TyrUp trajectory and five each of TyrDown and TyrBack. Significant deviations from the ideal χ1 value for TyrBack (−60° = 300°) were observed in some trajectories; these will be discussed below. Also, the overall distribution of frames suggests that TyrUp is much less stable than the other two orientations; this too will be discussed below.
Figure 2.

Tyr71 χ1 angle measurement (black) as a function of time for all the wild-type apo simulations. Note that a χ1 value of 300° is equivalent to −60°. For each simulation, the data recorded before time 0 is the equilibration. The production data (time 0–20 ns) is separated cleanly into multi-ns TyrUp, TyrDown, and TyrBack trajectories. For simulations that have at least one transition (in equilibration or production), the flap twist measurement ϕ (see Figure 1C) is shown in gray. The flap twist tends to be at high values at the time of the transitions (see Table I).
Another metric considered as a descriptor of Tyr71 orientation is the distance between Tyr71 OH and Asp32 Cβ atoms (rYD). This and the other metrics discussed below are illustrated in Figure 1C. For brevity, the data on individual trajectories is provided in the Supporting Information Figures S2–S9, and histograms of the cumulative behavior over all related simulations are given in Figure 3. The distributions of rYD show distinct distributions depending on χ1 (Figure 3B).
Figure 3.

Histograms for various metrics for Tyr71 orientation and flap conformation, as defined in Figure 1C. χ1 and rYD involve the Tyr71 side chain, and thus are not defined for the Y71A simulation. Each tick on the Y-axis is 1000 frames.
Evaluation of flap conformation
Several metrics are used to describe the conformations of the flap, including three devised by Gorfe and Caflisch17 for ease of comparison between our studies (Figure 1C, Figure 3C–E). Elevation of the flap, Z, is defined as the distance between Cα of Thr72 and Cβ of Asp32. Two measures of the width of the active site are X, the distance between Cα of Thr72 and Cα of Thr329, and Y, the minimum distance between side-chain heavy atoms of Thr72 and Arg235. Comparison of these metrics with those from the simulations of Gorfe and Caflisch suggest some overlap between the sampling in the two sets of simulations, but opening of the binding site—a simultaneous increase in the values of X, Y, and Z—was more commonly observed in their simulations (Figure 3C–E).
To better understand the discrepancy in opening, representative structures of the protein were obtained by selecting the centroids after clustering all the frames displaying the TyrBack and TyrDown orientations (Figure 4). The TyrUp orientation was not considered because it has only minor occupancy. As expected, the centroid X, Y, and Z values overlaying the data for all frames show that they are well representative of the overall behavior of the trajectories (Supporting Information Figures S10–S23).
Figure 4.

Centroids from clustering the flap main chain structures from the TyrDown (A, B), TyrBack (C, D), and Y71A (E, F) frames, viewed from the front (left) and straight down the flap (right). The spectrum of colors corresponds to the number of frames in the cluster represented by the centroid, from red (most populous) to dark blue (least populous). The Tyr71 and Arg235 side chains are shown as sticks, and the Asp32 Cβ atom is shown as spheres. The multiple positions of the loop containing Thr329 are marked with arrows in A. The position of Asp32 Cβ is relatively stable compared to Arg235 or the 329-loop. In many TyrDown centroids, the flap is twisted with the Tyr71 and Thr72 side downward. There is less twist in the TyrBack centroids, and the twist is reversed in the Y71A centroids. The Y71A centroids are generally very high or very low in elevation, while there is little elevation in most of the TyrDown and TyrBack centroids.
Comparison of the centroids shows that the reference point for Z, the catalytic residue Asp32, is relatively deep in the protein at the bottom of the binding site and consequently has little conformational flexibility (Figure 4). Because the reference point is more or less fixed, changes in Z generally occurred as a direct result of flap motion. On the other hand, the points of reference for X and Y, the loop containing Thr329 and the side chain of Arg235, displayed much more flexibility (Figure 4), and therefore changes in these values often occurred independent of flap conformation. In particular, an increase in X often arose due to the upward flip of the loop containing Thr329, especially in the TyrDown trajectories (Figure 4A). Even in the bound simulation, in which the flap was quite rigid (discussed below), there was a broad distribution in X and Y (Figure 3D,E). Because X, Y, and Z do not all depend entirely on the flap conformation, it is not surprising that there is not always a correlation in the three measurements. This is particularly notable with TyrDown, which has a relatively narrow distribution of Z at a low value (Figure 3C), at first glance suggesting that the binding site is rarely open, but a broad distribution of X and Y centered at high values, at first glance suggesting that the binding site is often open (Figure 3D,E). This contradiction highlights the limitations in the utility of these metrics.
Consequently, it is desirable to find other metrics that, like Z, are more reflective of the flap conformation alone. Gorfe and Caflisch suggested one possibility: flap curling, a main cause of binding site opening observed in their simulations defined as the angle between the Cα atoms of residues Tyr71, Thr72, and Gln73 (Figure 1C).17 However, such curling is not observed in our simulations, and there is very little variation in the defined angle (Figure 3G). Instead, as is clearly observed in the centroids, the flap exhibits considerable variation by twisting (Figure 4), so we define the flap twist ϕ as the dihedral angle Trp76 C-Val69 N-Thr72 Cα-Gln73 Cα (Figure 1C).
Note that in positive flap twists, Thr72 is tipped toward the bottom of the binding site. Therefore, large flap twists cause a somewhat misleading decrease in Z. Even if Gln73 does not change position, but the flap twists, the value of Z is reduced. Therefore, we introduce Z’, the Gln73 Cα-Asp32 Cβ distance, as an alternate metric of flap elevation (Figure 1C). This is very similar to Z but is less affected by changes in flap twist.
Based on the overall patterns in the distributions, it is immediately clear that Tyr71 and the flap are very stable in the bound simulation. For all metrics, the distributions are very narrow (Figure 3), and the calculated B-factors of the flap are much less than those of the unbound (Figure 5). This is in agreement with the crystallographic data and the results of previous MD simulations.8–11,17
Figure 5.

B-factors of the Cα atoms of flap residues for the trajectories separated by Tyr71 orientation.
Tyr71 controls flap conformation and flexibility
The histograms for both elevation Z (and Z’) and twist ϕ of the flap show a strong dependence on Tyr71 orientation. In agreement with this, scatter plots of the ϕ vs. Z show distinct regions corresponding to all three orientations of Tyr71 (Figure 6), although there are comparatively few frames with TyrUp, so discussion of this orientation will not be emphasized. This demonstrates that changes in Tyr71 are sufficient to significantly alter the conformation of the flap.
Figure 6.

Scatter plots of the flap twist ϕ against the elevation Z (see Figure 1C for definitions) for all frames, both equilibration and production, separated by Tyr71 orientation. The values for relevant crystal structures and the centroids from clustering the TyrDown (A), TyrBack (B), and Y71A frames (D) are overlaid.
A TyrDown orientation often leads to a highly twisted flap, sometimes with ϕ as high as 80°, due to geometric restrictions of the side chain’s occupancy of the S1 pocket. On the other hand, extreme twists with ϕ≥ 60° are almost never observed in the TyrBack structures (only 0.03% of the time), and even a relatively modest twist ofϕ≥ 40° is seen less than 2% of the time. Instead TyrBack structures are distributed around a lower twist value, even displaying a tail towards −ϕ, highlighting that TyrBack is skewed to twist in the opposite direction of TyrDown.
For Z and Z’, the flap elevation metrics, the TyrBack distribution is slightly broader and shifted toward higher values than that for TyrDown (Figure 3C,F). One of the main reasons for this is that TyrBack displays less hydrogen bonding between the flap side chains, especially Tyr71, and the base of the binding site, which is correlated with lower elevations. In the TyrBack orientation, the Tyr71 OH is generally in a relatively stable position as a part of the hydrogen bond network between Trp76 and W2 (Figure 7B, centroid 1, red), and thus is less available to form other interactions with lower groups. In contrast, the OH group in TyrDown has no preferred position. Instead, the Tyr71 OH group in the TyrDown orientation sometimes forms a direct hydrogen bond with an Asp32 side chain O (15% occupancy; Figure 7, centroid 2, pink), and more often, a water-mediated hydrogen bond with Gln12 O (41% occupancy; Figure 7A, centroid 1, red). Also, hydrogen bonds from Thr72 OH to Gly230 O or Thr231 OH are more populated in TyrDown (44% occupancy; Figure 7A, centroid 4, yellow) than in TyrBack (15%).
Figure 7.

Hydrogen bonds between residues in the flap and the base of the binding site in representative TyrDown and TyrBack centroids. The coloring is the same as that in Figure 4. A. TyrDown centroids. The centroid of cluster 1 (the most populous; red) displays a water-mediated hydrogen bond from Tyr71 OH to Gln12 backbone O. The centroid of cluster 2 (pink) has a hydrogen bond from Tyr71 OH to Asp32 side chain OH. The centroid of cluster 4 (yellow) has a hydrogen bond from Thr72 OH to Gly230 O. B. TyrBack conformations. The centroid of cluster 1 (red) displays the conserved hydrogen bond network involving Trp76, Tyr71, W2, and Ser35. For clarity, the Ser35 side chain is omitted, but its backbone ribbon is colored to show its general location. The centroid of cluster 8 (cyan) has a much lower flap with a direct hydrogen bond from Tyr71 OH to Asn37 backbone O. Another representative frame (purple; not one of the ten centroids) has a Tyr71 OH-W2 hydrogen bond but not Trp76 NH-Tyr71 OH. In both A and B, centroids are shown with more elevated flaps (A, centroid 6, green; B, centroid 4, yellow) in which the flap residues have no interactions with the base of the binding site.
Direct interactions between the Tyr71 OH and the bottom of the binding site are less common for TyrBack. However, loss of W2 occurs twice within the TyrBack trajectories, about halfway through 1W50-D and 2ZHT. After this event in each simulation, hydrogen bonds between Tyr71 OH and either Ser35 OH or Asn37 backbone O (the two acceptors of W2 in the usual network) are much more populated (72% compared to 1.5% for frames with W2 present; Figure 7B, centroid 8, cyan). Also, the hydrogen bond with the Trp76 side chain is much less populated (22% compared to 82% for frames with the W2 present). The change in the hydrogen bonding structure allows for significant deviation from the expected χ1 value (Figure 2). Furthermore, the Z and Z’ values are generally lower when the Tyr71 side chain moves downward to compensate for the absent W2, although there is some variability in flap elevation with 2ZHT (Supporting Information Figure S4, S7).
In brief periods when the restrictive hydrogen bonds are broken, however, the flap is able to adopt much more elevated structures. For TyrDown, higher Z values invariably occur with a twisted flap (Figure 6A; Figure 7A, centroid 6, green). For TyrBack, the most extensive period of an elevated flap occurs during 1W50-B (Supporting Information Figure S4, S7) when the hydrogen bond between Tyr71 and W2 is broken, although W2 remains in place. After the opening event, reformation of a hydrogen bond between the same two atoms in a different arrangement in which the Tyr71 OH does not accept from the Trp76 side chain (Figure 7B, purple) results in the stabilization of the Tyr71 with a significant deviation from the typical χ1 angle (Figure 2).
On the whole, the TyrDown orientation allows less flexibility than TyrBack. This is evident in two ways. Firstly, the B-factors of the Cα atoms of the flap residues display this difference (Figure 5). Secondly, the average pairwise RMSDs between TyrDown centroids (1.92 ± 0.59 Å; error is standard deviation) is somewhat less than that for the TyrBack centroids (2.77 ± 1.17 Å), although the TyrDown value is within 1 standard deviation of the measurement for TyrBack. These data show that in addition to controlling the specific conformations that the flap samples, the Tyr71 orientation influences flap flexibility in general.
To further explore the role of Tyr71 in determining flap conformation, a simulation of Y71A mutant BACE1 was performed. Removal of the side chain at residue 71 results in very different behavior of the flap. All the metrics, Z, Z’, X, Y, and ϕ, are markedly different from those of the wild-type simulations (Figure 3). Focusing on the flap twist, it is apparent that the lack of the side chain interactions at residue 71 allows the flap to twist up and away from the catalytic Asp residues, resulting in negative values of ϕ that are not observed in wild-type (Figure 3H). The negative flap twist results in the unusual situation that the Z’ values are slightly lower than the Z values (Figure 3C,F). Focusing on the elevation, the flap remained in an elevated position for the majority of the simulation with Z values of 15–19 Å, significantly higher than in the wild-type simulations, even the short TyrUp trajectory (Figure 3C). These Z values for the Y71A simulation exceeded that for the 1SGZ crystal structure on which it was based (15.3 Å) and are in the range of those for the other apo, wild-type crystal structures. Thus the Y71A simulation is the only one to extensively sample the elevated states of these structures. After sampling the elevated state for ~13.5 ns, the flap abruptly changes to an extremely low conformation. While the twist remains negative, the Z and Z’ values of these flap conformations are centered at a peak lower than any of the wild-type simulations (Figure 3). The low elevation and negative twist are due in part to the fact that the Gln73 side chain NH2 group becomes trapped, forming two very stable hydrogen bonds with the backbone carbonyls of Gly230 and Gln12. The conformations of the flap that allow Gln73 to attain this position display a kink just N-terminal to Ala71 that places its Cβ atom relatively close to the Tyr76 side chain, a movement that is much less favorable for the wild-type flap with the TyrBack orientation due to sterics. This suggests that Tyr71 is the optimal size to prevent flap collapse. The differences in the structures sampled during this simulation are readily seen in the centroids based on clustering (Figure 4E,F). Some of the most elevated centroids appear to have a curl in the flap tip when viewed laterally (Figure 4E), but actually, measurement of the characteristic flap curl angle reveals that this is not the case. The measurements of the flap curl for every Y71A centroid lies between 82° and 95°, essentially the range of the uncurled flaps of the 1FKN and 1SGZ crystal structures (83.3° and 96.8°, respectively).
The lack of the side chain also significantly increases the flexibility of the flap. In the Y71A simulation, the B-factors of the flap Cα atoms were greater than those in either TyrBack or TyrDown (Figure 5). Furthermore, the average pairwise RMSD between the Y71A centroids is 3.40 ± 1.53 Å, again, greater than that for either TyrBack or TyrDown.
Conformational transitions
During the apo simulations, a total of nine transitions between Tyr71 rotameric states were observed in five different simulations, including all of the 1SGZ simulations (Figure 2). Several different patterns were seen. In 1SGZ-A, Tyr71 interconverts three times between the TyrUp orientation seen in the crystal structure and the TyrDown state, twice very early in equilibration. The TyrUp then remains stable for ~4 ns of production before rotating a final time to TyrDown. In 1SGZ-B, all three states are sampled: it flips from the TyrUp state to TyrDown during equilibration, is stable for ~5 ns, and then flips to the TyrBack state for the remainder of the simulation. In 1SGZ-C, the orientation transitions from TyrUp to TyrBack for a very brief time before stabilizing at TyrDown for the full length of production. In 1SGZ-D, a single transition from TyrUp to TyrDown occurs during equilibration. Finally, in 1W50-C, the only 1W50 simulation that displays a transition, the initial TyrBack orientation flips to TyrDown during equilibration, which is stable for the rest of the simulation. Most of the possible transitions occur: TyrUp to TyrDown and the reverse (five occurrences), TyrDown to TyrBack and the reverse (three occurrences), and TyrUp to TyrBack (one occurrence). It is notable that there is only one direct transition between TyrUp and TyrBack. This suggests that such a transition is a rare event due to the physical structure of the active site and the flap; TyrDown is a necessary intermediate between the two. More examples of transitions are needed to make a definitive statement, though, especially given that most of the current examples (all but two) occur during equilibration and may not truly reflect the native protein’s behavior.
In the simulations where transitions happen during equilibration, there is little data to show before/after effects, but two of the simulations based on 1SGZ can be examined in more detail because the change occurs well into production. Figure 8 provides a comparison of the flap main chain RMSD between all frames of the trajectories. Figure 8A and B clearly show a large transition at the time of the Tyr71 orientational change. Other conformational changes between substates are apparent throughout both simulations; some of those in 1SGZ-A represent as large a conformational change as the main transition when measured by the RMSD between adjacent structures. Nevertheless, this again demonstrates that a substantial conformational change in the flap accompanies a transition in Tyr71 orientation. The Y71A simulation shown in Figure 8C is presented to highlight its remarkable conformational transition as well.
Figure 8.
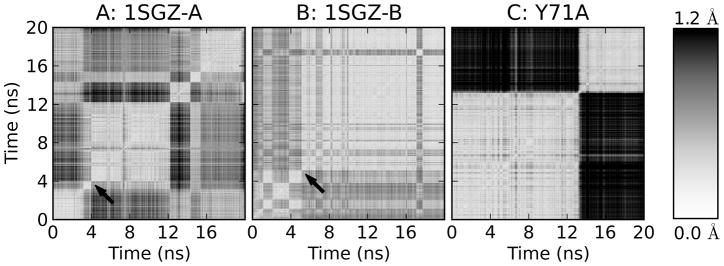
2D RMSD plots showing the pairwise main chain flap RMSD for the frames in simulations 1SGZ-A, 1SGZ-B, and Y71A. 1SGZ-A and -B are the two simulations that display a Tyr71 transition during production. The time that the Tyr71 orientation changes is noted with arrows; in both cases, there is an immediate drastic shift in flap conformation. Conformational changes are apparent at other times as well. The Y71A plot shows that this flap also samples multiple states.
In Figure 2, the behavior of Tyr71 χ1 is overlaid on the flap twist for simulations with transitions between Tyr71 states. In most events where the state changes, the flap adopts a highly twisted conformation, often with ϕ ≥ 40°, regardless of whether the event occurs during equilibration or production. Quantifying these data, the mean ϕ values for the 100 ps immediately before and after the transition, shown in Table I, are almost always higher than the overall mean ϕ values for the particular Tyr71 orientations involved. The tendency towards large twists is especially prominent in the two production transitions. Immediately before and after the TyrUp to TyrDown transition in 1SGZ-A, the flap twist is 20–30° higher than the overall means for those two orientations. Likewise, immediately before and after the TyrDown to TyrBack transition in 1SGZ-C, the flap twist is 5–20° higher. This implies that a twist is required for a transition, but it does not appear to force a transition because many points in the simulations have ϕ ≥ 40° while remaining in their rotameric state.
Table I.
〈ϕ〉 Values for All Frames and for 100-ps Segments Immediately Before and After Tyr71 χ1 Transitions
| Simulation | All frames | 1SGZ-Aa | 1SGZ-Ba | 1SGZ-Ca | 1SGZ-Da | 1W50-Ca |
|---|---|---|---|---|---|---|
| χ1b | U | U→D | U→D | U→B | U→D | U→D |
| 〈ϕ〉 | 10.0 | 19.8→41.7 | 25.9→30.5 | 4.4→36.4 | 35.6→56.1 | 39.8→47.1 |
|
| ||||||
| χ1b | D | D→U | D→Bc | B→D | ||
| 〈ϕ〉 | 24.9 | 33.7→−1.8 | 45.5→17.7 | 29.2→39.6 | ||
|
| ||||||
| χ1b | B | U→Dc | ||||
| 〈ϕ〉 | 12.5 | 31.7→59.3 | ||||
Average values for the frames 100 ps before and after each transition in the given simulation.
U: TyrUp, D: TyrDown, B: TyrBack.
Transitions noted in bold occurred during production, not equilibration.
Relative stabilities of the Tyr71 orientations
It is difficult to precisely determine the relative stabilities between TyrUp, TyrDown, and TyrBack from our simulations. The small number of transitions indicates that complete sampling of the Tyr71 orientation has not been achieved, even with 180 ns of data. However, it is almost certain that TyrUp is much less stable than either TyrBack or TyrDown. In the current data set, only ~2% of the frames have the TyrUp orientation. Even that small number is almost certainly an overestimate of the true occupancy, because we observed only transitions from TyrUp but none to it (except for one during equilibration), and our simulations are biased towards TyrUp because four of them began in that state.
It is much less clear how TyrDown and TyrBack compare to each other. The low frequency of interconversion demonstrates that the barrier between the two orientations is relatively high, but the simulations provide little information about the energy difference between them. It cannot be ruled out that there is a large difference in energy favoring TyrBack. In an extreme scenario, TyrDown is an artifact that appears in these simulations solely because the system is transiently trapped in a high-energy local minimum but does not have time to reach the dominant global minimum, TyrBack. However, such an extreme case seems unlikely, given the facts that some aspartyl proteases have been crystallized with the TyrDown orientation13–16 and that one simulation starting with TyrBack did convert to TyrDown (1W50-C, Figure 2G), albeit during equilibration. Therefore, a more modest energy difference appears more reasonable. Moreover, the conclusion from our simulations that Tyr71 is a key determinant in flap flexibility and conformations remains valid regardless the relative populations of the two orientations.
It appears that the extent and type of intramolecular interactions involving Tyr71 are responsible for the relatively high stabilities of TyrBack and TyrDown compared with TyrUp. The stability of TyrBack is predominantly due to the hydrogen bonds between the Tyr71 side chain, Trp76, and W2. The stability of the TyrDown orientation arises mainly through favorable but nonspecific van der Waals contacts between Tyr71 and the hydrophobic residues Leu30, Phe108, Trp115, and Ile118 that form the S1 pocket of the binding site. In contrast, in the TyrUp orientation, there are few contacts between Tyr71 and the rest of the protein. The hydrogen bond from Tyr71 OH to the Lys107 carbonyl O that crystallographers initially hypothesized would stabilize the TyrUp orientation9 is occupied infrequently (~3% of the TyrUp trajectory). Low occupancy was also seen in previous MD simulations.17 Therefore, the TyrUp orientation probably is stabilized merely by the barriers to rotation about the χ1 angle instead of favorable interactions with the rest of the protein. Furthermore, in a study across a wide range of protein structures, the least occupied rotamer for Tyr had a χ1 angle of +60° (the same rotamer as TyrUp), indicating it is intrinsically the least favorable orientation because of the geometry of amino acids.43
Low occupancy of the elevated flap conformations
As mentioned previously, only the Y71A simulation extensively samples flap conformations that are elevated to the degree of the apo crystal structures (Figure 3C,F). In the wild-type simulations, the flap shows flexibility in twisting but not as much elevation as might be expected from the crystal structures. The Z values almost never exceed the crystallographic values (just 1% and 0.2% all the wild-type frames exceed the 1SGZ and 1W50 Z values, respectively). The Z’ values trend somewhat higher, due to the fact that this metric controls for the large twists of the TyrDown simulations. However, even here, only 4% of all wild-type frames (3% of TyrDown, 4% of TyrBack, and 22% of TyrUp) have Z’ values in excess of that for 1SGZ, and just 0.4% exceeded 1W50. It is interesting that flap elevation occurs most readily with the TyrUp orientation, although as mentioned earlier, TyrUp’s population in solution is probably extremely low.
Therefore, the simulations suggest that flap opening for BACE1 in solution is not common, occurring at most ~4% of the time. This raises the question of why the flaps in the unbound crystal structures are always elevated instead of closed.
One possibility is as follows. It is clear both from crystallography and modeling that, although the flap in bound BACE1 is quite rigid, there is a wide range of conformations accessible to the unbound flap.9–11,17 Some conformations of this ensemble are represented in the crystal structures. Often, the position of the flexible flap is influenced by crystal packing, so the crystallographic conditions may preferentially stabilize a form that is not commonly found in solution.12 For example, in both 1W50 and 2ZHT, the crystal packing is such that the flaps of adjacent proteins are interdigitated, projecting into each other’s binding sites (Supporting Information Figure S24). Clearly, this is not the functional form of BACE1, and there are numerous contacts between the flap and the symmetrically-related protein. In 1W50, several interactions, including those involving the side chain of Pro70, the Tyr71 backbone O atom, and especially the Gln73 side chain, seem to pull upwards on the flap, moving it away from the binding site. In 2ZHT, there are no specific inter-flap contacts, but symmetrically-related Thr72 OH atoms are only 4.2 Å apart, and the side chain of Gln73, less than 5 Å from Tyr71 of the adjacent protein, lies directly between the flap and the base of the binding site in the symmetric partner. It is significant that both 1W50 and 2ZHT display the TyrBack orientation, but the usual hydrogen bond with Trp76 is disrupted because of the displacement of Tyr71. Instead, Trp76 donates weakly to relatively distant water molecules, with heavy atom-heavy atom distances of 3.3 and 3.2 Å in 1W50 and 2ZHT, respectively, and Tyr71 lacks an ordered hydrogen bond donor. This results in considerable enthalpic and entropic penalties that are probably unfavorable without the influence of external forces on the flap. The expected hydrogen bonding arrangement is quickly restored in our MD simulations, even though the crystallographic water molecules are preserved in system setup. Even more noteworthy is the fact that the other apo crystal structure, 1SGZ, is in a different space group in which the flaps are more exposed and has a Z value less than that of 1W50 or 2ZHT by more than 1 Å. Taken together, it is quite possible that crystallographic contacts artificially stabilize the highly elevated flap in 1W50 and 2ZHT, and that such a conformation would not be significantly populated in solution. On the other hand, no specific contacts appear to influence the flap conformation in 1SGZ, but undoubtedly even this crystal structure is somewhat determined by crystallographic conditions. Furthermore, it is notable that the 1SGZ structure has a TyrUp orientation, which although poorly populated in solution, displayed an elevated flap with much greater frequency than either TyrDown or TyrBack.
TyrDown/twisted conformation as a target for drug design
The TyrDown orientation, in which Tyr71 occupies the S1 pocket of the binding site, and the unusual twisted flap conformations that often accompanies it, have not yet been observed in BACE1 crystal structures. However, they are reminiscent of several unusual crystal structures of chymosin and saccharopepsin that also have a TyrDown orientation and a similarly twisted flap.13–16 The value of ϕ in these structures is ~58°, a relatively high value consistently observed in stretches of at least 1 ns in all TyrDown trajectories (Figure 2). The fact that there is precedent for this conformation in the crystallographic data of aspartyl proteases suggests that our observation is not merely an artifact of the simulation.
One of the crystallographic reports suggested that a reason this conformation is so rarely observed in crystal structures of aspartyl proteases is that a Gly residue is required at position 72 of the flap tip (BACE1 numbering) to allow the appropriate degree of flexibility.16 However, BACE1 has a Thr residue at position 72, so it is interesting to observe the stability of the twisted flap conformation in this enzyme.
It is possible that the twisted conformations explored in our simulations could be used to identify new BACE1 inhibitors through structure-based drug design, because the TyrDown orientation appears to be a relatively stable form of BACE1. The binding site in the region of S1 and S2’ has a much different character than that of the typically seen TyrBack, closed flap conformations, so inhibitors that bind to this conformation are likely to be substantially different from those already known. Because Tyr71 occupies the S1 pocket, it is not available for ligand binding, although a new hydrophobic face of a different shape is presented, formed by Ile118 and the edge of Tyr71. Also, the absence of the Tyr71 hydroxyl group from the conserved hydrogen bond network exposes the Trp76 side chain NH and W2, and perhaps even allowing for the displacement of W2 and the exposure of Asn37 O and Ser35 OH. There is precedent for an inhibitor displacing Tyr71 from its TyrBack orientation and accepting a hydrogen bond from the Trp76 NH in the crystal structures of 2Q11 and 3H0B.19,21 Incidentally, these crystal structures have Tyr71 orientation with χ1 = 180° (the same rotamer as TyrDown), although the orientation is not truly TyrDown because the ligand binds in S1, preventing the Tyr71 side chain from doing so and stabilizing a twisted conformation.
Conclusion
Our MD simulations of wild-type and Y71A-mutant BACE1 have resulted in a number of interesting findings regarding the flap and the invariant residue Tyr71. This residue has already been implicated in substrate binding and catalysis in the function of aspartyl proteases, and now we add the important role of controlling flap flexibility and opening. Each of the three side chain orientations of Tyr71 leads to distinct motions of the flap, both in elevation and twist. Furthermore, removal of the side chain by mutation to alanine leads to an even more mobile flap that accesses still other conformations. Altogether, our results provide clear evidence that Tyr71 dictates the motion and conformations of the flap as a whole.
It is acknowledged that the simulations here do not allow for the determination of the relative energies, and therefore populations, of the three orientations, because so few transitions between them were observed. In particular, it cannot be ruled out that TyrDown is high in energy compared to TyrBack and represents a lowly populated orientation that appears here only because it is a necessary transition between the TyrUp (the starting orientation in four of the simulations) and the global minimum, TyrBack. However, it is more likely that the energy difference between TyrDown and TyrBack is modest, and regardless of its precise value, the key conclusion that Tyr71 is a major determinant of flap conformation and flexibility remains valid.
The TyrDown orientation tends to yield a twisted flap conformation that has been previously unreported for BACE1. It will be interesting to see if novel inhibitors can be found to target this new conformation of the binding site. It is important that we gain a better understanding of the mobility of the flap, a key part of the binding site, to assist in the development of improved inhibitors for this important Alzheimer’s disease target. It may be possible to lock the flap in one of its rarer conformational states as a new mechanism of inhibition.
Supplementary Material
Acknowledgments
This work has been supported by the National Institutes of Health (grant GM65372 to HAC).
Footnotes
Institution at which work was performed:
Department of Medicinal Chemistry, College of Pharmacy, University of Michigan, 428 Church St., Ann Arbor, MI 48109-1065
Contributor Information
Steven A. Spronk, Department of Medicinal Chemistry, College of Pharmacy, University of Michigan
Heather A. Carlson, Department of Medicinal Chemistry, College of Pharmacy, University of Michigan
References
- 1.Selkoe DJ. Alzheimer disease: mechanistic understanding predicts novel therapies. Ann Intern Med. 2004;140(8):627–638. doi: 10.7326/0003-4819-140-8-200404200-00047. [DOI] [PubMed] [Google Scholar]
- 2.Blennow K, de Leon MJ, Zetterberg H. Alzheimer's disease. Lancet. 2006;368(9533):387–403. doi: 10.1016/S0140-6736(06)69113-7. [DOI] [PubMed] [Google Scholar]
- 3.Citron M. Beta-secretase inhibition for the treatment of Alzheimer's disease--promise and challenge. Trends Pharmacol Sci. 2004;25(2):92–97. doi: 10.1016/j.tips.2003.12.004. [DOI] [PubMed] [Google Scholar]
- 4.Cai H, Wang Y, McCarthy D, Wen H, Borchelt DR, Price DL, Wong PC. BACE1 is the major beta-secretase for generation of Abeta peptides by neurons. Nat Neurosci. 2001;4(3):233–234. doi: 10.1038/85064. [DOI] [PubMed] [Google Scholar]
- 5.Luo Y, Bolon B, Kahn S, Bennett BD, Babu-Khan S, Denis P, Fan W, Kha H, Zhang J, Gong Y, Martin L, Louis JC, Yan Q, Richards WG, Citron M, Vassar R. Mice deficient in BACE1, the Alzheimer's beta-secretase, have normal phenotype and abolished beta-amyloid generation. Nat Neurosci. 2001;4(3):231–232. doi: 10.1038/85059. [DOI] [PubMed] [Google Scholar]
- 6.Roberds SL, Anderson J, Basi G, Bienkowski MJ, Branstetter DG, Chen KS, Freedman SB, Frigon NL, Games D, Hu K, Johnson-Wood K, Kappenman KE, Kawabe TT, Kola I, Kuehn R, Lee M, Liu W, Motter R, Nichols NF, Power M, Robertson DW, Schenk D, Schoor M, Shopp GM, Shuck ME, Sinha S, Svensson KA, Tatsuno G, Tintrup H, Wijsman J, Wright S, McConlogue L. BACE knockout mice are healthy despite lacking the primary beta-secretase activity in brain: implications for Alzheimer's disease therapeutics. Hum Mol Genet. 2001;10(12):1317–1324. doi: 10.1093/hmg/10.12.1317. [DOI] [PubMed] [Google Scholar]
- 7.Vassar R, Bennett BD, Babu-Khan S, Kahn S, Mendiaz EA, Denis P, Teplow DB, Ross S, Amarante P, Loeloff R, Luo Y, Fisher S, Fuller J, Edenson S, Lile J, Jarosinski MA, Biere AL, Curran E, Burgess T, Louis JC, Collins F, Treanor J, Rogers G, Citron M. Beta-secretase cleavage of Alzheimer's amyloid precursor protein by the transmembrane aspartic protease BACE. Science. 1999;286(5440):735–741. doi: 10.1126/science.286.5440.735. [DOI] [PubMed] [Google Scholar]
- 8.Hong L, Koelsch G, Lin X, Wu S, Terzyan S, Ghosh AK, Zhang XC, Tang J. Structure of the protease domain of memapsin 2 (beta-secretase) complexed with inhibitor. Science. 2000;290(5489):150–153. doi: 10.1126/science.290.5489.150. [DOI] [PubMed] [Google Scholar]
- 9.Hong L, Tang J. Flap position of free memapsin 2 (beta-secretase), a model for flap opening in aspartic protease catalysis. Biochemistry. 2004;43(16):4689–4695. doi: 10.1021/bi0498252. [DOI] [PubMed] [Google Scholar]
- 10.Patel S, Vuillard L, Cleasby A, Murray CW, Yon J. Apo and inhibitor complex structures of BACE (beta-secretase) J Mol Biol. 2004;343(2):407–416. doi: 10.1016/j.jmb.2004.08.018. [DOI] [PubMed] [Google Scholar]
- 11.Shimizu H, Tosaki A, Kaneko K, Hisano T, Sakurai T, Nukina N. Crystal structure of an active form of BACE1, an enzyme responsible for amyloid beta protein production. Molecular and cellular biology. 2008;28(11):3663–3671. doi: 10.1128/MCB.02185-07. [DOI] [PMC free article] [PubMed] [Google Scholar]
- 12.Andreeva NS, Rumsh LD. Analysis of crystal structures of aspartic proteinases: on the role of amino acid residues adjacent to the catalytic site of pepsin-like enzymes. Protein Sci. 2001;10(12):2439–2450. doi: 10.1110/ps.25801. [DOI] [PMC free article] [PubMed] [Google Scholar]
- 13.Gilliland GL, Winborne EL, Nachman J, Wlodawer A. The three-dimensional structure of recombinant bovine chymosin at 2.3 A resolution. Proteins. 1990;8(1):82–101. doi: 10.1002/prot.340080110. [DOI] [PubMed] [Google Scholar]
- 14.Newman M, Safro M, Frazao C, Khan G, Zdanov A, Tickle IJ, Blundell TL, Andreeva N. X-ray analyses of aspartic proteinases. IV. Structure and refinement at 2.2 A resolution of bovine chymosin. J Mol Biol. 1991;221(4):1295–1309. [PubMed] [Google Scholar]
- 15.Strop P, Sedlacek J, Stys J, Kaderabkova Z, Blaha I, Pavlickova L, Pohl J, Fabry M, Kostka V, Newman M, et al. Engineering enzyme subsite specificity: preparation, kinetic characterization, and X-ray analysis at 2.0-A resolution of Val111Phe site-mutated calf chymosin. Biochemistry. 1990;29(42):9863–9871. doi: 10.1021/bi00494a016. [DOI] [PubMed] [Google Scholar]
- 16.Gustchina A, Li M, Phylip LH, Lees WE, Kay J, Wlodawer A. An unusual orientation for Tyr75 in the active site of the aspartic proteinase from Saccharomyces cerevisiae. Biochem Biophys Res Commun. 2002;295(4):1020–1026. doi: 10.1016/s0006-291x(02)00742-8. [DOI] [PubMed] [Google Scholar]
- 17.Gorfe AA, Caflisch A. Functional plasticity in the substrate binding site of beta-secretase. Structure. 2005;13(10):1487–1498. doi: 10.1016/j.str.2005.06.015. [DOI] [PubMed] [Google Scholar]
- 18.Andreeva N, Dill J, Gilliland GL. Can enzymes adopt a self-inhibited form? Results of x-ray crystallographic studies of chymosin. Biochem Biophys Res Commun. 1992;184(2):1074–1081. doi: 10.1016/0006-291x(92)90701-l. [DOI] [PubMed] [Google Scholar]
- 19.Baxter EW, Conway KA, Kennis L, Bischoff F, Mercken MH, Winter HL, Reynolds CH, Tounge BA, Luo C, Scott MK, Huang Y, Braeken M, Pieters SM, Berthelot DJ, Masure S, Bruinzeel WD, Jordan AD, Parker MH, Boyd RE, Qu J, Alexander RS, Brenneman DE, Reitz AB. 2-Amino-3,4-dihydroquinazolines as inhibitors of BACE-1 (beta-site APP cleaving enzyme): Use of structure based design to convert a micromolar hit into a nanomolar lead. J Med Chem. 2007;50(18):4261–4264. doi: 10.1021/jm0705408. [DOI] [PubMed] [Google Scholar]
- 20.Nicholls A, McGaughey GB, Sheridan RP, Good AC, Warren G, Mathieu M, Muchmore SW, Brown SP, Grant JA, Haigh JA, Nevins N, Jain AN, Kelley B. Molecular Shape and Medicinal Chemistry: A Perspective. J Med Chem. 2010;53(10):3862–3886. doi: 10.1021/jm900818s. [DOI] [PMC free article] [PubMed] [Google Scholar]
- 21.Stachel SJ, Coburn CA, Rush D, Jones KLG, Zhu H, Rajapakse H, Graham SL, Simon A, Katharine Holloway M, Allison TJ, Munshi SK, Espeseth AS, Zuck P, Colussi D, Wolfe A, Pietrak BL, Lai M-T, Vacca JP. Discovery of aminoheterocycles as a novel b-secretase inhibitor class: pH dependence on binding activity part 1. Bioorg Med Chem Lett. 2009;19(11):2977–2980. doi: 10.1016/j.bmcl.2009.04.033. [DOI] [PubMed] [Google Scholar]
- 22.Yang W, Fucini RV, Fahr BT, Randal M, Lind KE, Lam MB, Lu W, Lu Y, Cary DR, Romanowski MJ, Colussi D, Pietrak B, Allison TJ, Munshi SK, Penny DM, Pham P, Sun J, Thomas AE, Wilkinson JM, Jacobs JW, McDowell RS, Ballinger MD. Fragment-based discovery of nonpeptidic BACE-1 inhibitors using tethering. Biochemistry. 2009;48(21):4488–4496. doi: 10.1021/bi900017q. [DOI] [PubMed] [Google Scholar]
- 23.Park YN, Aikawa J, Nishiyama M, Horinouchi S, Beppu T. Involvement of a residue at position 75 in the catalytic mechanism of a fungal aspartic proteinase, Rhizomucor pusillus pepsin. Replacement of tyrosine 75 on the flap by asparagine enhances catalytic efficiency. Protein Eng. 1996;9(10):869–875. doi: 10.1093/protein/9.10.869. [DOI] [PubMed] [Google Scholar]
- 24.Suzuki J, Sasaki K, Sasao Y, Hamu A, Kawasaki H, Nishiyama M, Horinouchi S, Beppu T. Alteration of catalytic properties of chymosin by site-directed mutagenesis. Protein Eng. 1989;2(7):563–569. doi: 10.1093/protein/2.7.563. [DOI] [PubMed] [Google Scholar]
- 25.Berman HM, Westbrook J, Feng Z, Gilliland G, Bhat TN, Weissig H, Shindyalov IN, Bourne PE. The Protein Data Bank. Nucleic Acids Res. 2000;28(1):235–242. doi: 10.1093/nar/28.1.235. [DOI] [PMC free article] [PubMed] [Google Scholar]
- 26.Ghosh AK, Kumaragurubaran N, Hong L, Lei H, Hussain KA, Liu CF, Devasamudram T, Weerasena V, Turner R, Koelsch G, Bilcer G, Tang J. Design, synthesis and X-ray structure of protein-ligand complexes: important insight into selectivity of memapsin 2 (beta-secretase) inhibitors. J Am Chem Soc. 2006;128(16):5310–5311. doi: 10.1021/ja058636j. [DOI] [PMC free article] [PubMed] [Google Scholar]
- 27.Sinha S, Anderson JP, Barbour R, Basi GS, Caccavello R, Davis D, Doan M, Dovey HF, Frigon N, Hong J, Jacobson-Croak K, Jewett N, Keim P, Knops J, Lieberburg I, Power M, Tan H, Tatsuno G, Tung J, Schenk D, Seubert P, Suomensaari SM, Wang S, Walker D, Zhao J, McConlogue L, John V. Purification and cloning of amyloid precursor protein beta-secretase from human brain. Nature. 1999;402(6761):537–540. doi: 10.1038/990114. [DOI] [PubMed] [Google Scholar]
- 28.Park H, Lee S. Determination of the active site protonation state of beta-secretase from molecular dynamics simulation and docking experiment: implications for structure-based inhibitor design. J Am Chem Soc. 2003;125(52):16416–16422. doi: 10.1021/ja0304493. [DOI] [PubMed] [Google Scholar]
- 29.Yang W, Lu W, Lu Y, Zhong M, Sun J, Thomas AE, Wilkinson JM, Fucini RV, Lam M, Randal M, Shi XP, Jacobs JW, McDowell RS, Gordon EM, Ballinger MD. Aminoethylenes: a tetrahedral intermediate isostere yielding potent inhibitors of the aspartyl protease BACE-1. J Med Chem. 2006;49(3):839–842. doi: 10.1021/jm0509142. [DOI] [PubMed] [Google Scholar]
- 30.Case DA, Darden TA, Cheatham ITE, Simmerling CL, Wang J, Duke RE, Luo R, Merz KM, Wang B, Pearlman DA, Crowley M, Brozell S, Tsui V, Gohlke H, Mongan J, Hornak V, Cui G, Beroza P, Schafmeister C, Caldwell JW, Ross WS, Kollman PA. AMBER. Vol. 8. University of California; San Francisco: 2004. [Google Scholar]
- 31.Meagher KL, Carlson HA. Solvation influences flap collapse in HIV-1 protease. Proteins. 2005;58(1):119–125. doi: 10.1002/prot.20274. [DOI] [PubMed] [Google Scholar]
- 32.Duan Y, Wu C, Chowdhury S, Lee MC, Xiong G, Zhang W, Yang R, Cieplak P, Luo R, Lee T, Caldwell J, Wang J, Kollman P. A point-charge force field for molecular mechanics simulations of proteins based on condensed-phase quantum mechanical calculations. J Comput Chem. 2003;24(16):1999–2012. doi: 10.1002/jcc.10349. [DOI] [PubMed] [Google Scholar]
- 33.Jorgensen WL, Chandrasekhar J, Madura JD, Impey RW, Klein ML. Comparison Of Simple Potential Functions For Simulating Liquid Water. J Chem Phys. 1983;79(2):926–935. [Google Scholar]
- 34.Pigache A, Cieplak P, Dupradeau FY. Automatic and highly reproducible RESP and ESP charge derivation: Application to the development of programs RED and X RED. Abstracts Of Papers Of The American Chemical Society. 2004;227:U1011–U1011. [Google Scholar]
- 35.Berendsen HJC, Postma JPM, Vangunsteren WF, Dinola A, Haak JR. Molecular-dynamics with coupling to an external bath. J Chem Phys. 1984;81(8):3684–3690. [Google Scholar]
- 36.Humphrey W, Dalke A, Schulten K. VMD: Visual molecular dynamics. J Mol Graph. 1996;14(1):33–38. doi: 10.1016/0263-7855(96)00018-5. [DOI] [PubMed] [Google Scholar]
- 37.DeLano WL. The PyMOL Molecular Graphics System. Palo Alto, CA, USA: DeLano Scientific; 2002. [Google Scholar]
- 38.Shao J, Tanner SW, Thompson N, Cheatham TE., III Clustering Molecular Dynamics Trajectories: 1. Characterizing the Performance of Different Clustering Algorithms. J Chem Theory Comput. 2007;3(6):2312–2334. doi: 10.1021/ct700119m. [DOI] [PubMed] [Google Scholar]
- 39.Cascella M, Micheletti C, Rothlisberger U, Carloni P. Evolutionarily conserved functional mechanics across pepsin-like and retroviral aspartic proteases. J Am Chem Soc. 2005;127(11):3734–3742. doi: 10.1021/ja044608+. [DOI] [PubMed] [Google Scholar]
- 40.Neri M, Cascella M, Micheletti C. The influence of conformational fluctuations on enzymatic activity: modelling the functional motion of beta-secretase. J Phys-Cond Matt. 2005;17(18):S1581–S1593. [Google Scholar]
- 41.Xiong B, Huang XQ, Shen LL, Shen JH, Luo XM, Shen X, Jiang HL, Chen KX. Conformational flexibility of beta-secretase: molecular dynamics simulation and essential dynamics analysis. Acta Pharmacol Sin. 2004;25(6):705–713. [PubMed] [Google Scholar]
- 42.Zuo Z, Gang C, Zou H, Mok PC, Zhu W, Chen K, Jiang H. Why does beta-secretase zymogen possess catalytic activity? Molecular modeling and molecular dynamics simulation studies. Comput Biol Chem. 2007;31(3):186–195. doi: 10.1016/j.compbiolchem.2007.03.007. [DOI] [PubMed] [Google Scholar]
- 43.Dunbrack RL, Karplus M. Backbone-Dependent Rotamer Library For Proteins -Application To Side-Chain Prediction. J Mol Biol. 1993;230(2):543–574. doi: 10.1006/jmbi.1993.1170. [DOI] [PubMed] [Google Scholar]
Associated Data
This section collects any data citations, data availability statements, or supplementary materials included in this article.