

Abstract
Fructose intake has increased dramatically since humans were hunter-gatherers, probably outpacing the capacity of human evolution to make physiologically healthy adaptations. Epidemiological data indicate that this increasing trend continued until recently. Excessive intakes that chronically increase portal and peripheral blood fructose concentrations to >1 and 0.1 mm, respectively, are now associated with numerous diseases and syndromes. The role of the fructose transporters GLUT5 and GLUT2 in causing, contributing to or exacerbating these diseases is not well known. GLUT5 expression seems extremely low in neonatal intestines, and limited absorptive capacities for fructose may explain the high incidence of malabsorption in infants and cause problems in adults unable to upregulate GLUT5 levels to match fructose concentrations in the diet. GLUT5- and GLUT2-mediated fructose effects on intestinal electrolyte transporters, hepatic uric acid metabolism, as well as renal and cardiomyocyte function, may play a role in fructose-induced hypertension. Likewise, GLUT2 may contribute to the development of non-alcoholic fatty liver disease by facilitating the uptake of fructose. Finally, GLUT5 may play a role in the atypical growth of certain cancers and fat tissues. We also highlight research areas that should yield information needed to better understand the role of these GLUTs in fructose-induced diseases.
 |
Veronique Douard (right) is an instructor and Ronaldo P. Ferraris (left) is a professor in the Department of Pharmacology and Physiology at the New Jersey Medical School. Dr Douard received her undergraduate and graduate degrees in Biochemistry and Physiology from the University of Rennes, France. After a postdoctoral fellowship in lipid biochemistry at the National Institute for Agricultural Research (INRA), she joined Dr Ferraris’ laboratory where her major interest is in the nutritional regulation of hormones regulating mineral homeostasis. Dr Ferraris received his undergraduate and graduate degrees in Biology (Xavier University, Philippines) and Zoology (University of Hawaii) then worked briefly for international development agencies serving Southeast Asia. Political upheaval in his native Philippines forced an early career shift, and he was fortunate to receive a postdoctoral fellowship at UCLA in Professor Jared Diamond's laboratory to study the intestinal epithelium and identify the cell types able to perceive luminal signals that ultimately determine site density of sugar transporters. This sparked his lifelong interest in studying integrative regulatory processes involving nutrient transport and metabolism.
Introduction
GLUT5 and GLUT2 (encoded by the Slc2A5 and Slc2A2 genes, respectively) are members of the facilitative glucose transporter family and are the major fructose transporters in the body (Manolescu et al. 2007; Thorens & Mueckler, 2010). Both transporters are expressed significantly in the kidney and small intestine. GLUT5 is in the apical and GLUT2 in the basolateral membrane of enterocytes and renal proximal tubule cells. GLUT2 is the main fructose transporter in the basolateral (sinusoidal) membrane of liver hepatocytes (Keembiyehetty et al. 2006) where most of the ingested fructose is metabolized. The Km of GLUT5 for fructose is ∼6 mm and that of GLUT2 is ∼11 mm (Manolescu et al. 2007).
GLUT5−/− mice exhibit normal food intake and growth when fed fructose-free diets (Barone et al. 2009), but rapidly lose weight when fed fructose, as malabsorbed fructose causes massive distention, localized fluid retention and nutrient malabsorption in the gastrointestinal tract. GLUT2−/− mice exhibit a milder phenotype and can even transport glucose, but not its non-metabolizable analogues, across the intestinal mucosa (Stumpel et al. 2001; Hosokawa & Thorens, 2002).
Excessive and chronic consumption of the GLUT5 and GLUT2 substrate fructose has now been associated with numerous diseases and syndromes, most notably metabolic syndrome that includes hypertension, obesity, diabetes, hyperinsulinaemia and non-alcoholic fatty liver disease (NAFLD) as well as fructose malabsorption, gout, hyperuricaemia, breast cancer and renal disease. This brief review focuses on the potential role of GLUT5 and GLUT2 in the development of these diseases, specifically whether intestinal, renal and hepatic expression of these transporters changes. Since dietary fructose must be consumed, processed then absorbed by the small intestine prior to being metabolized by various organ systems, this review will initially provide a historical perspective of fructose intake by humans and describe the intestinal activity and expression of GLUT5 and GLUT2 during ontogenetic development and under conditions of chronically high fructose intakes. Then, it will focus on the expression of these transporters in the development of fructose-linked diseases in the liver, kidney and other organ systems. Due to limited space, this review will emphasize papers published after our 2008 review, and will not discuss the functional characteristics of these GLUTs as well as the large number of studies linking fructose to metabolic syndrome. It will also not cover the controversial but relevant hypothesis related to the translocation of GLUT2 to the apical membrane where it becomes the main sugar transporter (Au et al. 2002; Le Gall et al. 2007; Kellett et al. 2008; Chaudhry et al. 2012) but that has not been observed by others (Moran et al. 2010; Scow et al. 2011; Gorboulev et al. 2012; Gruzdkov et al. 2012) for reasons outlined in the review of Wright et al. (2011) on sodium glucose cotransport. Finally, we are not reviewing the extensive literature regarding GLUT2 and diabetes.
Fructose intake: from hunter gatherers to present
Dietary intake
Average fructose consumption rates have increased markedly in the USA, from 37 g day−1 in 1978 to 49 g day−1 in 2004 (Park & Yetley, 1993; Marriott et al. 2009), with the top 10% of the population now consuming 75 g day−1, from 64 g day−1 25 years ago (Fig. 1). This remarkable increase in total fructose intake is matched by a dramatic decrease from 35 to 16% in the proportion of dietary fructose coming from fruits, and a marked increase in the proportion contributed by fructose-based sweeteners. What remained consistent between 1978 and 2004 is the age-related difference in consumption rates, with teenagers and young adults consuming ∼20% more than senior adults. This trend of increasing fructose intake may now be reversed, as more recent data indicate that consumption of added sugars decreased between 2000 and 2008, mainly because of a reduction in consumption of regular sodas (Welsh et al. 2011).
Figure 1. Fructose intake by male Americans.
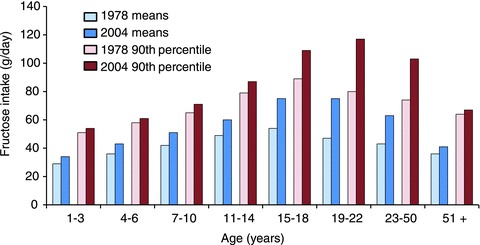
The average total (naturally occurring plus supplementary) fructose intake by male Americans in 1978 (light blue) and 2004 (dark blue) in various age groups. The higher fructose intake of the population belonging to the 90th percentile of fructose consumers (in red) is shown for comparison. Data were obtained from Park & Yetley (1993) and Marriott et al. (2009). Between 1978 and 2004, there has been a significant ∼10 to 20% increase in mean total fructose intake in children, and a marked ∼20 to 60% increase in teenagers and adults. Primarily because of lower body weights, the rate of total fructose intake is less in females, but otherwise the pattern of increases is generally similar to that of adult males. Fructose intake by adults in the 90th percentile is almost twice that of the general population, rendering tens of millions of Americans vulnerable to the risk factors associated with excessive consumption of this sugar.
Historical perspective
Prior to the industrial revolution, humans used for millennia high-fructose foods like fruits and honey only as occasional sweeteners, thus, they are adapted to low levels of dietary fructose. Ancestral human diets prevalent during human evolution were characterized by much lower levels of carbohydrates and sodium, much higher levels of fibre and protein, and comparable levels of (mostly unsaturated) fat and cholesterol, with nearly all carbohydrate coming from fruits and vegetables (Konner & Eaton, 2010). In fact, three-quarters of hunter-gatherer societies worldwide derived more than 50% of their subsistence from animals, whereas only ∼14% of these societies derived more than 50% of their subsistence from plants (Cordain et al. 2000). Although these hunter-gatherer societies had substantial variation in the carbohydrate content of their foods (Ströhle & Hahn, 2011), the range of energy intake from all carbohydrates in their diets (22–40%; Cordain et al. 2000) was markedly lower than the amounts currently consumed by Americans (∼50%; Welsh et al. 2011), and probably contained no sweeteners other than honey. After gathering wild honey for millennia as depicted in a rock painting in a Spanish cave made in ∼6000 BC, humans discovered beekeeping technology so that honey began to be mentioned frequently in ancient Egyptian, Indian and Chinese texts between 3000 and 6 BC (http://www.bee-hexagon.net). Sugarcane (Saccharum officinarum) is native to New Guinea, and table sugar, which is merely dried sugar cane juice, was probably known to Western Pacific peoples. In 510 BC, invading Persian soldiers found sugarcane along the Indus River and table sugar technology then gradually spread to the West (Howell, 2009), where for centuries sugar and honey, the only sweeteners, were expensive commodities (∼$100 kg−1 (at today's prices) in London in 1319 AD (http://www.sucrose.com), compared with <$5 kg−1 in many countries today). Only in the 1800s with increasing supplies from Caribbean plantations and with the discovery of an alternative sugar source, sugar beets, did prices begin to decrease. Prices plummeted further with the industrial-scale conversion of glucose to high-fructose corn syrups (Hanover & White, 1993). This enabled ordinary citizens to consume sugars (∼50% fructose) initially at 5 g day−1 in 1700 then to 120 g day−1 in 1950, and eventually to 180 g day−1 today (Johnson et al. 2009). Thus, sugar consumption increased almost 40-fold in the last 300 years. This astronomical increase in sugar, particularly fructose, intake that took place within a short timespan seems to have taken a toll on human health worldwide.
Concentrations and metabolism of fructose
Intestinal luminal and blood concentrations
Most of dietary fructose is added sugar found mainly in cereals and beverages. A regular soda may have up to 40 g of sugar per 330 ml, of which ∼20 g or 300 mm is fructose. The high concentrations of fructose in these foods and drinks should result in high intestinal luminal concentrations essential for driving the facilitated transporters responsible for its absorption. Though important, luminal fructose concentrations in the small intestine have not been studied nor considered rate-limiting, probably because the facilitative transporter GLUT5 is thought to completely absorb fructose by relying on intracellular fructose conversion to fructose-1-phosphate by ketohexokinase (KHK, encoded by the gene Khk), thereby lowering cytosolic fructose concentration and keeping the lumen-to-cytosol downhill gradient steep. Cytosolic concentration should be high enough for GLUT2 which transports fructose to the blood. Consumption of 65% fructose pellets by young rats results in 26 mm fructose concentrations in the intestinal lumen, although luminal sugar concentrations in the gut are known to increase dramatically at night (up to an average of ∼100 mm) when rats eat (Ferraris et al. 1990; Jiang & Ferraris, 2001). Thus, intestinal luminal concentrations fluctuate around the GLUT5 Km for fructose.
Postprandial fructose concentrations in the portal vein of sucrose-fed rats, analysed by high-performance liquid chromatography (HPLC), are ∼1 mm, but decrease in peripheral circulation to ∼0.2 mm (Sugimoto et al. 2010a). Fructose concentrations in rat peripheral circulation are therefore very low but may increase to ∼1 mm during consumption of diets containing 40 to 60% fructose (Douard & Ferraris, 2008; Douard et al. 2010). When fed fructose-free diets, GLUT5−/− mice unable to absorb fructose had blood fructose concentrations that were similar to those in GLUT5+/+ mice (∼0.3 mm; Barone et al. 2009), suggesting that fructose is synthesized in GLUT5−/− mice and exported from fructose-synthesizing cells by transporters other than GLUT5. In support of this hypothesis, serum fructose concentrations were higher (∼0.5 mm) in KHK−/− mice incapable of catabolizing fructose, compared with KHK+/+ mice (∼0.25 mm) also fed fructose-free diets (Ishimoto et al. 2012). Blood fructose concentrations increased in wildtype and KHK−/−, but not GLUT5−/−, mice fed high fructose. Thus, GLUT5 but not KHK is essential for intestinal fructose absorption.
Fasting humans have 0.01–0.07 mm peripheral fructose concentrations (Prieto et al. 2004; Preston & Calle, 2010; Sugimoto et al. 2010b; Wahjudi et al. 2010). When fed fructose-containing diets, postprandial peripheral blood fructose increases by ∼5-fold but decreases to fasting levels within 2 h. Like those of healthy patients but unlike blood glucose, peripheral blood fructose levels also increase by ∼5-fold from fasted to fed levels in diabetic patients (Preston & Calle, 2010).
Gas chromatography mass spectrometry (GCMS) and HPLC methods are now recommended for more accurate analysis of blood fructose (Wahjudi et al. 2010; Sugimoto et al. 2012). Some commercial, spectrophotometric, enzyme-based kits may not be appropriate for estimating blood fructose, because the ∼6 mm glucose level in the blood may be too high a background for a subtraction-dependent assay (authors’ unpublished observations). These kits can be used in sugar-fed animal models to estimate serum fructose concentrations that are expected to be ∼0.5 mm or higher (Prieto et al. 2004; Douard et al. 2010; Sugimoto et al. 2012). The range of fructose concentrations being reported still varies by orders of magnitude, in part because of inappropriate use of enzyme-based fructose assay kits. One study that used both GCMS and spectrophotometric methods found mean serum fructose concentration in fasting healthy volunteers to be 2 mm, and to increase postprandially in 15 min to 16 mm (Hui et al. 2009). This large, millimolar level, postprandial increase is surprising because fructose, unlike glucose, undergoes rapid first-pass removal by the liver (Schaefer et al. 2009). In summary, intestinal luminal fructose concentrations are relatively high and fluctuate around the Km of GLUT5 for fructose. Blood fructose levels, however, are quite low, and it seems likely that fructose-regulated organ systems like the kidney and liver may be sensitive to small changes in blood fructose concentrations. It is not clear how GLUT5 and GLUT2 efficiently reabsorb fructose from the blood or glomerular filtrates containing very low fructose concentrations.
Metabolism
Over 50 years ago, fructose was discovered to be metabolized in the rat liver (Staub & Vestling, 1951) and small intestine (Papadopoulos & Roe, 1957) where phosphorylated intermediates rapidly accumulated while intracellular levels of ATP and Pi concentrations decreased (Karczmar et al. 1989). The main catabolic pathway involves the enzymes KHK, aldolase B (Aldob) and triokinase (ATP:d-glyceraldehyde 3-phosphotransferase), which are specific for fructose metabolism (Mayes, 1993) and are highly expressed in hepatic, renal and intestinal cells (Giroix et al. 2006) relative to other organs. At low luminal concentrations (∼1 mm), up to 60% of the fructose is converted to glucose by the small intestine, but percentage conversion to glucose decreases sharply as luminal fructose concentrations increase (Bismut et al. 1993). Thus, at higher luminal concentrations when dietary fructose is consumed, most of the fructose leaves the intestine to be metabolized by the liver. As fructose metabolism bypasses the main rate-controlling step of glycolysis and gluconeogenesis (the bifunctional enzyme phosphofructokinase and fructose 1,6 bisphosphatase), excess fructose leads to high levels of pyruvate and acetyl-CoA, which in turn leads to increased synthesis of fatty acids in the liver, processes that are prevented in Khk−/− mice, as discussed below (Ishimoto et al. 2012). Hepatic expression of KHK, aldolase B and triokinase, and levels of fructose-derived metabolites like fructose-1-phosphate, increase with fructose feeding (Mayes, 1993).
Intestinal absorptive capacitities and fructose malabsorption
Children
When consumption is normalized to body weight, young children are the highest consumers of fructose (Marriott et al. 2009) (Fig. 1). Total fructose consumption ranged from 30 g day−1 (∼3 g kg−1 day−1) in 1 year olds to 50 g day−1 (∼2 g kg−1 day−1) in 10-year-old children. This consumption rate is relatively high, and equivalent to adults consuming four or more cans of soda sweetened with high-fructose corn syrup (∼50% fructose) each day. It comes as no surprise that there is a greater incidence of positive breath hydrogen tests (a symptom of carbohydrate malabsorption), or much higher breath hydrogen peaks, in young children fed diets or juices containing high fructose levels (Cole et al. 1999; Duro et al. 2002). Incidence, severity of symptoms or peak breath hydrogen seemed to increase with decreasing age (Nobigrot et al. 1997; Tsampalieros et al. 2008) and with increasing fructose level in the diet (Gomara et al. 2008). Recently, when children were challenged with 0.5 g fructose (kg body weight)−1, a level lower than average consumption rates, in a 5 year study involving 1100 subjects, frequency of positive breath hydrogen was inversely related to age, so that ∼80% of infants <1 year old tested positive but only ∼25% of children >10 years old (Jones et al. 2011a) (Fig. 2A). It is expected that the per cent of children with symptoms of fructose malabsorption will decrease by ∼5% per year of age. Thus, in humans, fructose malabsorption is prevalent in infants, toddlers and young children compared with that in adults, suggesting a pattern inversely proportional to that of GLUT5 expression in rodent intestine (Fig. 2B). Developmental increases in GLUT2 are much more modest and not specific for fructose (Cui et al. 2003).
Figure 2. Low or modest expression of the fructose transporter GLUT5 may cause intestinal fructose malabsorption in humans.
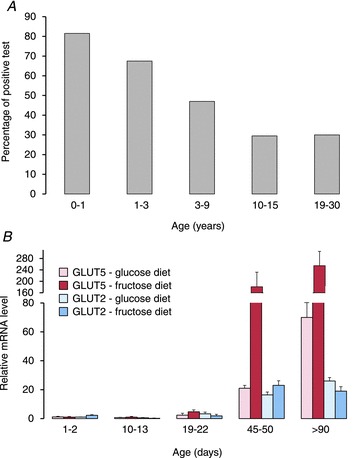
A, fructose malabsorption in humans measured by breath hydrogen (data from Jones et al. 2011a). Subjects received either 0.5 g (kg body weight)−1 of fructose (maximum of 10 g) or 2 g kg−1 of lactose (maximum of 20 g), and were tested for 2.5 h. Patient age had a remarkable effect on the proportion of subjects that tested positive, so that the odds of testing positive for fructose malabsorption in patients 15 years or younger decreased by a factor of 0.82 for each year of increasing age. B, relative GLUT5 (left red bars) and GLUT2 (right blue bars) mRNA expression in the small intestine of rats as a function of age, from suckling to adults (V. Douard and R. P. Ferraris, reanalysis of archived materials from Douard et al. 2010, 2012). Bars are means ± SEM. Weaning and adult rats were fed a high-glucose or high-fructose diet; the ‘diets’ of suckling (<14 days old) rats reflected those of their mothers. All mRNA levels were normalized to GLUT5 expression (arbitrarily set as 1.0) in rats fed high glucose. Intestines of rats 1–2 days of age represented those of humans in the last trimester of gestation, 10–13 days of neonatal humans, 19–22 days of weaning, 45–50 days of teenagers, and >90 days of adult humans. GLUT5 expression increases dramatically while that of GLUT2 increases modestly with age. GLUT5 expression is enhanced specifically by a high-fructose diet when compared with a high glucose or any fructose-free diet. GLUT2 expression increases modestly with both glucose and fructose when compared with protein diets (not shown). Since GLUT5 expression levels determine rates of rat fructose transport rates (Jiang & Ferraris, 2001), fructose malabsorption in young children may be caused by lack of GLUT5.
The mechanisms underlying fructose malabsorption in children may be due to the facts that both intestinal GLUT5 expression, and the ability to regulate GLUT5 expression, are tightly constrained by development in mammals as established in rats, mice and rabbits (Ferraris, 2001; Douard & Ferraris, 2008; Boudry et al. 2010). Unlike SGLT1 (Slc5a1, sodium-dependent glucose transporter 1) whose expression levels are relatively substantial even in the fetal intestine and increases only gradually during postnatal development, baseline intestinal expression and activity of GLUT5 are low throughout the suckling and weaning stages, but increases markedly in postweaning. However, precocious and dramatic increases in GLUT5 expression during weaning, but not during suckling, can be induced by increases in intestinal luminal fructose concentrations (Douard et al. 2008a). The effect of fructose is specific, as no other sugar leads to GLUT5 upregulation, and seems dependent on metabolism, as 3-O-methylfructose fails to induce GLUT5 (Jiang & Ferraris, 2001). In contrast, intestinal GLUT2 expression during weaning and in adults can be enhanced by either fructose or glucose in either the lumen or blood (Cui et al. 2003). Perfusion of either glucose or fructose, but not amino acids, induces GLUT2 transcription.
The ontogenetic timing mechanism of enhancing GLUT5 expression and activity is rather complex. Fructose cannot induce GLUT5 during the suckling stage, but if suckling (<14 days old) rats were injected (primed) with the corticosterone analogue dexamethasone prior to introduction of dietary fructose, intestinal GLUT5 expression can increase dramatically (Douard et al. 2008b), along with expression of other genes involved in fructose transport and metabolism (Cui et al. 2004). Coincidentally, endogenous levels of corticosterone increases markedly at ∼14 days of age, also prior to allowing GLUT5 regulation by luminal fructose during weaning (Monteiro & Ferraris, 1997). Fructose induces de novo transcription and translation of GLUT5 and involves glucocorticoid receptor translocation to the nucleus followed by fructose-induced histone H3 acetylation and RNA polymerase II binding to the GLUT5 promoter (Suzuki et al. 2011). Since even very low levels (40 ng (kg body weight)−1 or ∼10% of typical human dose) of luminal or intraperitoneal dexamethasone allows fructose to induce GLUT5 in suckling rats (E. S. David and R. P. Ferraris, unpublished), symptoms of fructose malabsorption in young infants may be relieved by low levels of glucocorticoid analogues taken orally. Endogenous thyroxine levels increase following increases in corticosterone, and thyroxine has also been shown to regulate gut development. Thyroxine may have no effect on GLUT5 regulation since the magnitude of enhancement of intestinal fructose transport by dietary fructose in hypothyroid rat pups was similar to that observed in euthyroid pups (Monteiro et al. 1999). Surprisingly, thyroxine injections increase expression of intestinal GLUT5, GLUT2 and SGLT1 during weaning by increasing transcription (Mochizuki et al. 2007), although it was not clear whether thyroxine injections also altered corticosterone levels, which could explain their findings.
Isolated fructose malabsorption, a rare pediatric disease resolved by a fructose-free diet, does not arise from expression of mutant GLUT5 (Wasserman et al. 1996), suggesting that developmental limitations of GLUT5 expression is a potential explanation. It seems that omnivorous mammals have evolved in the wild so as not synthesize GLUT5 until after weaning is completed or after foraging begins and access to fructose-bearing fruits is feasible. In prehistoric humans who selectively preferred fruits, fructose was probably made available to infants when they were weaned at 3 to 4 years of age (Clayton et al. 2006). One can speculate that the human intestine, like that of the rat, rabbit and mouse, may not be fully capable of fructose absorption until completion of weaning.
Adults
Intestinal fructose malabsorption also occurs in adult humans who, unlike infants, should have ample GLUT5 and GLUT2. Fructose malabsorption is not associated with GLUT2 or GLUT5 mutations (Wasserman et al. 1996). The essential role of GLUT2 for intestinal sugar absorption remains unclear since a GLUT2-deficient patient displayed normal breath hydrogen levels after glucose and sucrose tolerance tests (Santer et al. 2003) and GLUT2-null mice transported glucose but not the non-metabolizable 3-O-methylglucose, at rates similar to wild type (Stumpel et al. 2001). This indicates that another transepithelial, phosphorylation-dependent glucose transport system may exist. These findings can now be evaluated better with similar studies using GLUT5−/− and KHK−/− models.
Fructose malabsorption by human adults, as evaluated by breath hydrogen, increases as a function of dietary fructose concentration, so that for every 10 g increase in fructose dose, the number of positive breath hydrogen tests increases by 15% (Jones et al. 2011b). At 50 g, a dose well below the average daily fructose intake in the USA, about 60–80% of adults experience some form of malabsorption (Truswell et al. 1988; Ladas et al. 2000; Rao et al. 2007), suggesting that intestinal absorptive capacity for fructose in some people is insufficient at current rates of fructose intake. Unlike that of isolated fructose malabsorption, the mechanism underlying adult malabsorption is not clear. There is a consensus that rat or mouse intestinal absorptive capacity for glucose exceeds total intake by 20% or more (Ferraris et al. 1990; Diamond, 2002) so that glucose even from high-carbohydrate diets is completely absorbed. However, GLUT5 is facilitative and, in rats and mice, absorptive Vmax for fructose is ∼3–4 times less compared with that for glucose, a difference in activity that parallels the 8-fold differences in mRNA expression between SGLT1 and GLUT5 (Ferraris & Vinnakota, 1995; Shu et al. 1998). The total absorptive capacity of a mouse intestine for fructose is about 1.5 μmol min−1 on a low-sucrose diet, and 4.0 μmol min−1 on a high-sucrose diet (Ferraris et al. 1990). In contrast, that for glucose is about 7 and 12 μmol min−1, respectively.
Regulation by diet
In experiments utilizing surgical rat models with Thiry Vella loops, fructose intake did not induce GLUT5 upregulation in the bypassed section but only in the anastomosed (reconnected) intestine, suggesting that GLUT5 requires interaction with its substrate for upregulation (Shu et al. 1998). GLUT2 expression is upregulated by glucose and fructose from the lumen or the blood (Cui et al. 2003). In support of these findings, baseline expression and function of GLUT5 and GLUT2 do not change after complete intestinal denervation and are thus independent of intrinsic or extrinsic neural connections to the jejunoileum (Iqbal et al. 2009).
In summary, in some human adults potentially unable to sufficiently upregulate GLUT5 expression, absorptive capacity for fructose may be limited, and when dietary concentrations of fructose is well above normal and exceeds that of glucose, absorptive capacity may be exceeded, and malabsorption occurs. In infants, abnormal breath hydrogen levels caused by dietary fructose are probably due to low levels of intestinal GLUT5 expression.
Fructose-induced hypertension and renal disease
Hypertension
Although a large number of studies in humans and animal models has associated excessive fructose consumption with hypertension (see review by Madero et al. 2011), this association remains contentious. Using data from 4500 adults without a history of hypertension, a high fructose intake (∼74 g or 3.5 cans of soft drinks each day) significantly associates with hypertension (Jalal et al. 2010). A recent meta-analysis, however, of several feeding trials found that isocaloric substitution of fructose for other carbohydrates did not adversely affect blood pressure in humans (Ha et al. 2012), although this analysis excluded postprandial effects as well as subjects consuming high-fructose corn syrup (Madero et al. 2012). The role of chronic fructose intake and associated changes in GLUT5 or GLUT2 expression in inducing hypertension seems strengthened by studies linking GLUT5 to hypertension. Mate and colleagues (Mate et al. 2001, 2004) initially found renal and intestinal GLUT5 expression as well as activity decreased in spontaneously hypertensive rats compared with normotensive controls. In contrast, rat renal GLUT2 expression increased with hypertension (Schaan et al. 2005). The mechanism underlying this interesting link between GLUTs and blood pressure is not known, but these hypertensive rats were fed fructose-free diets, eliminating fructose as a direct cause of hypertension.
A different set of studies suggested that GLUT5 itself may be the key element in inducing hypertension. High-fructose diets increased, in rodents, intestinal salt absorption and expression of the chloride:anion exchanger PAT1 (Slc26a6), decreased renal salt excretion (renal PAT1 expression unknown) and resulted in hypertension (Singh et al. 2008). Fructose-induced hypertension did not develop in PAT1−/− mice, and also did not develop in wildtype PAT1+/+ mice fed chloride-free diets. A subsequent study showed that colonic expression of a different set of electrolyte transporters NHE3 (sodium–hydrogen exchanger, Slc9a3) and DRA (downregulated in adenoma also known as chloride:anion exchanger, Slc26a3) did not change in wildtype GLUT5+/+ mice, but instead increased with dietary fructose in GLUT5−/− mice (Singh et al. 2008). Blood pressure increased in GLUT5+/+ mice fed fructose for 14 weeks but not in those fed for only 5 days. Blood pressure decreased in GLUT5−/− mice fed high fructose for 5 days, suggesting that a more chronic fructose intake may not have caused hypertension (fructose cannot chronically be fed to GLUT5−/− mice long term). Unfortunately, within 7–10 days, GLUT5−/− mice fed fructose quickly retain luminal fluid, expand cecal volume and eventually die of hypovolaemic shock, confounding these interesting findings.
The second mechanism hypothesized primarily by Johnson and colleagues as underlying fructose-induced hypertension is hyperuricaemia (Nakagawa et al. 2006; Johnson et al. 2007; Madero et al. 2011), since uric acid inhibits the synthesis of a vasodilator nitric oxide. This hypothesis links two known risk factors for metabolic syndrome in humans. First, hyperuricaemia is already associated with an increased risk for hypertension (Grayson et al. 2011). Second, fructose consumption leads to increases in uric acid levels and thus is strongly associated with an increased risk of gout (Choi & Curhan, 2008). Support for this hypothesis stems from findings that fructose-induced hypertension in rats was prevented by treatment with the xanthine oxidase inhibitor allopurinol (Nakagawa et al. 2006) and that allopurinol may improve the control of blood pressure in humans (Shi et al. 2012). Hyperuricaemia is strongly associated with renal disease, and in fact a high-fructose diet is known to cause cell proliferation, hyperplasia and GLUT5, but not GLUT2, overexpression in the rat proximal tubule (Nakayama et al. 2010). A large-scale human study showed that a high fructose intake of 74 g day−1 is significantly associated with higher odds of elevated blood pressure, but was not associated with changes in uric acid levels (Jalal et al. 2010).
Low vitamin D (25[OH]D) levels are known to be associated with a higher risk of hypertension, hence a third potential mechanism is our recent finding that chronic fructose intake high enough as to increase intestinal and renal GLUT5 expression causes marked reductions in blood concentrations of 1,25-(OH)2D3, the active form of vitamin D, by inhibiting renal CYP27B1 expression (Douard et al. 2010, 2012). It is not clear whether the effect of fructose on the kidney is direct or indirect, but may involve perturbations in renal function as described below and in Fig. 3.
Figure 3. Model showing the interactive effects of chronically excessive fructose intake among multiple organ systems.
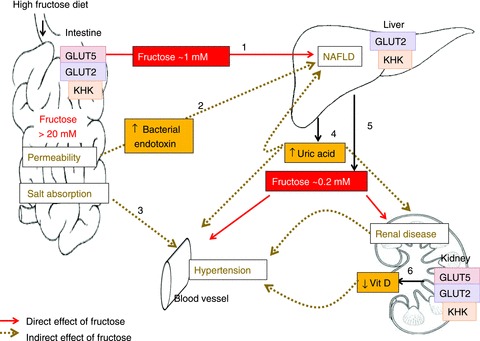
In rodent models, consumption of high-fructose diets may lead to >20 mm free fructose in the intestinal lumen and, after transport by GLUTs 5 and 2 and metabolism by KHK, yields >1 mm fructose concentration in the portal vein (step 1). The liver catabolizes most of the fructose, but under chronic conditions, may increase lipogenesis in this organ by the unregulated production of two carbon precursors, eventually leading to NAFLD. Step 2, high luminal fructose may also increase transepithelial permeability, allowing the passage of bacterial endotoxins that induce inflammatory reactions in hepatocytes, contributing to NAFLD. Step3, GLUT5 may interact with intestinal chloride transporters as to perturb electrolyte homeostasis and contribute to hypertension. Step 4, the chronic delivery of high fructose in the portal blood lowers ATP levels in hepatocytes and increases uric acid production which may contribute to the etiology not only of NAFLD but also of hypertension and renal disease. Step 5, as the liver removes most of the fructose, peripheral blood level is only ∼0.2 mm. Thus, with the exception of the liver and intestine, organ systems thought to be negatively impacted by a high fructose intake actually are bathed in modest fructose concentrations < 1 mM during postprandial periods, and < 0.2 mM between meals. Step 6: however, a chronic, ∼10-fold increase in these modest (relative to glucose) peripheral fructose concentrations seems sufficient to cause marked increases in proximal tubular cells, GLUT5 and GLUT2 expression, and renal hypertrophy, negatively impacting the synthesis of 1,25 (OH)2D3, contributing potentially to hypertension.
GLUTs 5 and 2 in renal disease
Potential detrimental effects of excessive fructose intake on the kidney may lead to outcomes other than hyperuricaemia and hypovitaminosis D, since these accelerate the progression of chronic kidney disease and exacerbate the symptoms of end-stage renal disease in rats (Gersch et al. 2007; Douard et al. 2010). Fructose may inflict damage on the kidney as shown by marked renal hypertrophy and dramatic increases in GLUT5 expression. Since renal damage seems to increase blood fructose concentrations (Douard et al. 2010), changes in renal expression of GLUT5 and GLUT2 can play an important role in fostering the negative effects of fructose. Thus, in mice receiving a 65% fructose diet for 16 weeks, renal tubulointerstitial injury on the outer cortex was associated with an increase in GLUT5 and a decrease in GLUT2 expression (Aoyama et al. 2012). Since fructose-induced changes in GLUT5 expression depend on fructose metabolism (C.R. Patel and V. Douard, unpublished data), it is interesting to note that in KHK-deficient humans and mice, a high-fructose diet is associated with hyperfructosaemia and fructosuria (Steinmann et al. 2001; Ishimoto et al. 2012) suggesting decreases in renal fructose re-absorption.
Hepatic dysregulation of GLUT2 and GLUT 5 in metabolic disorders
GLUT2 probably plays an important role in fructose-induced metabolic disorders that involve the liver and pancreas where GLUT5 is not expressed. GLUT2−/− mice displayed elevated plasma levels of glucose, glucagon and free fatty acids (Guillam et al. 1997). However, human GLUT2 deficiency is not associated with diabetes except in neonates (Sansbury et al. 2012). In humans, homozygote mutation of GLUT2 is essentially responsible for Fanconi–Bickel syndrome, a disease associated with the accumulation of glycogen in GLUT2-expressing tissues as well as with hypercholesterolaemia and hyperlipidaemia (Santer et al. 1997). This link between high cholesterol and GLUT2 is reinforced by findings associating high cholesterol serum levels with single nucleotide polymorphism of GLUT2 (Igl et al. 2010). GLUT2 expression, and thus fructose and glucose hepatic intake, increases in response to elevated circulating levels of glucose or insulin. Since non-alcoholic fatty liver disease (NAFLD) appears often as a secondary disorder of types I and II diabetes, hepatic sugar transport probably increases in association with hyperglycaemia and eventually contributes to NAFLD. Indeed, in a study evaluating NAFLD as a secondary disorder of type 1 diabetes, hepatic GLUT2 expression increases in combination with activation of several transcription factors that initiate and regulate hepatic fat synthesis (Regnell & Lernmark, 2011). It will be interesting to know if the fructose-induced increases in hepatic de novo lipogenesis followed an increase in the liver's ability to transport fructose and/or glucose, and if the effect of fat accumulation in the liver on hepatic fructose or glucose transport can occur independent of changes in blood glucose levels. Changes in plasma lipid, glucose and insulin composition in response to fructose are well documented in healthy subjects (Le et al. 2006; Chong et al. 2007; Couchepin et al. 2008) but little is known about hepatic response to fructose in subjects with NAFLD. The dyslipidaemic effect of isocaloric, isolipidic high-fructose diets relative to glucose occurred in both healthy children and those with NAFLD; however, children with NAFLD demonstrated increased sensitivity to the impact of dietary fructose (Jin et al. 2012), suggesting that a high fructose intake interacts with a pre-existing NAFLD condition to potentially accelerate dyslipidaemia.
While there are several studies implicating fructose-induced, GLUT2-associated maladaptive lipogenesis in the liver, there are recent findings implicating a more direct role of the small intestine in mediating fructose-induced NAFLD. Fructose may increase intestinal paracellular permeability leading to increases in blood levels of endotoxin that may have pro-inflammatory effects on the liver (Bergheim et al. 2008). This subsequently leads to an endotoxin-induced lipogenesis via activation of toll-like receptor (TLR)-4 in hepatic Kupffer cells (Spruss et al. 2009). It is not clear how increased fructose intake or the expected increases in GLUT5 expression alter epithelial permeability. Alternatively, uric acid (derived from fructose metabolism and fructose-induced activation of the purine-degradation pathway) has been recently demonstrated to be a potent activator of hepatic lipogenesis via the generation of mitochondrial oxidative stress (Lanaspa et al. 2012). Thus, fructose-induced NAFLD appears to be more complex than the direct hepatic metabolism of fructose to triglycerides.
Currently, we are not aware of GLUT5 mutations associated with metabolic syndrome. However, one study linked intestinal fructose absorption with NAFLD. While lean and obese children without NAFLD had increased breath hydrogen in response to an oral fructose load, obese children with NAFLD did not (Sullivan et al. 2012). This suggests that NAFLD may be associated with an increased ability of the intestine to transport fructose (hence, low breath hydrogen), implying an increase in GLUT5 expression.
In conclusion, little is known about the transport of fructose or glucose in liver, intestine or kidney in fructose-induced metabolic syndrome. It will be important to determine the role of GLUT2 or GLUT5 in the initiation or progression of these diseases.
Fructose and GLUT5 in other diseases
Fructose via GLUT5 is largely suspected of affecting cardiomyopathy, to be implicated in cancer development and to play a critical role in adipocyte differentiation.
Cardiomyopathy
A high fructose intake induces myocardial dysfunction in rodents, including increases in blood pressure and heart rates, elevated levels of cardiac angiotensin II, reactive oxygen species and lipid peroxidation as well as decreases in concentrations of cardiac antioxidants (see review by Mellor et al. 2010). Although the linkage between insulin resistance and heart failure is well established and is associated with decreases in cardiomyocytes, glucose transport rates and GLUT4 expression (Mellor et al. 2012a), the mechanisms underlying this linkage appear to be different from the ones underlying fructose-induced cardiac dysfunction (Mellor et al. 2012a) which involve perturbations in Ca2+ homeostasis as chronic consumption of a high-fructose diet profoundly alters rodent cardiomyocyte Ca2+ handling and Ca2+ responsiveness (Mellor et al. 2011, 2012b). Rat cardiomyocytes are able to transport and utilize fructose in vitro, in the absence of glucose, to support excitation–contraction coupling, known to be dependent on ATP produced by glycolysis (Mellor et al. 2011). Although GLUT5 is expressed significantly in rodent cardiomyocytes (Mellor et al. 2011), dietary fructose does not increase GLUT5 expression, so it is not clear how cardiomyocytes enhance fructose uptake in diet-induced hyperfructosaemia, and how ATP is supplied since fructose is known to decrease ATP level in hepatic and intestinal cells.
Cancer
Several epidemiological studies have highlighted a positive correlation between fructose intake and cancer (see review by Liu & Heaney, 2011), a correlation reinforced by findings indicating increased GLUT5 expression (Godoy et al. 2006) and blood fructose concentrations (Hui et al. 2009) in various types of cancers. However, previously discussed metabolic deregulations induced by dietary fructose are also strongly believed to promote the progression and/or onset of numerous cancers (Calle et al. 2003), confounding the direct link between dietary fructose and cancer development. Recent in vitro studies may have provided the evidence of a direct effect of fructose and GLUT5 on tumour growth. In breast cancer cells cultured in vitro, fructose compared to glucose altered the glycan structures in the cell surface of the tumour cells and increased their proliferative and invasive properties (Monzavi-Karbassi et al. 2010). Moreover, suppressing GLUT5 expression in breast cancer inhibited tumour cell proliferation (Chan et al. 2004). In pancreatic tumour cells, fructose was preferentially used for nucleic acid synthesis in the pentose phosphate pathway, thereby promoting proliferation (Liu et al. 2010). Thus, in GLUT5-expressing tumours, GLUT5 may play an important role and it could not only be a new drug target to inhibit proliferation of cancer cells but could also become a new biomarker for tumour detection as initially developed using positron emission tomography imaging of the GLUT5 substrate 6-[18F]fluoro-6-deoxy-d-fructose (Wuest et al. 2011).
Adipose tissue and obesity
An intake of fructose-sweetened beverages providing 25% of energy requirements for 10 weeks in overweight subjects increased de novo lipogenesis and dyslipidaemia (Stanhope et al. 2009), and reduced net fat oxidation as well as resting energy expenditure (Cox et al. 2012), thereby promoting visceral adiposity. The mechanism underlying the effect of fructose on adiposity has remained unclear for years because the main sugar transporter in mature adipocytes is GLUT4, which is known to be highly selective for glucose, not fructose. Recently, it has been shown that not only is GLUT5 expressed in the early stages of 3T3-L1 cell adipocyte differentiation but also that fructose at physiological concentrations can increase adipogenesis in 3T3-L1 cells (Du & Heaney, 2012). This GLUT5-based mechanism may also take place in vivo since GLUT5−/− mice exhibit reductions in epidydimal fat mass and impairments in adipocyte differentiation. In human adipocytes, hypoxia, which occurs frequently in fat tissue during the progression of obesity, increases GLUT5 expression (Wood et al. 2007). Since adipocyte differentiation and proliferation regulate adipocyte hyperplasia and hypertrophy that comes with the normal development of fat tissue and its abnormal expansion during obesity, GLUT5 and/or fructose may play an essential role in the ontogenetic development of adipose tissue as well as in its pathological growth – a role that needs to be evaluated. Visceral and subcutaneous fat tissues differ in their response to various hormones, nutrients or energy supply (Lee et al. 2010). Since in obese subjects, fructose increased fat depots in the visceral, but not in subcutaneous, fat tissue (Stanhope et al. 2009), it will be interesting to investigate if GLUT5 expression patterns differ between those two tissues, and whether fructose metabolites indirectly contribute to visceral fat.
Conclusion
Major gaps remain in our knowledge of the contributions of GLUT5 and GLUT2 to fructose-induced diseases, and most of these gaps will be addressed by the use of genetic mouse models with either global or organ-specific deletions of GLUT5, GLUT2 and KHK. It will be interesting to eventually find out why GLUT5 seems to play a role in certain cancers but not in others, and why fructose has such a deleterious and widespread effect on human physiology when peripheral blood fructose concentrations, for the most part, are low. The direct effect of fructose on most of the fructose-associated diseases (NAFLD, hypertension, renal diseases) remains unclear (Fig. 3). Indeed, for all these pathologies, indirect effects of fructose resulting from its metabolism by other organs are also suspected, implying a more complex organ–organ interactive contribution to the etiology of these fructose-induced diseases.
Acknowledgments
We thank the National Science Foundation for continued support over the years. Current (NSF-IOS-1121049) and recent support (NIH-DK-075617) are also acknowledged. We are grateful to Dr K. Sugimoto and Professors T. Yamanouchi and H. Inui for valuable discussion regarding fructose concentrations in the blood.
Glossary
- GCMS
gas chromatography mass spectrometry
- GLUT
glucose transporter protein
- HPLC
high-performance liquid chromatography
- KHK
ketohexokinase or fructokinase
- NAFLD
non-alcoholic fatty liver disease
- PAT1
chloride–anion exchanger
- SGLT1
sodium-dependent glucose transporter 1
- 25[OH]D3
vitamin D or calcidiol
- 1,25[OH]2D3
calcitriol
References
- Aoyama M, Isshiki K, Kume S, Chin-Kanasaki M, Araki H, Araki S, Koya D, Haneda M, Kashiwagi A, Maegawa H, Uzu T. Fructose induces tubulointerstitial injury in the kidney of mice. Biochem Biophys Res Commun. 2012;419:244–249. doi: 10.1016/j.bbrc.2012.02.001. [DOI] [PubMed] [Google Scholar]
- Au A, Gupta A, Schembri P, Cheeseman CI. Rapid insertion of GLUT2 into the rat jejunal brush-border membrane promoted by glucagon-like peptide 2. Biochem J. 2002;367:247–254. doi: 10.1042/BJ20020393. [DOI] [PMC free article] [PubMed] [Google Scholar]
- Barone S, Fussell SL, Singh AK, Lucas F, Xu J, Kim C, Wu X, Yu Y, Amlal H, Seidler U, Zuo J, Soleimani M. Slc2a5 (Glut5) is essential for the absorption of fructose in the intestine and generation of fructose-induced hypertension. J Biol Chem. 2009;284:5056–5066. doi: 10.1074/jbc.M808128200. [DOI] [PMC free article] [PubMed] [Google Scholar]
- Bergheim I, Weber S, Vos M, Kramer S, Volynets V, Kaserouni S, McClain CJ, Bischoff SC. Antibiotics protect against fructose-induced hepatic lipid accumulation in mice: role of endotoxin. J Hepatol. 2008;48:983–992. doi: 10.1016/j.jhep.2008.01.035. [DOI] [PubMed] [Google Scholar]
- Bismut H, Hers HG, Van Schaftingen E. Conversion of fructose to glucose in the rabbit small intestine. A reappraisal of the direct pathway. Eur J Biochem. 1993;213:721–726. doi: 10.1111/j.1432-1033.1993.tb17812.x. [DOI] [PubMed] [Google Scholar]
- Boudry G, David ES, Douard V, Monteiro IM, Le Huerou-Luron I, Ferraris RP. Role of intestinal transporters in neonatal nutrition: carbohydrates, proteins, lipids, minerals, and vitamins. J Pediatr Gastroenterol Nutr. 2010;51:380–401. doi: 10.1097/MPG.0b013e3181eb5ad6. [DOI] [PubMed] [Google Scholar]
- Calle EE, Rodriguez C, Walker-Thurmond K, Thun MJ. Overweight, obesity, and mortality from cancer in a prospectively studied cohort of U.S. adults. N Engl J Med. 2003;348:1625–1638. doi: 10.1056/NEJMoa021423. [DOI] [PubMed] [Google Scholar]
- Chan KK, Chan JY, Chung KK, Fung KP. Inhibition of cell proliferation in human breast tumor cells by antisense oligonucleotides against facilitative glucose transporter 5. J Cell Biochem. 2004;93:1134–1142. doi: 10.1002/jcb.20270. [DOI] [PubMed] [Google Scholar]
- Chaudhry RM, Scow JS, Madhavan S, Duenes JA, Sarr MG. Acute enterocyte adaptation to luminal glucose: a posttranslational mechanism for rapid apical recruitment of the transporter GLUT2. J Gastrointest Surg. 2012;16:312–319. doi: 10.1007/s11605-011-1752-y. discussion 319. [DOI] [PMC free article] [PubMed] [Google Scholar]
- Choi HK, Curhan G. Soft drinks, fructose consumption, and the risk of gout in men: prospective cohort study. BMJ. 2008;336:309–312. doi: 10.1136/bmj.39449.819271.BE. [DOI] [PMC free article] [PubMed] [Google Scholar]
- Chong MF, Fielding BA, Frayn KN. Mechanisms for the acute effect of fructose on postprandial lipemia. Am J Clin Nutr. 2007;85:1511–1520. doi: 10.1093/ajcn/85.6.1511. [DOI] [PubMed] [Google Scholar]
- Clayton F, Sealy J, Pfeiffer S. Weaning age among foragers at Matjes river rock shelter, South Africa, from stable nitrogen and carbon isotope analyses. Am J Phys Anthropol. 2006;129:311–317. doi: 10.1002/ajpa.20248. [DOI] [PubMed] [Google Scholar]
- Cole CR, Rising R, Lifshitz F. Consequences of incomplete carbohydrate absorption from fruit juice consumption in infants. Arch Pediatr Adolesc Med. 1999;153:1098–1102. doi: 10.1001/archpedi.153.10.1098. [DOI] [PubMed] [Google Scholar]
- Cordain L, Miller JB, Eaton SB, Mann N, Holt SH, Speth JD. Plant-animal subsistence ratios and macronutrient energy estimations in worldwide hunter-gatherer diets. Am J Clin Nutr. 2000;71:682–692. doi: 10.1093/ajcn/71.3.682. [DOI] [PubMed] [Google Scholar]
- Couchepin C, Le KA, Bortolotti M, da Encarnacao JA, Oboni JB, Tran C, Schneiter P, Tappy L. Markedly blunted metabolic effects of fructose in healthy young female subjects compared with male subjects. Diabetes Care. 2008;31:1254–1256. doi: 10.2337/dc07-2001. [DOI] [PubMed] [Google Scholar]
- Cox CL, Stanhope KL, Schwarz JM, Graham JL, Hatcher B, Griffen SC, Bremer AA, Berglund L, McGahan JP, Keim NL, Havel PJ. Circulating concentrations of monocyte chemoattractant protein-1, plasminogen activator inhibitor-1, and soluble leukocyte adhesion molecule-1 in overweight/obese men and women consuming fructose- or glucose-sweetened beverages for 10 weeks. J Clin Endocrinol Metab. 2012;96:E2034–E2038. doi: 10.1210/jc.2011-1050. [DOI] [PMC free article] [PubMed] [Google Scholar]
- Cui XL, Jiang L, Ferraris RP. Regulation of rat intestinal GLUT2 mRNA abundance by luminal and systemic factors. Biochim Biophys Acta. 2003;1612:178–185. doi: 10.1016/s0005-2736(03)00129-9. [DOI] [PubMed] [Google Scholar]
- Cui XL, Soteropoulos P, Tolias P, Ferraris RP. Fructose-responsive genes in the small intestine of neonatal rats. Physiol Genomics. 2004;18:206–217. doi: 10.1152/physiolgenomics.00056.2004. [DOI] [PubMed] [Google Scholar]
- Diamond J. Quantitative evolutionary design. J Physiol. 2002;542:337–345. doi: 10.1113/jphysiol.2002.018366. [DOI] [PMC free article] [PubMed] [Google Scholar]
- Douard V, Asgerally A, Sabbagh Y, Sugiura S, Shapses SA, Casirola D, Ferraris RP. Dietary fructose inhibits intestinal calcium absorption and induces vitamin D insufficiency in CKD. J Am Soc Nephrol. 2010;21:261–271. doi: 10.1681/ASN.2009080795. [DOI] [PMC free article] [PubMed] [Google Scholar]
- Douard V, Choi HI, Elshenawy S, Lagunoff D, Ferraris RP. Developmental reprogramming of rat GLUT5 requires glucocorticoid receptor translocation to the nucleus. J Physiol. 2008a;586:3657–3673. doi: 10.1113/jphysiol.2008.155226. [DOI] [PMC free article] [PubMed] [Google Scholar]
- Douard V, Cui XL, Soteropoulos P, Ferraris RP. Dexamethasone sensitizes the neonatal intestine to fructose induction of intestinal fructose transporter (Slc2A5) function. Endocrinology. 2008b;149:409–423. doi: 10.1210/en.2007-0906. [DOI] [PMC free article] [PubMed] [Google Scholar]
- Douard V, Ferraris RP. Regulation of the fructose transporter GLUT5 in health and disease. Am J Physiol Endocrinol Metab. 2008;295:E227–E237. doi: 10.1152/ajpendo.90245.2008. [DOI] [PMC free article] [PubMed] [Google Scholar]
- Douard V, Suzuki T, Sabbagh Y, Lee J, Shapses S, Lin S, Ferraris RP. Dietary fructose inhibits lactation-induced adaptations in rat 1,25-(OH)2D3 synthesis and calcium transport. FASEB J. 2012;26:707–721. doi: 10.1096/fj.11-190264. [DOI] [PMC free article] [PubMed] [Google Scholar]
- Du L, Heaney AP. Regulation of adipose differentiation by fructose and GluT5. Mol Endocrinol. 2012;26:1773–1782. doi: 10.1210/me.2012-1122. [DOI] [PMC free article] [PubMed] [Google Scholar]
- Duro D, Rising R, Cedillo M, Lifshitz F. Association between infantile colic and carbohydrate malabsorption from fruit juices in infancy. Pediatrics. 2002;109:797–805. doi: 10.1542/peds.109.5.797. [DOI] [PubMed] [Google Scholar]
- Ferraris RP. Dietary and developmental regulation of intestinal sugar transport. Biochem J. 2001;360:265–276. doi: 10.1042/0264-6021:3600265. [DOI] [PMC free article] [PubMed] [Google Scholar]
- Ferraris RP, Vinnakota RR. The time course of adaptation of intestinal nutrient uptake in mice is independent of age. J Nutr. 1995;125:2172–2182. doi: 10.1093/jn/125.8.2172. [DOI] [PubMed] [Google Scholar]
- Ferraris RP, Yasharpour S, Lloyd KC, Mirzayan R, Diamond JM. Luminal glucose concentrations in the gut under normal conditions. Am J Physiol Gastrointest Liver Physiol. 1990;259:G822–G837. doi: 10.1152/ajpgi.1990.259.5.G822. [DOI] [PubMed] [Google Scholar]
- Gersch MS, Mu W, Cirillo P, Reungjui S, Zhang L, Roncal C, Sautin YY, Johnson RJ, Nakagawa T. Fructose, but not dextrose, accelerates the progression of chronic kidney disease. Am J Physiol Renal Physiol. 2007;293:F1256–F1261. doi: 10.1152/ajprenal.00181.2007. [DOI] [PubMed] [Google Scholar]
- Giroix MH, Jijakli H, Courtois P, Zhang Y, Sener A, Malaisse WJ. Fructokinase activity in rat liver, ileum, parotid gland, pancreas, pancreatic islet, B and non-B islet cell homogenates. Int J Mol Med. 2006;17:517–522. [PubMed] [Google Scholar]
- Godoy A, Ulloa V, Rodriguez F, Reinicke K, Yanez AJ, Garcia Mde L, et al. Differential subcellular distribution of glucose transporters GLUT1–6 and GLUT9 in human cancer: ultrastructural localization of GLUT1 and GLUT5 in breast tumor tissues. J Cell Physiol. 2006;207:614–627. doi: 10.1002/jcp.20606. [DOI] [PubMed] [Google Scholar]
- Gomara RE, Halata MS, Newman LJ, Bostwick HE, Berezin SH, Cukaj L, See MC, Medow MS. Fructose intolerance in children presenting with abdominal pain. J Pediatr Gastroenterol Nutr. 2008;47:303–308. doi: 10.1097/MPG.0b013e318166cbe4. [DOI] [PubMed] [Google Scholar]
- Gorboulev V, Schurmann A, Vallon V, Kipp H, Jaschke A, Klessen D, et al. Na+-D-glucose cotransporter SGLT1 is pivotal for intestinal glucose absorption and glucose-dependent incretin secretion. Diabetes. 2012;61:187–196. doi: 10.2337/db11-1029. [DOI] [PMC free article] [PubMed] [Google Scholar]
- Grayson PC, Kim SY, LaValley M, Choi HK. Hyperuricemia and incident hypertension: a systematic review and meta-analysis. Arthritis Care Res (Hoboken) 2011;63:102–110. doi: 10.1002/acr.20344. [DOI] [PMC free article] [PubMed] [Google Scholar]
- Gruzdkov AA, Gromova LV, Grefner NM, Komissarchik YY. Kinetics and mechanisms of glucose absorption in the rat small intestine under physiological conditions. J Biophys Chem. 2012;3:191–200. [Google Scholar]
- Guillam MT, Hummler E, Schaerer E, Yeh JI, Birnbaum MJ, Beermann F, Schmidt A, Deriaz N, Thorens B. Early diabetes and abnormal postnatal pancreatic islet development in mice lacking Glut-2. Nat Genet. 1997;17:327–330. doi: 10.1038/ng1197-327. [DOI] [PubMed] [Google Scholar]
- Ha V, Sievenpiper JL, de Souza RJ, Chiavaroli L, Wang DD, Cozma AI, et al. Effect of fructose on blood pressure: a systematic review and meta-analysis of controlled feeding trials. Hypertension. 2012;59:787–795. doi: 10.1161/HYPERTENSIONAHA.111.182311. [DOI] [PubMed] [Google Scholar]
- Hanover LM, White JS. Manufacturing, composition, and applications of fructose. Am J Clin Nutr. 1993;58:724S–732S. doi: 10.1093/ajcn/58.5.724S. [DOI] [PubMed] [Google Scholar]
- Hosokawa M, Thorens B. Glucose release from GLUT2-null hepatocytes: characterization of a major and a minor pathway. Am J Physiol Endocrinol Metab. 2002;282:E794–E801. doi: 10.1152/ajpendo.00374.2001. [DOI] [PubMed] [Google Scholar]
- Howell CH. Flora Mirabilis: How Plants Have Shaped World Knowledge, Health, Wealth, and Beauty. Washington, DC: National Geographic; 2009. p. 256. [Google Scholar]
- Hui H, Huang D, McArthur D, Nissen N, Boros LG, Heaney AP. Direct spectrophotometric determination of serum fructose in pancreatic cancer patients. Pancreas. 2009;38:706–712. doi: 10.1097/MPA.0b013e3181a7c6e5. [DOI] [PubMed] [Google Scholar]
- Igl W, Johansson A, Wilson JF, Wild SH, Polasek O, Hayward C, et al. Modeling of environmental effects in genome-wide association studies identifies SLC2A2 and HP as novel loci influencing serum cholesterol levels. PLoS Genet. 2010;6:e1000798. doi: 10.1371/journal.pgen.1000798. [DOI] [PMC free article] [PubMed] [Google Scholar]
- Iqbal CW, Fatima J, Duenes J, Houghton SG, Kasparek MS, Sarr MG. Expression and function of intestinal hexose transporters after small intestinal denervation. Surgery. 2009;146:100–112. doi: 10.1016/j.surg.2009.02.012. [DOI] [PMC free article] [PubMed] [Google Scholar]
- Ishimoto T, Lanaspa MA, Le MT, Garcia GE, Diggle CP, Maclean PS, et al. Opposing effects of fructokinase C and A isoforms on fructose-induced metabolic syndrome in mice. Proc Natl Acad Sci U S A. 2012;109:4320–4325. doi: 10.1073/pnas.1119908109. [DOI] [PMC free article] [PubMed] [Google Scholar]
- Jalal DI, Smits G, Johnson RJ, Chonchol M. Increased fructose associates with elevated blood pressure. J Am Soc Nephrol. 2010;21:1543–1549. doi: 10.1681/ASN.2009111111. [DOI] [PMC free article] [PubMed] [Google Scholar]
- Jiang L, Ferraris RP. Developmental reprogramming of rat GLUT-5 requires de novo mRNA and protein synthesis. Am J Physiol Gastrointest Liver Physiol. 2001;280:G113–G120. doi: 10.1152/ajpgi.2001.280.1.G113. [DOI] [PubMed] [Google Scholar]
- Jin R, Le NA, Liu S, Farkas Epperson M, Ziegler TR, Welsh JA, et al. Children with NAFLD are more sensitive to the adverse metabolic effects of fructose beverages than children without NAFLD. J Clin Endocrinol Metab. 2012;97:E1088–E1098. doi: 10.1210/jc.2012-1370. [DOI] [PMC free article] [PubMed] [Google Scholar]
- Johnson RJ, Perez-Pozo SE, Sautin YY, Manitius J, Sanchez-Lozada LG, Feig DI, et al. Hypothesis: could excessive fructose intake and uric acid cause type 2 diabetes. Endocr Rev. 2009;30:96–116. doi: 10.1210/er.2008-0033. [DOI] [PMC free article] [PubMed] [Google Scholar]
- Johnson RJ, Segal MS, Sautin Y, Nakagawa T, Feig DI, Kang DH, et al. Potential role of sugar (fructose) in the epidemic of hypertension, obesity and the metabolic syndrome, diabetes, kidney disease, and cardiovascular disease. Am J Clin Nutr. 2007;86:899–906. doi: 10.1093/ajcn/86.4.899. [DOI] [PubMed] [Google Scholar]
- Jones HF, Burt E, Dowling K, Davidson G, Brooks DA, Butler RN. Effect of age on fructose malabsorption in children presenting with gastrointestinal symptoms. J Pediatr Gastroenterol Nutr. 2011a;52:581–584. doi: 10.1097/MPG.0b013e3181fd1315. [DOI] [PubMed] [Google Scholar]
- Jones HF, Butler RN, Brooks DA. Intestinal fructose transport and malabsorption in humans. Am J Physiol Gastrointest Liver Physiol. 2011b;300:G202–G206. doi: 10.1152/ajpgi.00457.2010. [DOI] [PubMed] [Google Scholar]
- Karczmar GS, Tavares NJ, Weiner MW. A 31P NMR study of the GI tract: effect of fructose loading and measurement of transverse relaxation times. Magn Reson Med. 1989;9:8–15. doi: 10.1002/mrm.1910090103. [DOI] [PubMed] [Google Scholar]
- Keembiyehetty C, Augustin R, Carayannopoulos MO, Steer S, Manolescu A, Cheeseman CI, Moley KH. Mouse glucose transporter 9 splice variants are expressed in adult liver and kidney and are up-regulated in diabetes. Mol Endocrinol. 2006;20:686–697. doi: 10.1210/me.2005-0010. [DOI] [PubMed] [Google Scholar]
- Kellett GL, Brot-Laroche E, Mace OJ, Leturque A. Sugar absorption in the intestine: the role of GLUT2. Annu Rev Nutr. 2008;28:35–54. doi: 10.1146/annurev.nutr.28.061807.155518. [DOI] [PubMed] [Google Scholar]
- Konner M, Eaton SB. Paleolithic nutrition. Nutr Clin Pract. 2010;25:594–602. doi: 10.1177/0884533610385702. [DOI] [PubMed] [Google Scholar]
- Ladas SD, Grammenos I, Tassios PS, Raptis SA. Coincidental malabsorption of lactose, fructose, and sorbitol ingested at low doses is not common in normal adults. Dig Dis Sci. 2000;45:2357–2362. doi: 10.1023/a:1005634824020. [DOI] [PubMed] [Google Scholar]
- Lanaspa MA, Sanchez-Lozada LG, Choi YJ, Cicerchi C, Kanbay M, Roncal-Jimenez CA, et al. Uric acid induces hepatic steatosis by generation of mitochondrial oxidative stress: potential role in fructose-dependent and-independent fatty liver. J Biol Chem. 2012 doi: 10.1074/jbc.M112.399899. (Epublish ahead of print) [DOI] [PMC free article] [PubMed] [Google Scholar]
- Le Gall M, Tobin V, Stolarczyk E, Dalet V, Leturque A, Brot-Laroche E. Sugar sensing by enterocytes combines polarity, membrane bound detectors and sugar metabolism. J Cell Physiol. 2007;213:834–843. doi: 10.1002/jcp.21245. [DOI] [PubMed] [Google Scholar]
- Le KA, Faeh D, Stettler R, Ith M, Kreis R, Vermathen P, et al. A 4-wk high-fructose diet alters lipid metabolism without affecting insulin sensitivity or ectopic lipids in healthy humans. Am J Clin Nutr. 2006;84:1374–1379. doi: 10.1093/ajcn/84.6.1374. [DOI] [PubMed] [Google Scholar]
- Lee MJ, Wu Y, Fried SK. Adipose tissue remodeling in pathophysiology of obesity. Curr Opin Clin Nutr Metab Care. 2010;13:371–376. doi: 10.1097/MCO.0b013e32833aabef. [DOI] [PMC free article] [PubMed] [Google Scholar]
- Liu H, Heaney AP. Refined fructose and cancer. Expert Opin Ther Targets. 2011;15:1049–1059. doi: 10.1517/14728222.2011.588208. [DOI] [PubMed] [Google Scholar]
- Liu H, Huang D, McArthur DL, Boros LG, Nissen N, Heaney AP. Fructose induces transketolase flux to promote pancreatic cancer growth. Cancer Res. 2010;70:6368–6376. doi: 10.1158/0008-5472.CAN-09-4615. [DOI] [PubMed] [Google Scholar]
- Madero M, Lozada LG, Johnson RJ. Fructose likely does have a role in hypertension. Hypertension. 2012;59:e54. doi: 10.1161/HYPERTENSIONAHA.112.194969. author reply e55–e56. [DOI] [PubMed] [Google Scholar]
- Madero M, Perez-Pozo SE, Jalal D, Johnson RJ, Sanchez-Lozada LG. Dietary fructose and hypertension. Curr Hypertens Rep. 2011;13:29–35. doi: 10.1007/s11906-010-0163-x. [DOI] [PubMed] [Google Scholar]
- Manolescu AR, Witkowska K, Kinnaird A, Cessford T, Cheeseman C. Facilitated hexose transporters: new perspectives on form and function. Physiology (Bethesda) 2007;22:234–240. doi: 10.1152/physiol.00011.2007. [DOI] [PubMed] [Google Scholar]
- Marriott BP, Cole N, Lee E. National estimates of dietary fructose intake increased from 1977 to 2004 in the United States. J Nutr. 2009;139:1228S–1235S. doi: 10.3945/jn.108.098277. [DOI] [PubMed] [Google Scholar]
- Mate A, Barfull A, Hermosa AM, Planas JM, Vazquez CM. Regulation of D-fructose transporter GLUT5 in the ileum of spontaneously hypertensive rats. J Membr Biol. 2004;199:173–179. doi: 10.1007/s00232-004-0687-6. [DOI] [PubMed] [Google Scholar]
- Mate A, de la Hermosa MA, Barfull A, Planas JM, Vazquez CM. Characterization of D-fructose transport by rat kidney brush-border membrane vesicles: changes in hypertensive rats. Cell Mol Life Sci. 2001;58:1961–1967. doi: 10.1007/PL00000830. [DOI] [PMC free article] [PubMed] [Google Scholar]
- Mayes PA. Intermediary metabolism of fructose. Am J Clin Nutr. 1993;58:754S–765S. doi: 10.1093/ajcn/58.5.754S. [DOI] [PubMed] [Google Scholar]
- Mellor KM, Bell JR, Ritchie RH, Delbridge LM. Myocardial insulin resistance, metabolic stress and autophagy in diabetes. Clin Exp Pharmacol Physiol. 2012a doi: 10.1111/j.1440-1681.2012.05738.x. (Epublished ahead of print) [DOI] [PubMed] [Google Scholar]
- Mellor KM, Bell JR, Wendt IR, Davidoff AJ, Ritchie RH, Delbridge LM. Fructose modulates cardiomyocyte excitation-contraction coupling and Ca2+ handling in vitro. PLoS One. 2011;6:e25204. doi: 10.1371/journal.pone.0025204. [DOI] [PMC free article] [PubMed] [Google Scholar]
- Mellor KM, Ritchie RH, Davidoff AJ, Delbridge LM. Elevated dietary sugar and the heart: experimental models and myocardial remodeling. Can J Physiol Pharmacol. 2010;88:525–540. doi: 10.1139/y10-005. [DOI] [PubMed] [Google Scholar]
- Mellor KM, Wendt IR, Ritchie RH, Delbridge LM. Fructose diet treatment in mice induces fundamental disturbance of cardiomyocyte Ca2+ handling and myofilament responsiveness. Am J Physiol Heart Circ Physiol. 2012b;302:H964–H972. doi: 10.1152/ajpheart.00797.2011. [DOI] [PubMed] [Google Scholar]
- Mochizuki K, Yagi E, Sakaguchi N, Mochizuki H, Takabe S, Kuranuki S, et al. The critical period for thyroid hormone responsiveness through thyroid hormone receptor isoform alpha in the postnatal small intestine. Biochim Biophys Acta. 2007;1770:609–616. doi: 10.1016/j.bbagen.2006.12.011. [DOI] [PubMed] [Google Scholar]
- Monteiro IM, Ferraris RP. Precocious enhancement of intestinal fructose uptake by diet in adrenalectomized rat pups. Pediatr Res. 1997;41:353–358. doi: 10.1203/00006450-199703000-00008. [DOI] [PubMed] [Google Scholar]
- Monteiro IM, Jiang L, Ferraris RP. Dietary modulation of intestinal fructose transport and GLUT5 mRNA expression in hypothyroid rat pups. J Pediatr Gastroenterol Nutr. 1999;29:563–570. doi: 10.1097/00005176-199911000-00017. [DOI] [PubMed] [Google Scholar]
- Monzavi-Karbassi B, Hine RJ, Stanley JS, Ramani VP, Carcel-Trullols J, Whitehead TL, et al. Fructose as a carbon source induces an aggressive phenotype in MDA-MB-468 breast tumor cells. Int J Oncol. 2010;37:615–622. doi: 10.3892/ijo_00000710. [DOI] [PMC free article] [PubMed] [Google Scholar]
- Moran AW, Al-Rammahi MA, Arora DK, Batchelor DJ, Coulter EA, Ionescu C, Bravo D, Shirazi-Beechey SP. Expression of Na+/glucose co-transporter 1 (SGLT1) in the intestine of piglets weaned to different concentrations of dietary carbohydrate. Br J Nutr. 2010;104:647–655. doi: 10.1017/S0007114510000954. [DOI] [PubMed] [Google Scholar]
- Nakagawa T, Hu H, Zharikov S, Tuttle KR, Short RA, Glushakova O, et al. A causal role for uric acid in fructose-induced metabolic syndrome. Am J Physiol Renal Physiol. 2006;290:F625–F631. doi: 10.1152/ajprenal.00140.2005. [DOI] [PubMed] [Google Scholar]
- Nakayama T, Kosugi T, Gersch M, Connor T, Sanchez-Lozada LG, Lanaspa MA, et al. Dietary fructose causes tubulointerstitial injury in the normal rat kidney. Am J Physiol Renal Physiol. 2010;298:F712–F720. doi: 10.1152/ajprenal.00433.2009. [DOI] [PMC free article] [PubMed] [Google Scholar]
- Nobigrot T, Chasalow FI, Lifshitz F. Carbohydrate absorption from one serving of fruit juice in young children: age and carbohydrate composition effects. J Am Coll Nutr. 1997;16:152–158. doi: 10.1080/07315724.1997.10718666. [DOI] [PubMed] [Google Scholar]
- Papadopoulos NM, Roe JH. Fructose phosphorylation and dephosphorylation by the intestinal mucosa of the rat during fructose absorption. Am J Physiol. 1957;189:301–306. doi: 10.1152/ajplegacy.1957.189.2.301. [DOI] [PubMed] [Google Scholar]
- Park YK, Yetley EA. Intakes and food sources of fructose in the United States. Am J Clin Nutr. 1993;58:737S–747S. doi: 10.1093/ajcn/58.5.737S. [DOI] [PubMed] [Google Scholar]
- Preston GM, Calle RA. Elevated serum sorbitol and not fructose in type 2 diabetic patients. Biomark Insights. 2010;5:33–38. doi: 10.4137/bmi.s4530. [DOI] [PMC free article] [PubMed] [Google Scholar]
- Prieto PG, Cancelas J, Villanueva-Penacarrillo ML, Valverde I, Malaisse WJ. Plasma D-glucose, D-fructose and insulin responses after oral administration of D-glucose, D-fructose and sucrose to normal rats. J Am Coll Nutr. 2004;23:414–419. doi: 10.1080/07315724.2004.10719386. [DOI] [PubMed] [Google Scholar]
- Rao SS, Attaluri A, Anderson L, Stumbo P. Ability of the normal human small intestine to absorb fructose: evaluation by breath testing. Clin Gastroenterol Hepatol. 2007;5:959–963. doi: 10.1016/j.cgh.2007.04.008. [DOI] [PMC free article] [PubMed] [Google Scholar]
- Regnell SE, Lernmark A. Hepatic steatosis in type 1 diabetes. Rev Diabet Stud. 2011;8:454–467. doi: 10.1900/RDS.2011.8.454. [DOI] [PMC free article] [PubMed] [Google Scholar]
- Sansbury FH, Flanagan SE, Houghton JA, Shuixian Shen FL, Al-Senani AM, Habeb AM, et al. SLC2A2 mutations can cause neonatal diabetes, suggesting GLUT2 may have a role in human insulin secretion. Diabetologia. 2012;55:2381–2385. doi: 10.1007/s00125-012-2595-0. [DOI] [PubMed] [Google Scholar]
- Santer R, Hillebrand G, Steinmann B, Schaub J. Intestinal glucose transport: evidence for a membrane traffic-based pathway in humans. Gastroenterology. 2003;124:34–39. doi: 10.1053/gast.2003.50009. [DOI] [PubMed] [Google Scholar]
- Santer R, Schneppenheim R, Dombrowski A, Gotze H, Steinmann B, Schaub J. Mutations in GLUT2, the gene for the liver-type glucose transporter, in patients with Fanconi-Bickel syndrome. Nat Genet. 1997;17:324–326. doi: 10.1038/ng1197-324. [DOI] [PubMed] [Google Scholar]
- Schaan BD, Irigoyen MC, Bertoluci MC, Lima NG, Passaglia J, Hermes E, et al. Increased urinary TGF-β1 and cortical renal GLUT1 and GLUT2 levels: additive effects of hypertension and diabetes. Nephron Physiol. 2005;100:p43–p50. doi: 10.1159/000085413. [DOI] [PubMed] [Google Scholar]
- Schaefer EJ, Gleason JA, Dansinger ML. Dietary fructose and glucose differentially affect lipid and glucose homeostasis. J Nutr. 2009;139:1257S–1262S. doi: 10.3945/jn.108.098186. [DOI] [PMC free article] [PubMed] [Google Scholar]
- Scow JS, Iqbal CW, Jones TW, 3rd, Qandeel HG, Zheng Y, Duenes JA, et al. Absence of evidence of translocation of GLUT2 to the apical membrane of enterocytes in everted intestinal sleeves. J Surg Res. 2011;167:56–61. doi: 10.1016/j.jss.2010.04.026. [DOI] [PMC free article] [PubMed] [Google Scholar]
- Shi Y, Chen W, Jalal D, Li Z, Mao H, Yang Q, Johnson RJ, Yu X. Clinical outcome of hyperuricemia in IgA nephropathy: a retrospective cohort study and randomized controlled trial. Kidney Blood Press Res. 2012;35:153–160. doi: 10.1159/000331453. [DOI] [PMC free article] [PubMed] [Google Scholar]
- Shu R, David ES, Ferraris RP. Luminal fructose modulates fructose transport and GLUT-5 expression in small intestine of weaning rats. Am J Physiol Gastrointest Liver Physiol. 1998;274:G232–G239. doi: 10.1152/ajpgi.1998.274.2.G232. [DOI] [PubMed] [Google Scholar]
- Singh AK, Amlal H, Haas PJ, Dringenberg U, Fussell S, Barone SL, et al. Fructose-induced hypertension: essential role of chloride and fructose absorbing transporters PAT1 and Glut5. Kidney Int. 2008;74:438–447. doi: 10.1038/ki.2008.184. [DOI] [PMC free article] [PubMed] [Google Scholar]
- Spruss A, Kanuri G, Wagnerberger S, Haub S, Bischoff SC, Bergheim I. Toll-like receptor 4 is involved in the development of fructose-induced hepatic steatosis in mice. Hepatology. 2009;50:1094–1104. doi: 10.1002/hep.23122. [DOI] [PubMed] [Google Scholar]
- Stanhope KL, Schwarz JM, Keim NL, Griffen SC, Bremer AA, Graham JL, et al. Consuming fructose-sweetened, not glucose-sweetened, beverages increases visceral adiposity and lipids and decreases insulin sensitivity in overweight/obese humans. J Clin Invest. 2009;119:1322–1334. doi: 10.1172/JCI37385. [DOI] [PMC free article] [PubMed] [Google Scholar]
- Staub A, Vestling CS. Studies on fructose-1-phosphate with rat liver fructokinase. J Biol Chem. 1951;191:395–399. [PubMed] [Google Scholar]
- Steinmann B, Gitzelman R, Van den Berghe G. Disorders of fructose metabolism. In: Scriver CR, Sly WS, Childs B, Beaudet AL, Valle D, Kinzler KW, Vogelstein B, editors. The Metabolic and Molecular Bases of Inherited Disease. New York: McGraw Hill; 2001. pp. 1489–1520. [Google Scholar]
- Ströhle A, Hahn A. Diets of modern hunter-gatherers vary substantially in their carbohydrate content depending on ecoenvironments: results from an ethnographic analysis. Nutr Res. 2011;31:429–435. doi: 10.1016/j.nutres.2011.05.003. [DOI] [PubMed] [Google Scholar]
- Stumpel F, Burcelin R, Jungermann K, Thorens B. Normal kinetics of intestinal glucose absorption in the absence of GLUT2: evidence for a transport pathway requiring glucose phosphorylation and transfer into the endoplasmic reticulum. Proc Natl Acad Sci U S A. 2001;98:11330–11335. doi: 10.1073/pnas.211357698. [DOI] [PMC free article] [PubMed] [Google Scholar]
- Sugimoto K, Hosotani T, Kawasaki T, Nakagawa K, Hayashi S, Nakano Y, Inui H, Yamanouchi T. Eucalyptus leaf extract suppresses the postprandial elevation of portal, cardiac and peripheral fructose concentrations after sucrose ingestion in rats. J Clin Biochem Nutr. 2010a;46:205–211. doi: 10.3164/jcbn.09-93. [DOI] [PMC free article] [PubMed] [Google Scholar]
- Sugimoto K, Inui H, Yamanouchi T. Assays of fructose in experimental nutrition. In: Preedy VR, editor. Dietary Sugars: Chemistry, Analysis, Function and Effects. London: Royal Society of Chemistry; 2012. pp. 466–485. [Google Scholar]
- Sugimoto K, Kawasaki T, Tomoda M, Nakagawa K, Hayashi S, Inui H, Kajimoto Y, Yamanouchi T. Lowering of postprandial hyperfructosemia in humans by eucalyptus leaf extract: a randomized, double-blind, placebo-controlled crossover study. Food Sci Technolol Res. 2010b;16:509–512. [Google Scholar]
- Sullivan J, Le M, Pan Z, Johnson R, Sokol R, Robbins K, Sundaram S. Oral fructose absorption in children with non-alcoholic fatty liver disease. Gastroenterology. 2012;142((5)) doi: 10.1111/ijpo.238. S-79. [DOI] [PMC free article] [PubMed] [Google Scholar]
- Suzuki T, Douard V, Mochizuki K, Goda T, Ferraris RP. Diet-induced epigenetic regulation in vivo of the intestinal fructose transporter Glut5 during development of rat small intestine. Biochem J. 2011;435:43–53. doi: 10.1042/BJ20101987. [DOI] [PubMed] [Google Scholar]
- Thorens B, Mueckler M. Glucose transporters in the 21st Century. Am J Physiol Endocrinol Metab. 2010;298:E141–E145. doi: 10.1152/ajpendo.00712.2009. [DOI] [PMC free article] [PubMed] [Google Scholar]
- Truswell AS, Seach JM, Thorburn AW. Incomplete absorption of pure fructose in healthy subjects and the facilitating effect of glucose. Am J Clin Nutr. 1988;48:1424–1430. doi: 10.1093/ajcn/48.6.1424. [DOI] [PubMed] [Google Scholar]
- Tsampalieros A, Beauchamp J, Boland M, Mack DR. Dietary fructose intolerance in children and adolescents. Arch Dis Child. 2008;93:1078. doi: 10.1136/adc.2008.137521. [DOI] [PubMed] [Google Scholar]
- Wahjudi PN, Patterson ME, Lim S, Yee JK, Mao CS, Lee WN. Measurement of glucose and fructose in clinical samples using gas chromatography/mass spectrometry. Clin Biochem. 2010;43:198–207. doi: 10.1016/j.clinbiochem.2009.08.028. [DOI] [PMC free article] [PubMed] [Google Scholar]
- Wasserman D, Hoekstra JH, Tolia V, Taylor CJ, Kirschner BS, Takeda J, et al. Molecular analysis of the fructose transporter gene (GLUT5) in isolated fructose malabsorption. J Clin Inves. 1996;98:2398–2402. doi: 10.1172/JCI119053. [DOI] [PMC free article] [PubMed] [Google Scholar]
- Welsh JA, Sharma AJ, Grellinger L, Vos MB. Consumption of added sugars is decreasing in the United States. Am J Clin Nutr. 2011;94:726–734. doi: 10.3945/ajcn.111.018366. [DOI] [PMC free article] [PubMed] [Google Scholar]
- Wood IS, Wang B, Lorente-Cebrian S, Trayhurn P. Hypoxia increases expression of selective facilitative glucose transporters (GLUT) and 2-deoxy-D-glucose uptake in human adipocytes. Biochem Biophys Res Commun. 2007;361:468–473. doi: 10.1016/j.bbrc.2007.07.032. [DOI] [PMC free article] [PubMed] [Google Scholar]
- Wright EM, Loo DD, Hirayama BA. Biology of human sodium glucose transporters. Physiol Rev. 2011;91:733–794. doi: 10.1152/physrev.00055.2009. [DOI] [PubMed] [Google Scholar]
- Wuest M, Trayner BJ, Grant TN, Jans HS, Mercer JR, Murray D, et al. Radiopharmacological evaluation of 6-deoxy-6-[18F]fluoro-D-fructose as a radiotracer for PET imaging of GLUT5 in breast cancer. Nucl Med Biol. 2011;38:461–475. doi: 10.1016/j.nucmedbio.2010.11.004. [DOI] [PubMed] [Google Scholar]