

Abstract
Sprint interval training (SIT) has been proposed as a time efficient alternative to endurance training (ET) for increasing skeletal muscle oxidative capacity and improving certain cardiovascular functions. In this study we sought to make the first comparisons of the structural and endothelial enzymatic changes in skeletal muscle microvessels in response to ET and SIT. Sixteen young sedentary males (age 21 ± SEM 0.7 years, BMI 23.8 ± SEM 0.7 kg m−2) were randomly assigned to 6 weeks of ET (40–60 min cycling at ∼65% , 5 times per week) or SIT (4–6 Wingate tests, 3 times per week). Muscle biopsies were taken from the m. vastus lateralis before and following 60 min cycling at 65%
 to measure muscle microvascular endothelial eNOS content, eNOS serine1177 phosphorylation, NOX2 content and capillarisation using quantitative immunofluorescence microscopy. Whole body insulin sensitivity, arterial stiffness and blood pressure were also assessed. ET and SIT increased skeletal muscle microvascular eNOS content (ET 14%; P < 0.05, SIT 36%; P < 0.05), with a significantly greater increase observed following SIT (P < 0.05). Sixty minutes of moderate intensity exercise increased eNOS ser1177 phosphorylation in all instances (P < 0.05), but basal and post-exercise eNOS ser1177 phosphorylation was lower following both training modes. All microscopy measures of skeletal muscle capillarisation (P < 0.05) were increased with SIT or ET, while neither endothelial nor sarcolemmal NOX2 was changed. Both training modes reduced aortic stiffness and increased whole body insulin sensitivity (P < 0.05). In conclusion, in sedentary males SIT and ET are effective in improving muscle microvascular density and eNOS protein content.
Key point
Optimal vascular function is critical for health, and endurance training (ET) has previously been shown to be an effective method of improving this.
Sprint interval training (SIT) has been proposed as a time efficient alternative to ET but its effect on skeletal muscle microvasculature has not been studied and no direct comparison with ET has been made.
ET and SIT in this study were equally effective at decreasing arterial stiffness and increasing skeletal muscle capillarisation and eNOS content.
The main results suggest that both training modes improve skeletal muscle microvascular and macrovascular function, with SIT being a time efficient alternative.
Introduction
It is well established that endothelial function is dependent on nitric oxide (NO) bioavailability (McAllister & Laughlin, 2006), which in turn is determined by the balance between NO synthesis and scavenging by superoxide anions and related reactive oxygen species. As endothelial function plays a role in insulin sensitivity, blood pressure regulation and the molecular mechanisms leading to atherosclerosis (McAllister & Laughlin, 2006; Wagenmakers et al. 2006; Barrett et al. 2009; Barrett et al. 2011) an optimal balance between NO production and scavenging is important in the maintenance of a healthy phenotype. Experiments with isolated arteries and cultured endothelial cells have shown that endothelial nitric oxide synthase (eNOS) is the rate limiting enzyme for endothelial NO synthesis. The eNOS protein content and serine1177 (ser1177) phosphorylation state together determine eNOS activity and NO production. A major source of superoxide production and NO scavenging in the vascular wall is NAD(P)Hoxidase (NAD(P)Hox) (Brandes & Kreuzer, 2005; Silver et al. 2007), but substantial expression of this enzyme is assumed to only occur in obesity, cardiovascular pathology and ageing (Brandes & Kreuzer, 2005; Silver et al. 2007). However, the lack of a validated method means that currently there is little information on the protein content of these enzymes in the endothelial layer of the microvasculature of human skeletal muscle.
There is substantial evidence in the literature that the adoption of a sedentary lifestyle, obesity, ageing and chronic diseases lead to an attenuation of endothelial NO production by reductions in eNOS expression and protein content (McAllister & Laughlin, 2006) and increases in NAD(P)Hox expression and protein content (Brandes & Kreuzer 2005, Silver et al. 2007) in the macrovasculature. Whether these adaptations also occur in the muscle microvasculature is currently unknown. In obese and elderly individuals and patients with type 2 diabetes and cardiovascular disease, an attenuated NO production in the muscle microvasculature has been implicated in the development of skeletal muscle insulin resistance (Barrett et al. 2009; Barrett et al. 2011), and anabolic resistance to insulin and amino acids leading to sarcopaenia and reductions in muscle capillary density (Wagenmakers et al. 2006). An attenuated endothelial NO production has also been implicated in the reduction in exercise hyperaemia that is known to occur in elderly humans (Schrage et al. 2007; Crecelius et al. 2010) with Spier et al. (2007) providing evidence that this impairment indeed occurs in isolated muscle arterioles of old rats and can be restored by exercise training. Krentz et al. (2009) have also made the observation that functional impairments in NO-dependent muscle microvascular function precede macrovascular impairments in humans and, therefore, suggested that the muscle microvasculature should be regarded as a primary target for therapeutic interventions.
Endurance training (ET) is recognised as an efficient means to increase eNOS gene expression, protein content and NO production in feeding and resistance arteries (McAllister & Laughlin 2006), thereby increasing the vasodilatory response to insulin (Rattigan et al. 2001; Barrett et al. 2009) and flow mediated dilatation, and reducing the risk for the development of hypertension and atherosclerosis (McAllister & Laughlin, 2006; Thijssen et al. 2010). ET is also the traditional means to increase the production in skeletal muscle of vascular endothelial growth factor (VEGF), which generates an NO-dependent signal stimulating angiogenesis (Andersen & Henriksson, 1977; Hood et al. 1998; Milkiewicz et al. 2005; Egginton, 2009; Wagner, 2011). However, it is not known whether ET increases eNOS content in the endothelial layer of the muscle microvasculature or its phosphorylation at ser1177 in the basal state or in response to moderate intensity cycling exercise in man. In addition the effect of ET on muscle microvascular NAD(P)Hox content has not been investigated.
Recently sprint interval training (SIT) has received much attention as it elicits similar muscle metabolic (increases in activity of mitochondrial enzymes, aerobic capacity and insulin sensitivity) and macrovascular adaptations (reduced arterial stiffness and blood pressure) as ET, despite a marked reduction in time commitment (Burgomaster et al. 2008; Rakobowchuk et al. 2008; Babraj et al. 2009; Gibala et al. 2012; Shepherd et al. 2013). In rodent models, High intensity interval training has also been shown to increase aortic eNOS content (Haram et al. 2009). However, to date no studies have made comparisons between the effects of SIT and ET on the microvascular enzymes controlling NO production and skeletal muscle microvascular density in man.
The main aims of the present study were twofold. First, we sought to determine the effects of 6 weeks of traditional ET and SIT on skeletal muscle microvascular density and microvascular enzyme content (eNOS and NOX2) in previously sedentary men. We employed a novel method recently developed in our laboratory (Cocks et al. 2012) to measure the protein content of these enzymes in the endothelial layer of the muscle microvasculature using quantitative immunofluorescence microscopy. Secondly, we aimed to investigate the effect of 1 h of continuous cycling exercise at 65% on eNOS ser1177 phosphorylation both in the untrained state and after the two training interventions. eNOS ser1177 is the main activation site previously shown to be phosphorylated by endurance exercise in mouse arteries (Zhang et al. 2009). Finally, the effects of SIT and ET on arterial stiffness and blood pressure were considered to investigate earlier claims that SIT is an effective means to improve macrovascular functions (Rakobowchuk et al. 2008; Kessler et al. 2012). We hypothesised that microvascular density and eNOS content would increase in response to both modes of training, that eNOS ser1177 phosphorylation would be lower after training as the increase in microvascular density and metabolic training adaptations will reduce shear stress per microvessel, and that NOX2 content would be unaltered due to the healthy nature of the participants.
Methods
The percutaneous muscle biopsies taken in this study before and after both training modes and under basal conditions and after 1 h of endurance exercise have been used both for the measurements described in this manuscript and for measurements of the content of intramuscular triglycerides (IMTGs), perilipin-2 and perilipin-5 and usage of total IMTGs and IMTGs associated with perilipin-2 and perilipin-5 during endurance exercise. The latter are reported in a parallel manuscript (Shepherd et al. 2013). Measures such as insulin sensitivity and  also made in the indicated human volunteers are relevant for the interpretation of both studies and are presented in both manuscripts.
Participants
Sixteen young sedentary males (defined as performing less than 1 h of organised exercise per week; in sports clubs, university or commercial gyms or sports classes) participated in the study (Table 1). Participants were randomly assigned to either ET or SIT groups, in a matched fashion based on age and  (n= 8). The participants gave written informed consent to a protocol adhering to the Declaration of Helsinki and approved by the Black Country NHS Research Ethics Committee.
Table 1.
Subject characteristics, insulin sensitivity, haemodynamic and peak oxygen uptake pre- and post-6 weeks of training
| Endurance | Sprint interval | |||
|---|---|---|---|---|
| Variable | Pre-training | Post-training | Pre-training | Post-training |
| Age (year) | 21 ± 1 | – | 22 ± 1 | – |
| Height (cm) | 177 ± 3 | – | 174 ± 2 | – |
| Weight (kg) | 71 ± 4 | 71 ± 5 | 75 ± 3 | 75 ± 3 |
| BMI (kg m−2) | 22.6 ± 1.6 | 22.6 ± 1.2 | 24.8 ± 0.8 | 24.8 ± 0.9 |
 (ml kg−1 min−1) (ml kg−1 min−1) |
41.7 ± 4.1 | 48.2 ± 5.0* | 41.9 ± 1.8 | 45.1 ± 2.3* |
| Wmax (W) | 218 ± 11 | 253 ± 16* | 221 ± 11 | 241 ± 14* |
| ISI Matsuda | 3.7 ± 0.5 | 4.7 ± 0.7* | 3.9 ± 0.3 | 5.8 ± 0.4* |
| Glucose AUC (mmol l−1 (120 min)−1) | 16835 ± 992 | 14783 ± 950* | 17634 ± 710 | 14551 ± 398* |
| Insulin AUC (mmol l−1 (120 min)−1) | 8434 ± 880 | 6813 ± 711* | 8847 ± 1140 | 5792 ± 688* |
| Resting heart rate (bpm) | 60 ± 2 | 57 ± 2* | 65 ± 2 | 61 ± 3* |
| Mean arterial pressure (mmHg) | 78 ± 2 | 76 ± 3* | 81 ± 3 | 77 ± 3* |
| Systolic blood pressure (mmHg) | 114 ± 4 | 113 ± 5 | 117 ± 3 | 115 ± 3 |
| Diastolic blood pressure (mmHg) | 61 ± 3 | 57 ± 3* | 62 ± 3 | 59 ± 3* |
Values are means ± SEM, n= 8 per group.
P < 0.05, main effect of training.
Pre-training testing protocol
Participants first completed an incremental exercise test to exhaustion on an electromagnetically braked cycle ergometer to determine maximal aerobic power output (Wmax) and  using an online gas collection system (Oxycon Pro, Viasys, Würzberg, Germany). Briefly, participants started cycling at 95 W for 3 min; following this the workload was increased by 35 W every 3 min until volitional fatigue.
  corresponds to the highest value achieved over a 15 s recording period. After sufficient rest, participants in the SIT group performed a Wingate test (30 s ‘all out’ effort against a resistance equivalent to 0.075 kg body mass) to familiarise themselves with the SIT training protocol.
Three to seven days after the incremental exercise test and following an overnight fast, macrovascular function was assessed (blood pressure and arterial stiffness). Following this a 2 h oral glucose tolerance test was completed. The next day, again following an overnight fast, a muscle biopsy was taken at rest from the m. vastus lateralis. Participants then performed 60 min of cycling on an electromagnetically braked cycle ergometer at 65% of pre-training  . A second biopsy was taken immediately after exercise from the same leg as the pre-exercise biopsy.
Post-training testing protocol
Post-training  testing was performed the day before the final training session. Approximately 48 h after the final training session the post-training testing protocol was conducted with procedures, methods and timings identical in all respects to the pre-training testing protocol. Power output of the 60 min steady state cycling exercise bout was set at the same absolute intensity as during the pre-training exercise bout.
Arterial stiffness
Supine brachial artery blood pressure measurements were made in triplicate using an automated sphygmomanometer (Omron 7051T, Omron Corp., Kyoto, Japan) following 15 min of supine rest. Central (carotid-femoral, cPWV) and peripheral (carotid-radial, pPWV) pulse wave velocity (PWV) were assessed using a semi-automated device and software (SphygmoCor, AtCor Medical, Sydney, Australia). PWV is defined as the speed of travel of a pulse between two sites along the arterial branch (O’Rourke et al. 2002) and is a measure of artery stiffness. A single high fidelity applanation tonometer was used to obtain a proximal (carotid artery) and distal (radial or femoral artery) pulse, recorded sequentially over 10 waveforms. Simultaneously the QRS complex was measured using electrocardiography (ECG). The time between the R wave of the ECG and the foot of the proximal waveform is subtracted from the time between the R wave and the foot of the distal waveform to obtain the pulse transit time. To determine the distance used for PWV, the distance from the proximal measurement site (carotid artery) to the suprasternal notch was subtracted from the distance between the distal (radial/femoral artery) measurement site and the suprasternal notch using an anthropometric measuring tape. PWV measurements were made in triplicate. The day to day variability measured as coefficient of variation for cPWV and pPWV in our laboratory was 4% and 4%, respectively. Radial artery pressure waveforms were acquired (SphygmoCor, AtCor Medical, Sydney, Australia) and the aortic waveform reconstructed using a validated transfer function (O’Rourke et al. 2002). The augmentation index (AIx), an assessment of systemic wave reflection and thus arterial stiffness (Laurent et al. 2006), was then determined using pulse wave analysis (PWA). To control for the potentially confounding influence of heart rate (Wilkinson et al. 2000), the AIx was normalised to a heart rate of 75 bpm (AIx@75bpm). Resting heart rate was obtained during PWA using the SphygmoCor software. PWA measurements were made in triplicate. The day to day variability measured as coefficient of variation in our laboratory was 8% for AIx@75bpm.
Oral glucose tolerance test and Matsuda insulin sensitivity index
Following the insertion of a cannula into an antecubital vein, a baseline 25 ml blood sample was taken. Participants then ingested a 25% glucose beverage containing 75 g glucose made up in 300 ml of water. Further blood samples (10 ml) were collected at 30, 60, 90 and 120 min while participants rested, following the procedure originally proposed by Matsuda & DeFronzo (1999) for the assessment of whole body insulin sensitivity. Plasma was separated by centrifugation (10 min at 1800 g) and stored at −80°C until analysis. Plasma insulin concentrations were determined by enzyme linked immuno-sorbent assay (ELISA) using a commercially available kit (Invitrogen, UK). Plasma glucose concentrations were analysed using an automated analyser (IL ILab 650 Chemistry Analyzer, Diamond Diagnostics, Holliston, MA, USA).
Area under the curve (AUC) for insulin and glucose during the oral glucose tolerance test was calculated using the conventional trapezoid rule. The Matsuda index, a variable which is generally accepted and widely used as a non-invasive alternative to measure whole body insulin sensitivity has been shown to have a high correlation with insulin sensitivity measured with the hyperglycaemic euglycaemic clamp (Matsuda & DeFronzo, 1999), which is the gold standard method. The Matsuda index was calculated using the formula:
 |
Where FPG is fasting plasma glucose concentration (mg dl−1), FPI is fasting plasma insulin concentration (μU ml−1), and mean OGTT glucose and insulin is the mean plasma glucose (mg dl−1) and insulin (μU ml−1) concentration of all samples taken during the oral glucose tolerance test (0, 30, 60, 90 and 120 min).
Muscle biopsy
While participants rested a muscle biopsy was taken from the lateral portion of the m. vastus lateralis, approximately 25–50% of the distance from the lateral joint line and the greater trochanter under local anaesthesia (1% lidocaine) using the percutaneous needle biopsy technique (Bergstrom, 1975) as recently described (Tarnopolsky et al. 2011). Post exercise biopsies where taken from an incision ∼2 cm proximal to the first incision. Excess blood and visible collagen or fat were removed before samples were embedded in Tissue-Tek OCT Compound (Sakura Finetek Europe, Zoeterwoude, Netherlands) and immediately frozen in liquid nitrogen cooled isopentane (Sigma-Aldrich, Poole, UK). Samples were then stored at −80°C until analysis was performed.
Dietary controls
Twenty-four hours prior to and throughout the 2 days of the pre- and post-training testing protocol participant's diets were standardised. Using commercially available diet analysis software (WISP), 3 day diet diaries were logged and average daily energy intake was calculated. The standard diet was matched to the participant's habitual energy intake and was composed of 50% carbohydrate, 35% fat and 15% protein.
Training
Training programmes were initiated ∼48 h after completion of the pre-training testing protocol. Training for the ET group consisted of 40–60 min continuous cycling on an electromagnetically braked cycle ergometer at an intensity eliciting ∼65% . Participants trained 5 times a week. Following 3 weeks of training a second incremental exercise test was conducted and workload was changed accordingly. The duration of the sessions was increased from 40 min during the first 10 sessions, to 50 min for sessions 11–20 and 60 min for sessions 21–30. The SIT group performed repeated Wingate tests (Burgomaster et al. 2008), interspersed with 4.5 min recovery (cycling at 30 W). The number of Wingate tests performed each session was increased from four for the first six sessions to five during sessions 7–12 and six during session 13–18. All training sessions were supervised by members of the research team and significant encouragement was provided during the Wingate tests.
Quantitative immunofluorescence
Serial 5 μm sections were cut at −30°C using a microtome and collected on to room temperature uncoated glass slides. Pre- and post-training sections were placed on the same slide for analysis of eNOS and NOX2 content. For analysis of p-eNOS ser1177 pre- and post-training and pre- and post-exercise sections were placed on the same slide. Two sections from each condition (pre- or post-training and -exercise) were placed on each slide and analysis was performed in duplicate. Transverse orientated samples were used for all analysis. Sections were left to dry for 1 h before treatment.
The procedures for immunofluorescence staining and subsequent image analysis have been described in detail by Cocks et al. (2012). Briefly, sections were incubated with antibodies against eNOS (Transduction Laboratories, Lexington, KY, USA), p-eNOS ser1177 (Cell Signalling Technology, Beverly, MA, USA) and NOX2 (Santa Cruz Biotechnology, Santa Cruz, CA, USA), which have been previously validated for immunofluorescence (Cocks et al. 2012). Sections where then incubated with appropriately labelled secondary antibodies (Invitrogen, Paisley, UK), in combination with Ulex europaeus I lectin–FITC conjugate (UEA-I–FITC; Sigma-Aldrich, UK) and wheat germ agglutinin-350 (WGA-350; Invitrogen, UK) as markers of the endothelium and plasma membrane, respectively.
For analysis, slides were viewed using a Nikon E600 microscope using a 40× 0.75 numerical aperture objective. Images were captured using a SPOT RT KE colour three shot CCD camera (Diagnostic Instrument Inc., Sterling Heights, MI, USA). Camera exposure time and gain was adjusted so that no pixel saturation was present in any channel and identical camera settings were used for all images within each participant. Image analysis was performed using Image Pro Plus 5.1 software (Media Cybernetics Inc., Bethesda, MD, USA). Endothelial specific fluorescence was determined using the Ulex europaeus I lectin–FITC (UEA-I–FITC; endothelial marker) image, which was extracted and overlaid onto the corresponding eNOS, p-eNOS ser1177 or NOX2 image. Cell membrane specific fluorescence for NOX2 was determined using WGA-350 as a stain to create an outline of the cell membrane. The latter was extracted and overlaid onto the corresponding NOX2 image. Fluorescence intensity of the eNOS, p-eNOS ser1177 or NOX2 signal was quantified within the endothelium or cell membrane specific area. The reader was not blinded to condition as image analysis was automated removing the potential effects of investigator bias (Cocks et al. 2012). The mean fluorescence levels of pre-training and pre-training pre-exercise (p-eNOS ser1177 only) samples were normalised to a value of 1, and the relative level of post-training and post-exercise (p-eNOS ser1177 only) samples were calculated.
Capillarisation
Capillaries were quantified manually using the UEA-I FITC and WGA-350 images as capillary and sarcolemmal markers, respectively. The following indexes were measured (Hepple et al. 1997): (1) number of capillaries around a fibre (capillary contacts), (2) capillary-to-fibre ratio on an individual-fibre basis, (3) the number of capillaries sharing a fibre (sharing factor) and (4) capillary density. Quantification of capillarisation was performed only on transverse fibres (longitudinal fibres were discounted from the analysis). In line with previous studies assessing capillarisation, at least 50 complete fibres (pre 52 ± 1, post 52 ± 1 fibres per subject) were included in each analysis (Porter et al. 2002). Fibre cross-sectional area and perimeter were measured on calibrated images using ImagePro Plus 5.1 software.
Statistics
All variables except p-eNOS ser1177 were analysed using a two-way mixed analysis of variance (ANOVA), with the between factor ‘group’ (ET vs. SIT) and repeated factor ‘training status’ (pre-training vs. post-training). p-eNOS ser1177 was analysed using a three-way mixed ANOVA with the factors ‘group’ (ET vs. SIT), ‘training status’ (pre- vs. post-training) and ‘exercise time’ (0 versus 60 min). All analyses were performed using statistical analysis software (SPSS for windows version 16.0; SPSS, Chicago, IL, USA). Significance was set at P≤ 0.05. Data are presented as means ± SEM. All measures of arterial stiffness were measured in 15 participants due to an unacceptable pulse recording in one participant. Due to unsuccessful UEA-I FITC staining in one participant, p-eNOS ser1177 and NOX2 within the endothelium is presented for 15 participants. The primary aim of the study was to compare the effects of ET and SIT on muscle microvascular eNOS content and microvascular density. The study was powered to detect between group (SIT versus ET) differences in the increase in these variables in response to training. G * Power 3.1 software (G * Power Software Inc., Kiel, Germany) was used to calculate the required sample size. The study was designed to detect a between group effect of f= 0.30, representative of a medium sized effect (Cohen, 1992) adopting an alpha of 0.05 and power of 0.80. In light of the paucity of studies investigating the effects of training on microvascular eNOS content we deemed an f of 0.30 to be a physiologically relevant difference.
Results
Training effect
Training increased  (ET 15%, SIT 8%) and Wmax (ET 16%, SIT 9%) with main effect of training (P < 0.05; Table 1) and no difference between groups. Resting heart rate was reduced in both SIT and ET groups following training (main effect of training, P < 0.05; Table 1). Mean and diastolic blood pressures were both reduced by training, with no difference between groups (P < 0.05; Table 1). Systolic blood pressure was not altered by either training method (P= 0.211; Table 1).
Insulin sensitivity
The Matsuda insulin sensitivity index was significantly improved by ET (31%) and SIT (27%), respectively, with no difference between training methods (main effect of training, P < 0.05; Table 1). Both glucose and insulin area under the curve (AUC) were reduced by both methods of training (main effect of training, P < 0.05; Table 1).
eNOS content and eNOS ser1177 phosphorylation
A main effect of training and group on eNOS content was observed (P < 0.05), while there also was a significant interaction (P < 0.05). When within group differences were examined, both SIT and ET significantly increased eNOS content (36%, P < 0.05, 16%, P < 0.05), and when between group differences were probed eNOS content post-SIT was significantly greater than eNOS content post-ET (P < 0.05) (Fig. 1). One hour of moderate intensity exercise significantly increased eNOS ser1177 phosphorylation both before and after training (main effect of time, P < 0.05). Both pre- and post-exercise eNOS ser1177 phosphorylation was lower following training (main effect of training, P < 0.05), with no difference between groups. There was no effect of group or training on the change in phosphorylation from pre- to post-exercise (Fig. 2) meaning that the relative increase in eNOS ser1177 phosphorylation was unchanged by training.
Figure 1. Effects of endurance training (ET) and sprint interval training (SIT) on eNOS content.
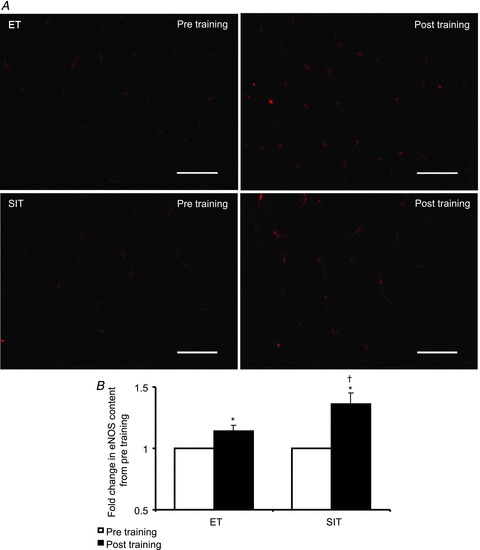
A, widefield microscopy images of skeletal muscle pre- (left) and post- (right) endurance training (top) and sprint interval training (bottom). Skeletal muscle eNOS expression was revealed using Alexa-Fluror 594 conjugated secondary antibody (red). Bar = 50 μm. B, mean fluorescence intensity of eNOS is summarised. The mean level of eNOS pre-training was assigned a value of 1, and the relative intensity of eNOS post-training was calculated (ET n= 8, SIT n= 8). *P < 0.05, different from pre-training. †P < 0.05, different from ET post-training
Figure 2. Effects of acute exercise and endurance training (ET) and sprint interval training (SIT) on eNOS serine1177 phosphorylation.
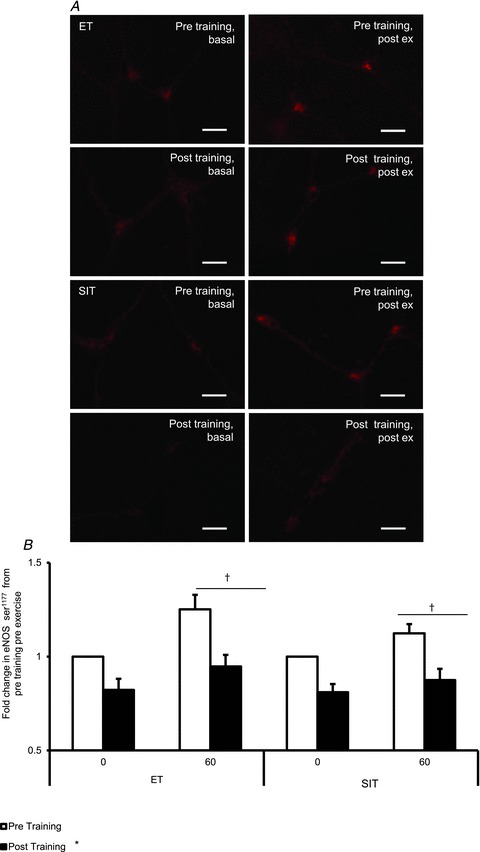
A, widefield microscopy images of skeletal muscle pre-training pre-exercise (Pre, pre), post-training pre-exercise (Pre, post), pre-training post-exercise (Pre, post) and post-training post-exercise (Post, post) in endurance training (top) and sprint interval training (bottom). Skeletal muscle eNOS serine1177 (ser1177) phosphorylation was revealed using Alexa-Fluror 594 conjugated secondary antibody (red). Bar = 5 μm. B, mean fluorescence intensity of eNOS ser1177 is summarised (ET n= 7, SIT n= 8). The mean level of eNOS ser1177 pre-training pre-exercise was assigned a value of 1, and the relative intensity of eNOS ser1177 post-training or post-exercise was calculated. *P < 0.05, main effect of training. †P < 0.05, main effect of time.
NOX2 content
Microvascular and sarcolemma-associated NOX2 expression was unaltered by training, with no difference between groups (microvascular, P= 0.805; membrane, P= 0.085) (Fig. 3).
Figure 3. Effects of endurance training (ET) and sprint interval training (SIT) on NOX2 content.
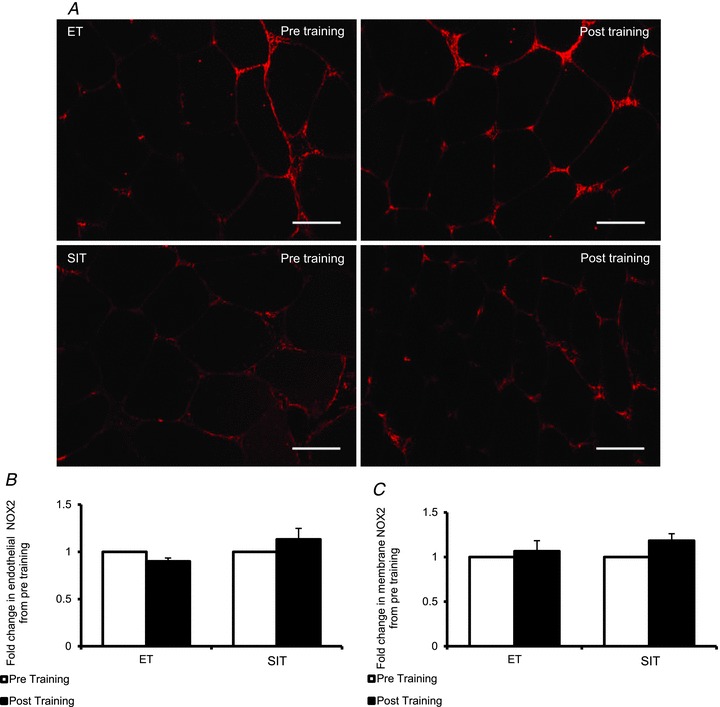
A, widefield microscopy images of skeletal muscle pre- (left) and post- (right) endurance training (top) and sprint interval training (bottom). Skeletal muscle NOX2 content was revealed using Alexa-Fluror 594 conjugated secondary antibody (red). Bar = 50 μm. B, mean fluorescence intensity of NOX2 within the endothelium is summarised (ET n= 7, SIT n= 8). C, mean fluorescence intensity of NOX2 within the muscle membrane is summarised (ET n= 7, SIT n= 8). The mean level of NOX2 pre-training was assigned a value of 1, and the relative intensity of NOX2 post-training was calculated.
Capillarisation
Muscle fibre cross-sectional area and sharing factor were unchanged by training, with no difference between groups (fibre area, P= 0.202; sharing factor, P= 0.085). Capillary contacts increased by 20% and 21% in the ET and SIT groups, respectively, with no difference between groups (main effect of training, P < 0.05). The capillary-to-fibre ratio on an individual-fibre basis was increased in both ET and SIT by 22% and 24%, respectively, with no difference between groups (main effect of training, P < 0.05). Finally, capillary density was increased 32% in the ET group and 27% in the SIT group, with no difference between groups (main effect of training, P < 0.05, Table 2). Representative images from pre- and post-training in both ET and SIT groups are presented in Fig. 4.
Table 2.
Capillarisation pre- and post-training
| Endurance | Sprint interval | |||
|---|---|---|---|---|
| Variable | Pre-training | Post-training | Pre-training | Post-training |
| FA (mm2) | 5131 ± 525 | 4607 ± 398 | 4437 ± 172 | 4339 ± 332 |
| CC | 5.07 ± 0.47 | 6.07 ± 0.55* | 4.53 ± 0.23 | 5.50 ± 0.35* |
| C/FI | 1.90 ± 0.20 | 2.32 ± 0.23* | 1.66 ± 0.10 | 2.07 ± 0.15* |
| SF | 2.69 ± 0.06 | 2.68 ± 0.03 | 2.78 ± 0.02 | 2.71 ± 0.03 |
| CD (caps mm−2) | 663.0 ± 26.5 | 872.9 ± 33.6* | 642.0 ± 34.2 | 816.3 ± 24.0* |
Values are means ± SEM.
P < 0.05, main effect of training. FA, fibre cross-sectional area; SF, sharing factor; CD, capillary density; CC, capillary contacts; C/FI, capillary-to-fibre ratio on an individual-fibre basis.
Figure 4. Effects of endurance training (ET) and sprint interval training (SIT) on skeletal muscle capillarisation.
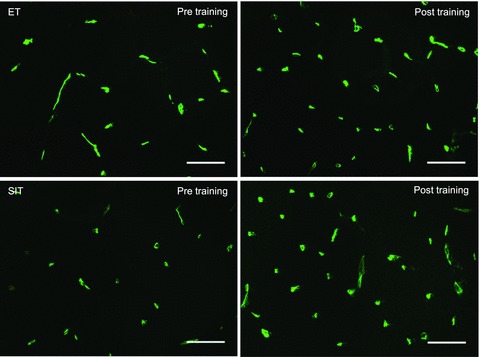
Composite widefield microscopy images of skeletal muscle pre- (left) and post- (right) endurance training (top) and sprint interval training (bottom). Skeletal muscle microvessels were visualised using Ulex europaeus–FITC conjugated lectin (green) and the skeletal muscle membrane was revealed using wheat germ agglutinin-350 (blue). Bar = 50 μm.
Arterial stiffness
AIx@75bpm was significantly decreased following training, with no difference observed between training methods (main effect of training, P < 0.05; Fig. 5A). cPWV was decreased by 5% and 7% following ET and SIT, respectively (main effect of training, P < 0.05; Fig. 5B), whereas pPWV was not significantly altered following either training mode (P= 0.404; Fig. 5C).
Figure 5. Effect of endurance training (ET) and sprint interval training (SIT) on systemic wave reflections and central and peripheral artery stiffness.
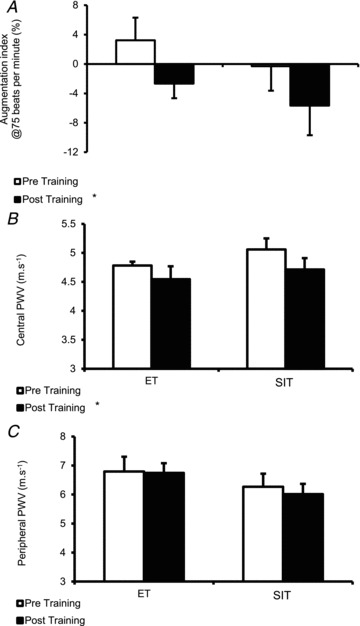
A, systemic wave reflections measured using augmentation index normalised to 75 bpm (AIx@75bpm) following ET and SIT. B, central artery (aortic) stiffness measured using pulse wave velocity (PWV) following ET and SIT. C, peripheral artery (brachial artery) stiffness measured using pulse wave velocity following ET and SIT. *P < 0.05, main effect of training.
Discussion
The most important novel findings of the present study are that: (1) 6 weeks of ET and SIT in young previously sedentary adult males increased skeletal muscle capillarisation to a similar extent, (2) SIT increased the eNOS protein content of the muscle microvascular endothelium more than ET, (3) 1 h of moderate intensity exercise increased eNOS ser1177 phosphorylation irrespective of training status, but with lower pre- and post-exercise eNOS phosphorylation occurring following both modes of training, (4) neither intervention as expected induced a change in the protein expression of NOX2. Finally our results confirm previous reports showing that both ET and SIT significantly decrease arterial stiffness and brachial artery blood pressure and increase insulin sensitivity. Our integrative approach suggests that SIT is a time efficient alternative training mode for increasing aerobic exercise capacity and changing cardiovascular function in a direction consistent with health benefits in young healthy males.
Aerobic capacity and capillarisation
The 6 week ET and SIT interventions both induced significant improvements in  . These findings are in agreement with a number of recent studies demonstrating that SIT and ET both induce improvements in aerobic capacity (Burgomaster et al. 2008; Gibala et al. 2012). ET has long been known to improve capillarisation of several leg skeletal muscles (Andersen & Henriksson, 1977; Ingjer, 1979). This study is the first to show that SIT improves all measures of capillarisation within the m. vastus lateralis to a similar extent as ET in healthy sedentary young men. Future studies will be required to investigate if this effect also occurs in other muscles. The observation of an increased
  and muscle capillarisation is very important as they occur in the SIT group despite a marked reduction in total exercise duration of the training sessions and total workload of individual training sessions and the cumulative training intervention. Skeletal muscle angiogenesis has been suggested to be the result of several stimuli including contractile activity, shear stress resulting from exercise hyperaemia, low O2 tension and metabolic activity (Egginton, 2009; Wagner, 2011).
Increases in capillarisation and mitochondrial density are well described adaptations to endurance training and both contribute to the increases in aerobic exercise capacity (Bassett & Howley, 2000). This study is the first to show that enhanced muscle capillarisation is also an adaptation that contributes to the increase in aerobic exercise capacity with SIT, while the parallel study executed in the same individuals also showed similar increases in the SIT and ET group in mitochondrial density (Shepherd et al. 2013). This implies that SIT and ET increase two of the major determinants of aerobic exercise capacity at the muscle level and are equally effective in the current study despite a massive difference in the nature of the exercise. The elevated capillarisation following the two training modes may also contribute to the improved delivery of nutrients and hormones to the muscle fibres and therefore contribute to the improvements in insulin sensitivity.
Microvascular enzyme content
This study utilised a new quantitative immunofluorescence microscopy method recently developed in our laboratory (Cocks et al. 2012) to study changes with ET and SIT in the protein content of enzymes that control NO production in the microvascular endothelium of skeletal muscle. Analytical methods such as Western blotting and sandwich enzyme immunoassay techniques which are applied to extracts of whole muscle homogenates do not reveal the relative distribution of these enzymes between muscle fibres and the microvessels and also do not provide information on whether changes in protein expression following training are the result of changes in endothelial protein content or the result of changes in microvascular density. The method used in the present study is the first to generate important information on changes in the protein content and phosphorylation of eNOS and NAD(P)Hox in response to training interventions within the endothelial layer of the microvasculature of human skeletal muscle.
eNOS content
Six weeks of ET and SIT significantly increased the protein content of eNOS within the microvascular endothelium of human skeletal muscle (Fig. 1) with a significantly larger increase occurring following SIT (36%) than following ET (16%). The effect of ET in our study in humans is in line with previous work in rats showing that endurance training increases the eNOS content, measured with Western blots applied to isolated second to fifth order arterioles isolated from the gastrocnemius muscle (McAllister et al. 2005). This increase in eNOS content may potentially lead to increases in NO production upon stimulation by insulin, exercise induced shear stress and exercise induced VEGF production as previously hypothesised (Hood et al. 1998; Vincent et al. 2004; Wagenmakers et al. 2006; Spier et al. 2007). However, future studies making parallel measurements of eNOS content, eNOS ser1177 phosphorylation and muscle microvascular blood volume and flow will be required to confirm that higher eNOS content has functional consequences for muscle microvascular blood flow regulation.
The larger improvement in microvascular eNOS content following SIT is in agreement with previous work in the macrovasculature showing that High intensity interval training increased eNOS content of the aorta more than ET in low aerobic capacity rats (Haram et al. 2009). Given the greater microvascular eNOS expression induced by SIT, it cannot be excluded that SIT is more effective than ET at improving the vasodilatory response of the muscle microvasculature to increases in insulin (meal ingestion) and exercise induced shear stress.
eNOS phosphorylation
This is the first study to report changes in microvascular eNOS ser1177 phosphorylation induced by acute exercise before and after 6 weeks ET and 6 weeks SIT. We show that pre- and post-exercise microvascular eNOS ser1177 phosphorylation was reduced by both modes of training. Shear stress in cultured endothelial cells has been suggested to be one of the most important regulators of eNOS ser1177 phosphorylation (Mount et al. 2007). Therefore, the reduction in microvascular eNOS ser1177 phosphorylation following training that we observe may potentially be the result of a reduction of the size of the shear stress stimulus. As the absolute intensity of the acute cycling exercise was the same before and after training (1 h at 65% of pre-training  ) and the muscle capillary density was higher post-training (Fig. 2), it is likely that blood flow per capillary will be reduced after training both at rest and during cycling exercise. Previous one leg knee extensor training studies (Kiens et al. 1993) have shown that the femoral venous blood flow was lower in the trained than the non-trained leg during exercise at 65% of the
  for the knee extensors, implying that total local muscle blood flow may be lower as well. It should be noted that the relative increase in eNOS ser1177 phosphorylation in response to acute exercise was unaltered by training (Fig. 2). Further studies are required to fully understand the mechanisms behind ET and SIT induced changes in eNOS phosphorylation, capillary density and skeletal muscle perfusion during exercise.
NOX2 content
ET and SIT did not lead to changes in the protein content of the membrane associated subunit of NAD(P)Hox NOX2 in the skeletal muscle microvasculature (Fig. 3B). As in the previous study (Cocks et al. 2012), NOX2 was also observed to be present in the sarcolemma (Fig. 3C) and again SIT and ET did not change the protein content in the sarcolemma. Despite being sedentary, it is unlikely that the young healthy individuals in the present study exhibited high levels of NAD(P)Hox, which may explain the absence of a training effect. NAD(P)Hox is an inducible enzyme and its expression is increased by obesity (Silver et al. 2007), inflammation and cardiovascular disease (Brandes & Kreuzer, 2005). This suggests that any changes observed in microvascular function with training, at least in lean sedentary young men, is mediated by increases in eNOS protein content, rather than a reduction in the scavenging of NO by superoxide anions resulting from a training induced decrease in NAD(P)Hox content.
Arterial stiffness
The present study is the first to show that ET and SIT induce similar changes in central artery stiffness in young healthy sedentary males. Traditional moderate intensity ET has previously been shown to improve central arterial stiffness (Kakiyama et al. 2005; Currie et al. 2009). However, to date SIT studies have failed to show any training induced improvements in central artery stiffness (Rakobowchuk et al. 2008; Whyte et al. 2010). This discrepancy may be due to the following factors. Firstly in the study by Whyte et al. (2010) training duration was only 2 weeks in comparison to the 6 weeks intervention employed in the current study. Secondly, Rakobowchuk et al. (2008) used a different method to measure central stiffness from those employed in the current study (cPWV vs. carotid artery distensibilty) (Rakobowchuk et al. 2008). A considerable variability has been observed between different methodologies to measure central arterial stiffness (Hayashi et al. 2005; Cecelja & Chowienczyk, 2009), and this may also contribute to the discrepancy between the studies.
No change was observed in our study in pPWV following either ET or SIT. This is in agreement with an earlier study that has shown that 16 weeks of ET in middle aged men had no effect on stiffness of muscular peripheral arteries of the leg (Hayashi et al. 2005). However, in contrast to the current study another study investigating the effects of 6 weeks SIT in young sedentary males has observed reductions in stiffness of the popliteal artery stiffness (Rakobowchuk et al. 2008). Differences in arteries used (prone to develop stiffness or not) are likely to explain the differences between these studies (Debasso et al. 2004).
Our study is the first to investigate the effect of SIT on the AIx and compare the effects of 6 weeks ET and SIT and shows that both were equally effective in improving the AIx, an assessment of systemic wave reflection and thus arterial stiffness (Nurnberger et al. 2002). The only other study that has investigated the effect of ET was a study of Edwards et al. (2004) in coronary artery disease patients, which showed that 12 weeks of ET improved the AIx. However, to the authors’ knowledge this is the first time that the AIx has been measured following a period of sustained exercise training in a young healthy sedentary group and that a comparison has been made between the effects of ET and SIT.
Limitations
We decided not to include an untrained control group with repeated measurements in this study for comparison. This would have strengthened the design, but reduced the feasibility of completing the study (e.g. due to costs, time demands and recruitment difficulties). The study was powered to detect a medium effect size between groups for muscle microvascular eNOS content and muscle microvascular density, and as a result it should be noted that the sample size of the study may not have been high enough to detect between-group differences in other variables displaying a larger variability (e.g. increases in  and insulin sensitivity). Translational studies with a larger number of participants are required before it can be concluded that SIT and ET are similarly effective in inducing adaptation in all the variables investigated in this study. We also acknowledge that the conclusions made in this study should also be restricted to previously sedentary young adult males. Finally, the results of the current study and others (Rakobowchuk et al. 2008; Kessler et al. 2012) indicate that both SIT and ET improve a number of cardiovascular functions, but additional larger scale and longer term studies are required before it can be concluded that SIT and ET are equally effective in reducing cardiovascular disease risk in a variety of populations.
In conclusion this study generates novel information that 6 weeks of SIT is as equally effective as 6 weeks of ET in increasing skeletal muscle microvascular density. The study also shows for the first time that ET and SIT both lead to significant increases in microvascular eNOS content, with SIT leading to a greater increase than ET. The study finally generates the novel information that the structural adaptations that occur in the muscle microvasculature in response to SIT and ET lead to a reduced eNOS ser1177 phosphorylation state both at rest and in response to 1 h of endurance exercise at 65% . The increase in microvascular eNOS may contribute to the increases in insulin sensitivity observed following both modes of exercise observed in this study and several earlier studies. The SIT intervention used in this study involved a maximum time commitment of 1.5 h per week, while the ET involved 5 h of exercise per week leading to the conclusion that SIT is a time efficient alternative to achieve these effects in young previously sedentary men. Together with previous reports that SIT and ET elicit similar muscle metabolic (increases in activity of mitochondrial enzymes, aerobic capacity and intramuscular triglyceride breakdown during exercise; Burgomaster et al. 2008; Gibala et al. 2012; Shepherd et al. 2013), and macrovascular adaptations (Rakobowchuk et al. 2008; Kessler et al. 2012), this suggests that SIT is a time efficient alternative training mode to simulate many of the known effects of ET on fitness, the macrovasculature and the metabolic function of skeletal muscle and its microvasculature.
Translational perspective
Hard evidence exists that 3–5 h of endurance exercise per week increases fitness and delays or prevents the onset of chronic diseases. However, the majority of the adult population does not meet current physical activity recommendations. ‘Lack of time’ is the number one cited reason for the widespread failure to maintain life-long physical activity levels. Sprint interval training (SIT) has recently been proposed to serve as an effective time efficient alternative to traditional endurance-based training (ET). SIT has been shown to lead to similar increases in  , which is the strongest predictor of all-cause mortality, in healthy individuals and diseased populations. SIT also leads to similar increases in mitochondrial enzymes, whole body insulin sensitivity and indicators of macrovascular function and health. A growing body of literature suggests that reduced microvascular density and impairments in the endothelium of the muscle microvasculature play an important role in the development of chronic diseases. Therefore, the observations of Cocks and colleagues that SIT in sedentary young males is more effective than ET in increasing muscle microvascular eNOS content and is equally effective at increasing microvascular density are very important. As microvascular density and nitric oxide generation by eNOS in response to stimuli are important for regulating microvascular blood flow and surface area, SIT could be an effective and time-efficient training mode to achieve health benefits in individuals with obesity, anabolic resistance leading to sarcopaenia, type II diabetes, cardiovascular disease and hypertension. Long-term studies investigating the health benefits of SIT in these populations are clearly warranted.
Glossary
- AIx
augmentation index
- AIx@75bpm
augmentation index normalised to 75 beats per minute
- BMI
body mass index
- CC
capillary contacts
- CD
capillary density
- C/FI
capillary-to-fibre ratio on an individual-fibre basis
- cPWV
central pulse wave velocity
- ET
endurance training
- SIT
sprint interval training
- NAD(P)Hox
NAD(P)Hoxidase
- NOX2
subunit of the NAD(P)Hox complex
- NO
nitric oxide
- O2−
superoxide anion
- OGTT
oral glucose tolerance test
- pPWV
peripheral pulse wave velocity
- PWV
pulse wave velocity
- ser1177
serine1177 (main phosphorylation site of eNOS)
- UEA-I–FITC
Ulex europaeus I lectin–FITC conjugate

peak oxygen consumption
- WGA-350
wheat germ agglutinin-350
- Wmax
maximal power output on incremental exercise test
Author contributions
M.C.: design of the experiments; collection, analysis and interpretation of data; drafting and final revision of the manuscript (MS). C.S.S.: design of the experiments; collection, analysis and interpretation of data; drafting of the MS. S.O.S.: design of the experiments; collection, analysis and interpretation of data. J.F.: design of the experiments; analysis and interpretation of data; revision of the MS critically for important intellectual content. T.B.: collection of data; revision of the MS critically for important intellectual content. A.R.: collection of data; revision of the MS critically for important intellectual content. K.T.T.: design of the experiments; collection of data; revision of the MS critically for important intellectual content. A.J.M.W.: design of the experiments; analysis and interpretation of data; drafting and final revision of the MS. All authors approved the final version for publication.
Authors' present addresses
M. Cocks, S. O. Shepherd and A. J. M. Wagenmakers: School of Sport and Exercise Sciences, Liverpool John Moores University, Tom Reilly Building, Byrom Street, Liverpool, UK. C. S. Shaw: Institute of Sport, Exercise, and Active Living, Victoria University, Melbourne, Australia.
References
- Andersen P, Henriksson J. Capillary supply of quadriceps femoris muscle of man – adaptive response to exercise. J Physiol. 1977;270:677–690. doi: 10.1113/jphysiol.1977.sp011975. [DOI] [PMC free article] [PubMed] [Google Scholar]
- Babraj JA, Vollaard NB, Keast C, Guppy FM, Cottrell G, Timmons JA. Extremely short duration high intensity interval training substantially improves insulin action in young healthy males. BMC Endocr Disord. 2009;9:3. doi: 10.1186/1472-6823-9-3. [DOI] [PMC free article] [PubMed] [Google Scholar]
- Barrett EJ, Eggleston EM, Inyard AC, Wang H, Li G, Chai W, Liu Z. The vascular actions of insulin control its delivery to muscle and regulate the rate-limiting step in skeletal muscle insulin action. Diabetologia. 2009;52:752–764. doi: 10.1007/s00125-009-1313-z. [DOI] [PMC free article] [PubMed] [Google Scholar]
- Barrett EJ, Wang H, Upchurch CT, Liu Z. Insulin regulates its own delivery to skeletal muscle by feed-forward actions on the vasculature. Am J Physiol Endocrinol Metab. 2011;301:E252–E263. doi: 10.1152/ajpendo.00186.2011. [DOI] [PMC free article] [PubMed] [Google Scholar]
- Bassett DR, Howley ET. Limiting factors for maximum oxygen uptake and determinants of endurance performance. Med Sci Sports Exerc. 2000;32:70–84. doi: 10.1097/00005768-200001000-00012. [DOI] [PubMed] [Google Scholar]
- Bergstrom J. Percutaneous needle-biopsy of skeletal-muscle in physiological and clinical research. Scand J Clin Lab Invest. 1975;35:606–616. [PubMed] [Google Scholar]
- Brandes RP, Kreuzer J. Vascular NADPH oxidases: molecular mechanisms of activation. Cardiovasc Res. 2005;65:16–27. doi: 10.1016/j.cardiores.2004.08.007. [DOI] [PubMed] [Google Scholar]
- Burgomaster KA, Howarth KR, Phillips SM, Rakobowchuk M, MacDonald MJ, McGee SL, Gibala MJ. Similar metabolic adaptations during exercise after low volume sprint interval and traditional endurance training in humans. J Physiol. 2008;586:151–160. doi: 10.1113/jphysiol.2007.142109. [DOI] [PMC free article] [PubMed] [Google Scholar]
- Cecelja M, Chowienczyk P. Dissociation of aortic pulse wave velocity with risk factors for cardiovascular disease other than hypertension a systematic review. Hypertension. 2009;54:1328. doi: 10.1161/HYPERTENSIONAHA.109.137653. [DOI] [PubMed] [Google Scholar]
- Cocks M, Shepherd SO, Shaw CS, Achten J, Costa ML, Wagenmakers AJM. Immunofluorescence microscopy to assess enzymes controlling NO availability and microvascular blood flow in muscle. Microcirculation. 2012 doi: 10.1111/j.1549-8719.2012.00199.x. (in press; doi: 10.1111/j.1549-8719.2012.00199.x) [DOI] [PubMed] [Google Scholar]
- Cohen J. A power primer. Psychol Bull. 1992;112:155–159. doi: 10.1037//0033-2909.112.1.155. [DOI] [PubMed] [Google Scholar]
- Crecelius AR, Kirby BS, Voyles WF, Dinenno FA. Nitric oxide, but not vasodilating prostaglandins, contributes to the improvement of exercise hyperemia via ascorbic acid in healthy older adults. Am J Physiol Heart Circ Physiol. 2010;299:H1633–H1641. doi: 10.1152/ajpheart.00614.2010. [DOI] [PMC free article] [PubMed] [Google Scholar]
- Currie KD, Thomas SG, Goodman JM. Effects of short-term endurance exercise training on vascular function in young males. Eur J Appl Physiol. 2009;107:211–218. doi: 10.1007/s00421-009-1116-4. [DOI] [PubMed] [Google Scholar]
- Debasso R, Astrand H, Bjarnegard N, Ahlgren AR, Sandgren T, Lanne T. The popliteal artery, an unusual muscular artery with wall properties similar to the aorta: Implications for susceptibility to aneurysm formation. J Vasc Surg. 2004;39:836–842. doi: 10.1016/j.jvs.2003.12.005. [DOI] [PubMed] [Google Scholar]
- Edwards DG, Schofield RS, Magyari PM, Nichols WW, Braith RW. Effect of exercise training on central aortic pressure wave reflection in coronary artery disease. Am J Hypertens. 2004;17:540–543. doi: 10.1016/j.amjhyper.2003.12.001. [DOI] [PubMed] [Google Scholar]
- Egginton S. Invited review: activity-induced angiogenesis. Pflugers Arch. 2009;457:963–977. doi: 10.1007/s00424-008-0563-9. [DOI] [PubMed] [Google Scholar]
- Gibala MJ, Little JP, Macdonald MJ, Hawley JA. Physiological adaptations to low-volume, high-intensity interval training in health and disease. J Physiol. 2012;590:1077–1084. doi: 10.1113/jphysiol.2011.224725. [DOI] [PMC free article] [PubMed] [Google Scholar]
- Haram PM, Kemi OJ, Lee SJ, Bendheim MO, Al-Share QY, Waldum HL, Gilligan LJ, Koch LG, Britton SL, Najjar SM, Wisloff U. Aerobic interval training vs. continuous moderate exercise in the metabolic syndrome of rats artificially selected for low aerobic capacity. Cardiovasc Res. 2009;81:723–732. doi: 10.1093/cvr/cvn332. [DOI] [PMC free article] [PubMed] [Google Scholar]
- Hayashi K, Sugawara J, Komine H, Maeda S, Yokoi T. Effects of aerobic exercise training on the stiffness of central and peripheral arteries in middle-aged sedentary men. Jpn J Physiol. 2005;55:235–239. doi: 10.2170/jjphysiol.S2116. [DOI] [PubMed] [Google Scholar]
- Hepple RT, Mackinnon SLM, Thomas SG, Goodman JM, Plyley MJ. Quantitating the capillary supply and the response to resistance training in older men. Pflugers Arch. 1997;433:238–244. doi: 10.1007/s004240050273. [DOI] [PubMed] [Google Scholar]
- Hood JD, Meininger CJ, Ziche M, Granger HJ. VEGF upregulates ecNOS message, protein, and NO production in human endothelial cells. Am J Physiol Heart Circ Physiol. 1998;274:H1054–H1058. doi: 10.1152/ajpheart.1998.274.3.H1054. [DOI] [PubMed] [Google Scholar]
- Ingjer F. Effects of endurance training on muscle-fiber atpase activity, capillary supply and mitochondrial content in man. J Physiol. 1979;294:419–432. doi: 10.1113/jphysiol.1979.sp012938. [DOI] [PMC free article] [PubMed] [Google Scholar]
- Kakiyama T, Sugawara J, Murakami H, Maeda S, Kuno S, Matsuda M. Effects of short-term endurance training on aortic distensibility in young males. Med Sci Sports Exerc. 2005;37:267–271. doi: 10.1249/01.mss.0000152733.12578.5a. [DOI] [PubMed] [Google Scholar]
- Kessler HS, Sisson SB, Short KR. The potential for high-intensity interval training to reduce cardiometabolic disease risk. Sports Med. 2012;42:489–509. doi: 10.2165/11630910-000000000-00000. [DOI] [PubMed] [Google Scholar]
- Kiens B, Essengustavsson B, Christensen NJ, Saltin B. Skeletal-muscle substrate utilization during submaximal exercise in man: effect of endurance training. J Physiol. 1993;469:459–478. doi: 10.1113/jphysiol.1993.sp019823. [DOI] [PMC free article] [PubMed] [Google Scholar]
- Krentz AJ, Clough G, Byrne CD. Vascular disease in the metabolic syndrome: do we need to target the microcirculation to treat large vessel disease. J Vasc Res. 2009;46:515–526. doi: 10.1159/000226220. [DOI] [PubMed] [Google Scholar]
- Laurent S, Cockcroft J, Van Bortel L, Boutouyrie P, Giannattasio C, Hayoz D, Pannier B, Vlachopoulos C, Wilkinson I, Struijker-Boudier H, European Network N-I Expert consensus document on arterial stiffness: methodological issues and clinical applications. Eur Heart J. 2006;27:2588–2605. doi: 10.1093/eurheartj/ehl254. [DOI] [PubMed] [Google Scholar]
- Matsuda M, DeFronzo RA. Insulin sensitivity indices obtained from oral glucose tolerance testing: Comparison with the euglycemic insulin clamp. Diabetes Care. 1999;22:1462–1470. doi: 10.2337/diacare.22.9.1462. [DOI] [PubMed] [Google Scholar]
- McAllister RM, Jasperse JL, Laughlin MH. Nonuniform effects of endurance exercise training on vasodilation in rat skeletal muscle. J Appl Physiol. 2005;98:753–761. doi: 10.1152/japplphysiol.01263.2003. [DOI] [PubMed] [Google Scholar]
- McAllister RM, Laughlin MH. Vascular nitric oxide: effects of physical activity, importance for health. Essays Biochem. 2006;42:119–131. doi: 10.1042/bse0420119. [DOI] [PubMed] [Google Scholar]
- Milkiewicz M, Hudlicka O, Brown MD, Silgram H. Nitric oxide, VEGF, and VEGFR-2: interactions in activity-induced angiogenesis in rat skeletal muscle. Am J Physiol Heart Circ Physiol. 2005;289:H336–H343. doi: 10.1152/ajpheart.01105.2004. [DOI] [PubMed] [Google Scholar]
- Mount PF, Kemp BE, Power DA. Regulation of endothelial and myocardial NO synthesis by multisite eNOS phosphorylation. J Mol Cell Cardiol. 2007;42:271–279. doi: 10.1016/j.yjmcc.2006.05.023. [DOI] [PubMed] [Google Scholar]
- Nurnberger J, Keflioglu-Scheiber A, Saez AMO, Wenzel RR, Philipp T, Schafers RF. Augmentation index is associated with cardiovascular risk. J Hypertens. 2002;20:2407–2414. doi: 10.1097/00004872-200212000-00020. [DOI] [PubMed] [Google Scholar]
- O’Rourke MF, Staessen JA, Vlachopoulos C, Duprez D, Plante GE. Clinical applications of arterial stiffness; definitions and reference values. Am J Hypertens. 2002;15:426–444. doi: 10.1016/s0895-7061(01)02319-6. [DOI] [PubMed] [Google Scholar]
- Porter MM, Koolage CW, Lexell J. Biopsy sampling requirements for the estimation of muscle capillarization. Muscle Nerve. 2002;26:546–548. doi: 10.1002/mus.10221. [DOI] [PubMed] [Google Scholar]
- Rakobowchuk M, Tanguay S, Burgomaster KA, Howarth KR, Gibala MJ, MacDonald MJ. Sprint interval and traditional endurance training induce similar improvements in peripheral arterial stiffness and flow-mediated dilation in healthy humans. Am J Physiol Regul Integr Comp Physiol. 2008;295:R236–R242. doi: 10.1152/ajpregu.00069.2008. [DOI] [PMC free article] [PubMed] [Google Scholar]
- Rattigan S, Wallis MG, Youd JM, Clark MG. Exercise training improves insulin-mediated capillary recruitment in association with glucose uptake in rat hindlimb. Diabetes. 2001;50:2659–2665. doi: 10.2337/diabetes.50.12.2659. [DOI] [PubMed] [Google Scholar]
- Schrage WG, Wilkins BW, Johnson CP, Eisenach JH, Limberg JK, Dietz NM, Curry TB, Joyner MJ. Roles of nitric oxide synthase and cyclooxygenase in leg vasodilation and oxygen consumption during prolonged low-intensity exercise in untrained humans. J Appl Physiol. 2007;109:768–777. doi: 10.1152/japplphysiol.00326.2010. [DOI] [PMC free article] [PubMed] [Google Scholar]
- Shepherd SO, Cocks M, Tipton KD, Ranasinghe AM, Barker TA, Burniston JG, Wagenmakers AJM, Shaw CS. Sprint interval and traditional endurance training increase net intramuscular triglyceride breakdown and expression of perilipin 2 and 5. J Physiol. 2013;591:657–675. doi: 10.1113/jphysiol.2012.240952. [DOI] [PMC free article] [PubMed] [Google Scholar]
- Silver AE, Beske SD, Christou DD, Donato AJ, Moreau KL, Eskurza I, Gates PE, Seals DR. Overweight and obese humans demonstrate increased vascular endothelial NAD(P)H oxidase-p47(phox) expression and evidence of endothelial oxidative stress. Circulation. 2007;115:627–637. doi: 10.1161/CIRCULATIONAHA.106.657486. [DOI] [PubMed] [Google Scholar]
- Spier SA, Delp MD, Stallone JN, Dominguez JM, Muller-Delp JM. Exercise training enhances flow-induced vasodilation in skeletal muscle resistance arteries of aged rats: role of PGI2 and nitric oxide. Am J Physiol Heart Circ Physiol. 2007;292:H3119–H3127. doi: 10.1152/ajpheart.00588.2006. [DOI] [PubMed] [Google Scholar]
- Tarnopolsky MA, Pearce E, Smith K, Lach B. Suction-modified bergstrom muscle biopsy technique: experience with 13,500 procedures. Muscle Nerve. 2011;43:717–725. doi: 10.1002/mus.21945. [DOI] [PubMed] [Google Scholar]
- Thijssen DHJ, Maiorana AJ, O’Driscoll G, Cable NT, Hopman MTE, Green DJ. Impact of inactivity and exercise on the vasculature in humans. Eur J Appl Physiol. 2010;108:845–875. doi: 10.1007/s00421-009-1260-x. [DOI] [PMC free article] [PubMed] [Google Scholar]
- Vincent MA, Clerk LH, Lindner JR, Klibanov AL, Clark MG, Rattigan S, Barrett EJ. Microvascular recruitment is an early insulin effect that regulates skeletal muscle glucose uptake in vivo. Diabetes. 2004;53:1418–1423. doi: 10.2337/diabetes.53.6.1418. [DOI] [PubMed] [Google Scholar]
- Wagenmakers AJM, van Riel NAW, Frenneaux MP, Stewart PM. Integration of the metabolic and cardiovascular effects of exercise. Essays Biochem. 2006;42:193–210. doi: 10.1042/bse0420193. [DOI] [PubMed] [Google Scholar]
- Wagner PD. The critical role of VEGF in skeletal muscle angiogenesis and blood flow. Biochem Soc Trans. 2011;39:1556–1559. doi: 10.1042/BST20110646. [DOI] [PubMed] [Google Scholar]
- Whyte LJ, Gill JMR, Cathcart AJ. Effect of 2 weeks of sprint interval training on health-related outcomes in sedentary overweight/obese men. Metabolism. 2010;59:1421–1428. doi: 10.1016/j.metabol.2010.01.002. [DOI] [PubMed] [Google Scholar]
- Wilkinson IB, MacCallum H, Flint L, Cockcroft JR, Newby DE, Webb DJ. The influence of heart rate on augmentation index and central arterial pressure in humans. J Physiol. 2000;525:263–270. doi: 10.1111/j.1469-7793.2000.t01-1-00263.x. [DOI] [PMC free article] [PubMed] [Google Scholar]
- Zhang QJ, McMillin SL, Tanner JM, Palionyte M, Abel ED, Symons JD. Endothelial nitric oxide synthase phosphorylation in treadmill-running mice: role of vascular signalling kinases. J Physiol. 2009;587:3911–3920. doi: 10.1113/jphysiol.2009.172916. [DOI] [PMC free article] [PubMed] [Google Scholar]