Abstract
BACKGROUND
Complex fractionated atrial electrograms are used as potential targets for catheter ablation therapy of atrial fibrillation. Although fibrosis has been associated with the presence of fractionated electrograms, characterizing the substrate through the inspection of electrograms is challenging.
OBJECTIVE
To determine how progression of microfibrosis and slow conduction affect electrogram morphology.
METHODS
A microstructure computer model representing a monolayer of cardiac cells was developed. Slow conduction was induced by (1) sodium channel blockade, (2) uniform reduction in cell-to-cell coupling, and (3) microfibrosis incorporated as a set of collagenous septa disconnecting transverse coupling. The density (0 to 30%) and length (30 to 945 μm) of these collagenous septa were varied. Unipolar and bipolar electrograms were computed during paced rhythm for a set of electrodes with different tip sizes.
RESULTS
The analysis of unipolar electrograms with realistic temporal and spatial filtering revealed that increasing the density and length of collagenous septa decreased conduction velocity by up to 75% and increased the amount of fractionation (up to 14 deflections) and asymmetry of the electrograms. In contrast, slow conduction induced by sodium channel blockade or uniformly-reduced coupling did not result in electrogram fractionation. When a larger electrode was used, electrogram amplitude was smaller and fractionation increased in a substrate-dependent way.
CONCLUSION
Microscale obstacles cause significant changes to electrogram waveforms. Conduction velocity and electrogram amplitude and degree of fractionation can be used to discriminate the nature of the substrate and characteristics of fibrosis giving rise to slow conduction.
Keywords: computer modeling, atrial electrogram, electrogram fractionation, substrate mapping, fibrosis, slow conduction
Introduction
Complex fractionated atrial electrograms (CFAEs) have been used to identify sites for catheter ablation therapy of atrial fibrillation (AF) as they are believed to indicate regions of altered conduction and changes in cardiac tissue structure1. Using mapping data of human AF, Konings et al.2 related the degree of unipolar electrogram fractionation to the underlying activation pattern. When a pattern was classified as slow conduction, 58±21% of the electrograms were fractionated2. Centurión et al.3 analyzed bipolar electrograms in the right atrium of 111 patients with paroxysmal AF to assess the influence of advancing age on atrial endocardial electrograms recorded during sinus rhythm. They found that the number of abnormal atrial electrograms, defined as lasting 100 ms and/or showing eight or more fragmented deflections, correlated positively with age. Aging tissue has been shown to have increased fibrosis and other histological changes4. While not definitive, the study suggests that features of the electrograms during sinus rhythm or from pacing might be useful for uncovering areas of fibrosis and degenerative changes in the atrial muscle underlying AF.
One limitation of Centurión’s study is that the degree of fibrosis in each of the patients was not assessed directly3. As a result, it was not possible to determine how the characteristics of fibrosis (i.e. length and density of collagenous septa) related to the features of the measured electrograms. An alternative approach to study the effect of tissue structure on electrogram morphology is to make use of computer simulation. To date, most studies have considered obstacles or inhomogeneity at the scale of 1–3 mm inside models with otherwise continuous properties5,6,7,8. Several studies have suggested that the spatial scale of heterogeneity is often much smaller (e.g. microfibrosis)4,9,10 and, consequently, requires more detailed models to fully study the effects of the substrate on electrogram morphology.
In this paper, we develop a two-dimensional microstructure model of atrial tissue that represents a thin layer of coupled cardiac cells to investigate how slow conduction produced by (1) reduced sodium channel density or sodium channel blockade, (2) uniformly reduced transverse coupling, and (3) microfibrosis observed as collagenous septa disconnecting transverse coupling4, affect the amplitude, duration and degree of fractionation of computed electrograms. In addition, we investigate how both electrode sizes and temporal filter bandwidths alter the waveshape. The results show that, with realistic temporal and spatial filtering, increasing the density and length of collagenous septa decreases conduction velocity and increases the amount of fractionation and asymmetry of the electrograms, suggesting that the signal could be used to discriminate the substrate and the nature of microfibrosis giving rise to slow conduction.
Methods
Microstructure model
Following the approach proposed by Spach et al.4, a two-dimensional model representing the microstructure of a monolayer cardiac tissue, 8.64 by 2.88 mm in size, was created, as described in Jacquemet et al.10. The model was composed of 8,354 randomly shaped cells (length: 156±29 μm; cross-section: 213±75 μm2). The myocytes were discretized into segments of size 15 by 10 μm. The myocyte membrane kinetics were described by the Ramirez et al. model of canine atrial cell11, with the maximum sodium conductance increased to 11.7 nS/pF to match experimental upstroke velocity4,10.
Discrete cell-to-cell coupling was introduced to reproduce the gap junction distribution observed in adult cardiac tissue4. These electrical connections were mainly located at end-to-end regions (intercalated disk). Additional sparse coupling covering 30% of the remaining cell lateral wall was added. The coupling conductance per unit contact area between the connected cell segments was set to 8.182 nS/μm2 for both longitudinal and transverse connections10. The resistivity inside each cell was assumed to be 200 Ω cm.
Substrates for slow conduction
Three substrates were created that represent different mechanisms of slow conduction: reduced coupling, sodium channel blockade and microfibrosis. Reduced coupling was implemented as a uniform decrease in transverse coupling conductance by a factor of 1 to 34. Sodium channel blockade was simulated as a reduction in fast-inward sodium channel conductance (gNa) by 0 to 80%. Microfibrosis was introduced as a set of collagenous septa disconnecting transverse coupling, as proposed by Spach et al.4 These septa were aligned with fiber orientation and randomly distributed over the tissue, covering 5% to 30% (by steps of 5%) of the side-to-side contact area between the myocytes (microfibrosis density D). Their length was distributed following a Poisson distribution with an average length (L) of 30 μm, 165 μm, 315 μm, 630 μm or 945 μm. These lengths cover the range 90 to 830 μm (average: 315 μm) observed by Spach et al.4 in aging atrial bundles. For each of the 30 cases (5 lengths, 6 densities), 6 different realizations of the random distribution of collagenous septa were generated. Examples of such microfibrosis distribution are shown in Fig. 1.
Figure 1.
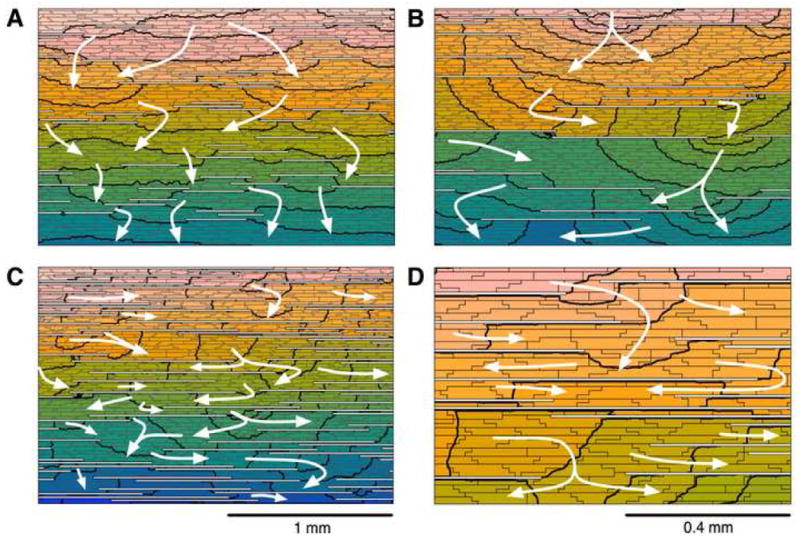
Tissue structure and activation pattern for different microfibrosis density (D) and length of collagenous septa (L). A zoom on a 2.16×1.44-mm piece located at the center of the tissue is shown. The white horizontal lines represent collagenous septa. Activation times are color-coded. Isochrones are drawn every 0.5 ms. White arrows illustrate wavefront propagation from top to bottom. (A) D=10%, L=315 μm; (B) D=10%, L=945 μm; (C) D=30%, L=945 μm; (D) zoom on panel C.
Impulse propagation was simulated in the monodomain framework. Time integration of the finite-volume discretized equations was performed using a semi-implicit Crank-Nicholson scheme (time step: 10 μs) and a preconditioned conjugate gradient solver10. Longitudinal and transverse plane waves were initiated by stimulating an edge of the rectangular tissue. Conduction velocity (CV) was computed by linear regression of the activation times.
Electrical signals
The genesis of electrical signals was examined in four steps. First, extracellular potentials were computed by assuming the recording site was a point on the tissue (i.e. a punctual unipolar electrode recording). Second, disc electrodes of different sizes were simulated to account for spatial averaging effects. Third, bipolar electrograms were derived from the unipolar ones (point or disc). Finally, standard frequency-domain filtering was applied.
Unipolar electrograms were computed at 87 sites forming an ellipse-shaped grid of electrodes with inter-electrode distance of 0.24 mm. For that purpose, the monolayer tissue was immersed in an unbounded isotropic volume conductor with conductivity σe representing the surrounding tissue and blood12. The volume conduction effect of interstitial anisotropy on bath potentials has been shown to be small12, and is neglected. The electrical activity in this medium is generated by membrane current sources Im located in the plane of the monolayer (assuming the cells are tightly packed laterally). According to Geselowitz’s formulation, the electrode potential φe measured at a point y is computed as a volume integral over the cardiac tissue12
| (1) |
The transfer function Z (in cylindrical coordinates) for a punctual electrode is given by12
| (2) |
where r is the distance between x and the projection of y on the plane of the monolayer tissue. The electrode-tissue distance z was set to the average cell radius 8.24 μm to avoid divergence. The resulting signals were found to be relatively insensitive to z provided that z was small enough. The conductivity σe was set to 5.34 mS/cm so that the average peak-to-peak amplitude was 1 mV for longitudinal propagation in the control case.
The simulation of electrodes with non-negligible size can be performed using the same formulation as Eq. (1). The principle of reciprocity implies that the transfer function Z is given by the potential field generated by the electrode when a unit current is injected into it13,14. The perturbation of the electric field by the electrode is taken into account by imposing that the potential is constant over the electrode surface. This problem can be solved analytically in the case of a disc electrode14. For a disc of diameter de, the transfer function is given by:
| (3) |
When the disc diameter tends to zero, the formula is consistent with Eq. (2). Unipolar electrograms measured by disc electrodes of diameter 0.1, 0.24, 0.48 and 0.96 mm were computed at 13 sites (inter-electrode distance: 0.48 mm) forming a subset of the 87 sites for punctual electrodes. The same scaling factor was used as for punctual electrodes.
Bipolar electrograms were computed by subtracting unipolar signals. Because of the small tissue size, only 4 bipolar electrodes were used, each consisting in two disc electrodes of diameter 0.96 mm separated by 0.23 mm and forming an angle of 22.7 degrees with respect to transverse wavefront propagation.
All signals were generated at a sampling frequency of 10 kHz. The effect of temporal filtering was investigated by applying a zero-phase, second-order, 30–500 Hz bandpass Butterworth filter similar to those used in clinical devices1.
Signal analysis
Electrogram morphology was characterized by its amplitude, asymmetry and number of deflections. If the absolute value of the maximal and minimal voltage in the electrogram complex was R and S, the amplitude A and the asymmetry a of an electrogram waveform were defined as6,15:
| (4) |
The number of deflections was defined as the number of local extrema (turning points), as described by Lellouche et al.8 Deflections of less than 10% of the signal peak-to-peak amplitude were ignored in the extrema-finding algorithm, as well as those occurring during the application of the stimulus or after the end of tissue depolarization. A unipolar waveform will be referred to as a single potential when its number of deflections is smaller than 3, as a double potential when its number of deflections is between 3 and 5, and as a fragmented potential otherwise2.
Results
Impulse propagation
For a normal tissue under control conditions, impulse propagation was macroscopically uniform despite local irregularities at the microscale10. The conduction velocity was 64.4 cm/s for a plane wave propagating along cells (LCV) and 29.3 cm/s for a plane wave propagating across cells (TCV). When sodium channel conductances were reduced by up to 80%, LCV and TCV decreased down to 26.2 and 11.9 cm/s respectively, maintaining a CV anisotropy ratio of 2.2. When the transverse coupling was progressively reduced by a factor of 1 to 34, the TCV decreased approximately as the square root of the coupling conductance to 5.8 cm/sec while LCV was only slightly affected (slower by up to 5.4%)16.
The introduction of microfibrosis in the control model caused wavefront propagation to become more discrete. Figure 1 shows examples of impulse propagation in tissue with various degrees of microfibrosis. With increasing microfibrosis density, wavefront propagation became significantly delayed by the longer pathways going around the obstacles. For a given microfibrosis density, the perturbation of the activation pattern was more pronounced when the length of the collagenous septa was longer (Fig. 1A vs 1B) and non-negligible as compared to the longitudinal space constant (1.2 mm). Long collagenous septa created isthmuses leading to local quasi-elliptic waves (Fig. 1B). In the extreme cases (Fig. 1C), longitudinal propagation formed a large part of the pathways for transverse propagation (zigzag propagation). In addition, wavefront collisions were common.
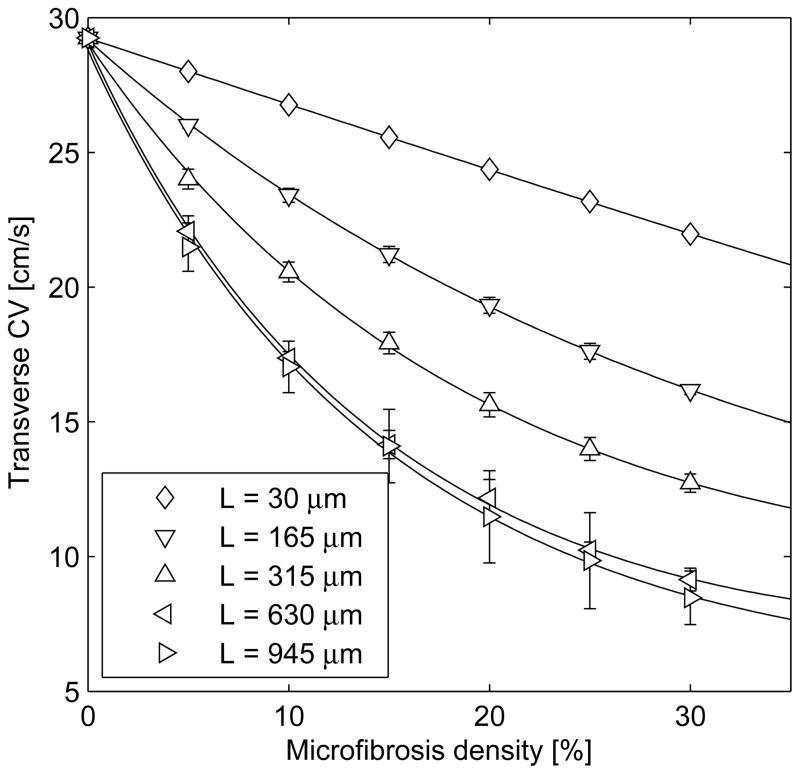
Figure 2 shows that the density and length of collagenous septa both influence CV. In the most severe case of microfibrosis, TCV was 7.5 cm/s. For the same density, the effect was significantly stronger when the collagenous septa were longer, such that transverse decoupling occurred in an organized, non-random fashion. In contrast, even in the presence of lateral decoupling induced by severe microfibrosis, LCV decreased by less than 1%.
Figure 2.
Conduction velocity for transverse propagation (mean±SD over 6 different tissues) as a function of microfibrosis density (D) and average length of collagenous septa (L).
Unipolar electrogram morphology
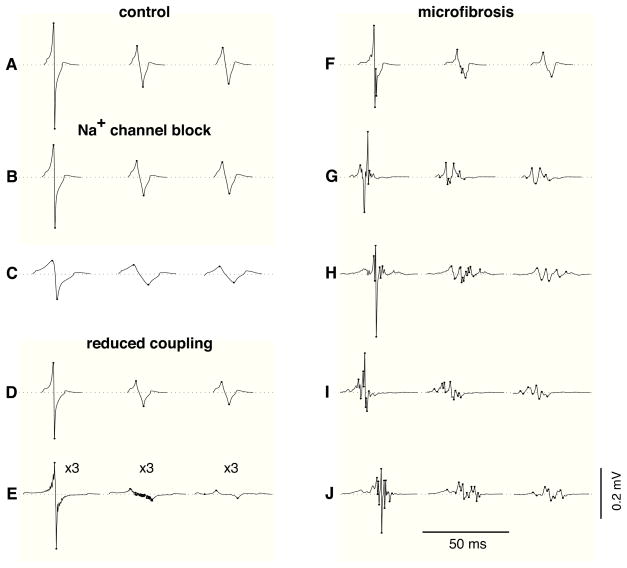
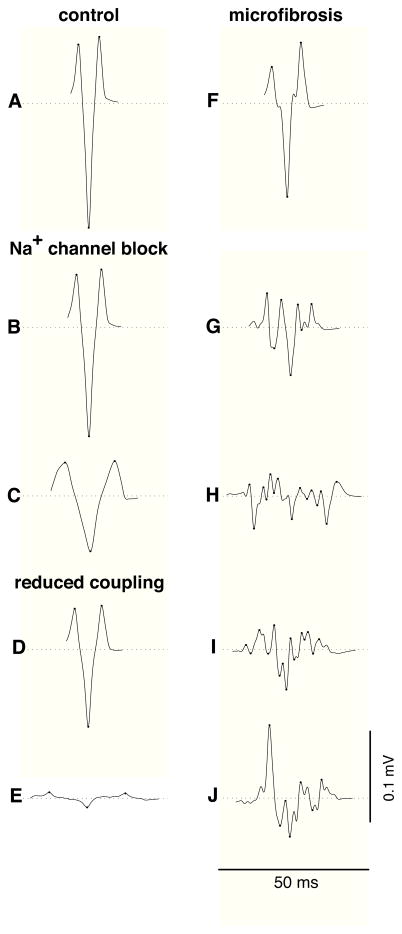
Figure 3 displays examples of unipolar electrograms during transverse propagation, computed using (1) a punctual electrode, (2) an electrode with diameter 0.96 mm, and (3) after the application of a 30–500 Hz bandpass filter using the 0.96 mm electrode. In the control tissue, electrograms measured by punctual electrodes had an amplitude of A=0.435±0.09 mV and an asymmetry of a=−0.20±0.02 (Fig. 3A). Larger electrodes generated lower amplitude signals (Fig. 3). The reduction of CV by sodium channel blockade reduced the electrogram amplitude and prolonged waveform duration but did not induce fractionation (Figs. 3B–C). Slow conduction produced by reduced transverse coupling had a similar effect on extracellular potentials (Fig. 3D), except at extremely low coupling value (Fig. 3E) where fluctuations in potential were observed due to the discrete nature of impulse propagation. These fluctuations, however, disappeared after temporal filtering (Fig. 3E). In contrast, slow conduction produced by the presence of microfibrosis lead to significant electrogram fractionation (Figs. 3F–J). The spatial averaging resulting from using a larger electrode led to a more pronounced decrease in amplitude in fractionated electrograms than in control (Fig. 3H). Temporal filtering removed some of the high frequency fluctuations of the signals, thus reducing the number of deflections.
Figure 3.
Examples of unipolar electrograms during transverse propagation. In each panel, three electrogram waveforms are displayed; from left to right: punctual electrode (no filtering), electrode with diameter 0.96 mm (no filtering), electrode with diameter 0.96 mm (filtered). Dots are placed on the turning points contributing to the number of deflections. (A) control; (B) 40% sodium channel blockade; (C) 80% sodium channel blockade; (D) transverse coupling reduced by a factor of 2; (E) idem, by a factor of 19.3 (these electrograms are amplified by 3); (F) microfibrosis with density D=10% and length of collagenous septa L=315 μm; (G) idem, with D=20% and L=630 μm; (H)–(J) idem, with D=30% and L=945 μm.
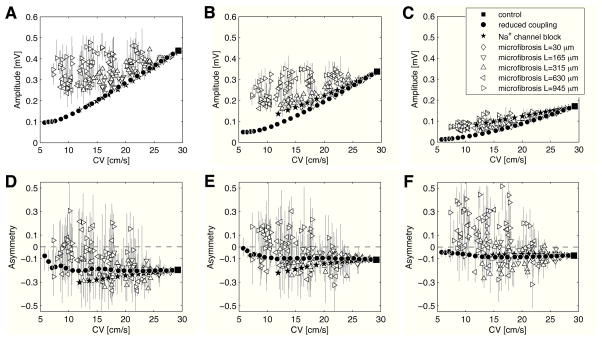
Characterization of electrogram morphology (in the absence of temporal filtering) is summarized in Fig. 4 as a function of TCV. In general, the slower the TCV, the smaller the electrogram amplitude. The amplitude of fractionated electrograms caused by microfibrosis was sometimes as large or even larger than control, even at very slow conduction (open vs filled symbols in Fig. 4A). These cases were associated with longer collagenous septa. When the electrode diameter was larger (0.24 mm in Fig. 4B and 0.96 mm in Fig. 4C), however, these large deflections tended to disappear due to the spatial averaging (see Fig. 3H) and more closely followed the amplitudes of the reduced sodium and reduced coupling cases.
Figure 4.
Electrogram morphology for different electrode sizes (without bandpass filtering). For each simulation, electrogram amplitude (panels A, B, C) and asymmetry (panels D, E, F) are shown as a function of conduction velocity for transverse propagation. Error bars represent interquartile range. Electrode diameter is 0 mm (panels A, D), 0.24 mm (panels B, E), and 0.96 mm (panels C, F).
For the control tissue, tissue with reduced coupling and tissue with sodium channel blockade, all electrograms were negatively asymmetric (a<0) for all electrode sizes (Figs. 4D–F). In the presence of microfibrosis with long collagenous septa, a significant fraction of positively asymmetric (a>0) signals were observed. For a punctual electrode, 22.1%, 34.7% and 42.3% of the waveforms were positively asymmetric for a length of collagenous septa of L=315, 630 and 945 μm (respectively) (Fig. 4D). These fractions increased to 38.9%, 56.8% and 71.6% (respectively) for an electrode of diameter 0.96 mm (Fig. 4F).
Electrogram fractionation
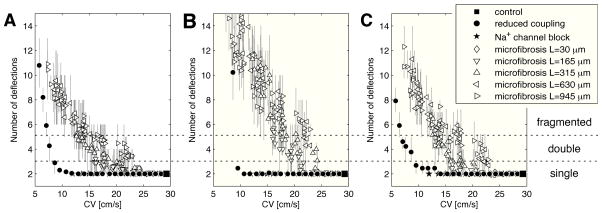
Figure 3 showed that microfibrosis is a possible source of electrogram fractionation. To quantify the complexity of electrogram waveforms in areas of slow conduction, the average number of deflections for the different tissues was represented as a function of TCV in Fig. 5A. In slow conduction zones caused by sodium channel blockade, electrograms were always single potentials. When transverse coupling was reduced, electrogram fractionation was only observed in extreme cases (TCV<8 cm/s), as illustrated by the signals of Fig. 3E. In the presence of microfibrosis, double potentials appeared when TCV was reduced by more than 20%. Between 15 and 25 cm/s, most of the electrogram waveforms were double potentials when the length of collagenous septa was longer then 500 μm. Below 15 cm/s, highly fractionated potentials were observed (Fig. 3H–J).
Figure 5.
Electrogram fractionation: average number of deflections in unipolar electrograms as a function of the transverse conduction velocity for all the simulations. (A) Punctual electrode (no filtering); (B) electrode with diameter 0.96 mm (no filtering); data points for reduced coupling when CV<7 cm/s are out of scale (about 30 deflections); (C) electrode with diameter 0.96 mm (filtered).
When a larger electrode was used, electrograms featured more deflections due to spatial averaging effects (Fig. 5B), except those recorded in tissues with sodium channel blockade which remained single potentials. In case of extreme transverse decoupling (TCV<8 cm/s), electrograms had up to 30 small-amplitude deflections that were still larger than 10% of the (small) signal amplitude. As expected from the examples of Fig. 3, the effect of temporal filtering (Fig. 5C) is a reduction in the number of deflections, down to a level comparable with punctual electrodes in the absence of filtering (Fig. 5A).
Analysis of bipolar electrograms
During catheter ablation, the presence of CFAE is generally established using bipolar electrograms. The relevance of the results for unipolar electrograms to the analysis of the bipolar ones was examined by comparing these signals. Figure 6 shows bipolar electrograms (0.96 mm diameter electrodes, filtered) corresponding to those of Fig. 3. The amplitude of bipolar electrograms was larger by a factor 1.41 in control, 1.43±0.02 with sodium channel blockade, 1.46±0.04 with reduced coupling, and 1.39±0.13 (range: 0.96–1.66) with microfibrosis. Bipolar electrograms were characterized by a larger number of deflections that was well correlated with the number of deflections in the corresponding unipolar electrograms (correlation coefficient: 0.96; linear regression: nbi=1.24 nuni+0.24).
Figure 6.
Examples of bipolar electrogram during transverse propagation (filtered). Dots are placed on the turning points contributing to the number of deflections. The signals correspond to those of Fig. 3: (A) control; (B) 40% sodium channel blockade; (C) 80% sodium channel blockade; (D) transverse coupling reduced by a factor of 2; (E) idem, by a factor of 19.3; (F) microfibrosis with density D=10% and length of collagenous septa L=315 μm; (G) idem, with D=20% and L=630 μm; (H)–(J) idem, with D=30% and L=945 μm.
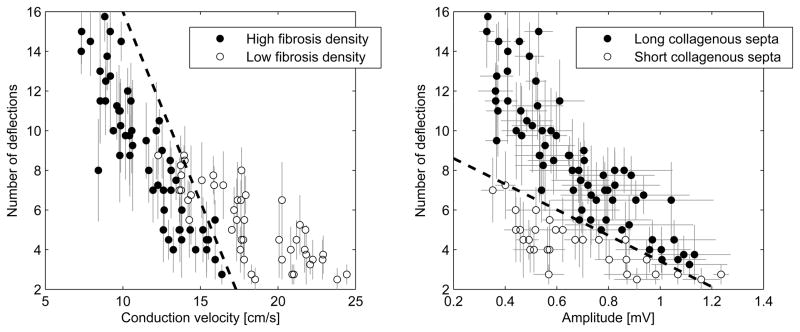
In order to evaluate the potential of using bipolar signals to extract information about the characteristics of microfibrosis, the amplitude and number of deflections of bipolar electrograms were related to the microfibrosis density and the average length of collagenous septa. Four groups were defined on the basis of the microfibrosis density, high (≥20%) or low (<20%), and the average length of collagenous septa, long (>500 μm) or short (<500 μm). Figure 7 shows that the low fibrous density and high fibrous density electrograms tend to cluster based on the conduction velocity and number of deflections. Similarly the length of the collagenous septa tend to cluster based on the amplitude and the number of deflections.
Figure 7.
Classification between high (≥20%) and low (<20%) microfibrosis density (panel A) and between long (>500 μm) and short (<500 μm) collagenous septa (panel B) based on transverse conduction velocity and amplitude and number of deflections of filtered bipolar electrograms. Error bars represent standard deviation. Dashed lines correspond to separation lines of a linear classifier. Only data points for simulations resulting in at least one fractionated electrogram (>3 deflections) are shown.
Discussion
Link between the substrate and electrogram fractionation
Fractionated electrograms are routinely observed in patients with AF. In contrast, in computer models based on a continuous medium with uniform conduction properties, almost all electrogram waveforms are single potentials, even in the presence of multiple wavelets, wavebreaks and conduction blocks6. Models including macroscopic heterogeneity (abrupt changes in tissue conductivity or macroscale obstacles) presented a higher percentage (15 to 17%) of fractionated electrograms6,8,7. The simulated electrograms from these models, however, showed fewer deflections than those recorded in AF patients. The reduction of complexity in these simulated signals suggests that a representation of the tissue microstructure is required to explain highly fractionated electrograms. In this study, a microstructure model was developed to investigate the occurrence of electrogram fractionation in zones of slow conduction. The results depended critically on the substrate responsible for slow propagation (Fig. 3). Uniformly-reduced expression of either sodium channels (by delivering a class I antiarrhythmic drug, for instance) or gap junctions did not result in electrogram fractionation. Slow conduction alone is therefore not sufficient to explain electrogram fractionation. In contrast, slow transverse conduction caused by microfibrosis was associated with electrogram fractionation. When microfibrosis was more severe (higher density or longer collagenous septa), electrograms were more fractionated, as demonstrated by their higher number of deflections (Fig. 5). The collagenous septa, aligned with fiber orientation, only marginally affected longitudinal propagation and electrogram morphology. The degree of electrogram fractionation and CV are therefore candidate parameters for quantitatively assessing the progression of fibrosis during catheter ablation procedures.
Effect of electrode size
A novel finding from this study is that the electrode size affects electrogram complexity. As shown in Figs. 4 and 5, the spatial averaging from larger electrodes did not affect the amplitude, asymmetry and degree of fractionation of the electrograms for all substrates in the same way. Highly fractionated electrograms had amplitudes similar to control (sometimes larger) for a punctual electrode, whereas fractionated electrograms recorded by an electrode with a larger diameter were associated with smaller amplitude and a more pronounced asymmetry. With a larger tip size, the main peak generated by the local activation was attenuated and masked by the other deflections generated by nearby activation, making it harder to identify local activation time from the electrogram. These results also hold for bipolar signals. A difference is that stronger asymmetry in unipolar signals translates into larger amplitude in bipolar signals. This is the reason why amplitude was a useful parameter to discriminate between short and long collagenous septa (Fig. 7). The CFAE criteria17 for identifying the regions to ablate are therefore expected to depend on the catheter or navigation system used. It is important to emphasize that the size refers to the contact area between the electrode and the tissue. Catheter electrodes with portions of the tip not in contact and hence large sizes have not been considered in this study.
Study limitations
The two-dimensional nature of the tissue description does not account for further electrogram fractionation due to the delayed activation of weakly-coupled sub-epicardial layers or additional fiber bundles18,15. The model used in this study rather corresponds to a monolayer of cardiac cells laterally decoupled by microfibrosis. Instead of trying to reproduce a specific tissue preparation microstructure9, our model gives the ability to control the density and the severity of fibrosis. The relatively small size of the model (8.64 by 2.88 mm) prevented the use of large electrode (diameter >1 mm), especially bipolar ones, in order to avoid boundary effects. The choice of a disc electrode was motivated by the existence of an analytical formula to account for the resulting spatial filtering effects. Simulated electrograms had a smaller amplitude than typical clinical electrograms because the (monolayer) tissue was thinner than the atrial wall. When the electrode moves with respect to the tissue due to the mechanical activity, further spatial averaging takes place, which may be modeled by an increased effective electrode size.
The monodomain formulation enabled us to completely separate the computation of the activation sequence from the computation of the potentials in the extracellular medium (including the perturbing effect of the electrode). The validity of this approximation was addressed by Turner et al.7 in a similar model involving fibrosis. They found small quantitative differences between propagation according to the monodomain and the bidomain formulation. A more realistic formulation would define an independent tridimensional domain for each cell, enabling the computation of interstitial potentials, but the computational complexity of this approach has so far limited its applicability to small fiber bundles19.
Conclusion
This study evaluated by means of a computer model the idea of substrate mapping during paced rhythm. The results supported the hypothesis that electrogram morphology may reveal information about microstructure since, in the model, the occurrence of CFAEs was consistently associated with regions of severe fibrosis. A combination of clinically relevant measures based on bipolar electrograms (CV, electrogram amplitude and degree of fractionation) was sufficient to provide a separation line to cluster the density of fibrosis and length of collagenous septa (Fig. 7). These results suggest that it may be possible to characterize the nature of fibrosis through the appropriate analysis of clinical signals recorded during paced rhythm in AF patients. A clinical validation would, however, require the ability to assess fibrosis in vivo through the histological examination of a tissue sample. To improve robustness, the number of deflections may be replaced with power spectrum-based measures to quantify waveform complexity. The dataset generated by the model would be useful to validate such measure.
Acknowledgments
This work was supported by Swiss National Science Foundation Grant PA002-113171 and National Heart, Lung, and Blood Institute Grant R01 HL–76767. The authors thank Dr. L. Dang (Klinik im Park, Zürich, Switzerland) and Dr. T. Bahnson (Duke University Medical Center, Durham, NC) for useful discussions and suggestions.
List of abbreviations
- AF
atrial fibrillation
- CFAE
complex fractionated atrial electrogram
- CV
conduction velocity
- TCV
transverse CV
- LCV
longitudinal CV
Footnotes
Conflicts of interest
none.
Publisher's Disclaimer: This is a PDF file of an unedited manuscript that has been accepted for publication. As a service to our customers we are providing this early version of the manuscript. The manuscript will undergo copyediting, typesetting, and review of the resulting proof before it is published in its final citable form. Please note that during the production process errors may be discovered which could affect the content, and all legal disclaimers that apply to the journal pertain.
References
- 1.Nademanee K, McKenzie J, Kosar E, et al. A new approach for catheter ablation of atrial fibrillation: mapping of the electrophysiologic substrate. J Am Coll Cardiol. 2004;43(11):2044–53. doi: 10.1016/j.jacc.2003.12.054. [DOI] [PubMed] [Google Scholar]
- 2.Konings KT, Smeets JL, Penn OC, et al. Configuration of unipolar atrial electrograms during electrically induced atrial fibrillation in humans. Circulation. 1997;95(5):1231–41. doi: 10.1161/01.cir.95.5.1231. [DOI] [PubMed] [Google Scholar]
- 3.Centurion OA, Isomoto S, Shimizu A, et al. The effects of aging on atrial endocardial electrograms in patients with paroxysmal atrial fibrillation. Clin Cardiol. 2003;26(9):435–8. doi: 10.1002/clc.4960260911. [DOI] [PMC free article] [PubMed] [Google Scholar]
- 4.Spach MS, Heidlage JF, Dolber PC, et al. Mechanism of origin of conduction disturbances in aging human atrial bundles: experimental and model study. Heart Rhythm. 2007;4(2):175–85. doi: 10.1016/j.hrthm.2006.10.023. [DOI] [PMC free article] [PubMed] [Google Scholar]
- 5.Ellis WS, Auslander DM, Lesh MD. Fractionated electrograms from a computer model of heterogeneously uncoupled anisotropic ventricular myocardium. Circulation. 1995;92(6):1619–26. doi: 10.1161/01.cir.92.6.1619. [DOI] [PubMed] [Google Scholar]
- 6.Jacquemet V, Virag N, Ihara Z, et al. Study of unipolar electrogram morphology in a computer model of atrial fibrillation. J Cardiovasc Electrophysiol. 2003;14(10 Suppl):S172–9. doi: 10.1046/j.1540.8167.90308.x. [DOI] [PubMed] [Google Scholar]
- 7.Turner I, Huang CLH, Saumarez RC. Numerical simulation of paced electrogram fractionation: relating clinical observations to changes in fibrosis and action potential duration. J Cardiovasc Electrophysiol. 2005;16(2):151–61. doi: 10.1046/j.1540-8167.2005.30490.x. [DOI] [PubMed] [Google Scholar]
- 8.Lellouche N, Buch E, Celigoj A, et al. Functional characterization of atrial electrograms in sinus rhythm delineates sites of parasympathetic innervation in patients with paroxysmal atrial fibrillation. J Am Coll Cardiol. 2007;50(14):1324–31. doi: 10.1016/j.jacc.2007.03.069. [DOI] [PubMed] [Google Scholar]
- 9.Tanaka K, Zlochiver S, Vikstrom KL, et al. Spatial distribution of fibrosis governs fibrillation wave dynamics in the posterior left atrium during heart failure. Circ Res. 2007;101(8):839–47. doi: 10.1161/CIRCRESAHA.107.153858. [DOI] [PubMed] [Google Scholar]
- 10.Jacquemet V, Henriquez CS. Loading effect of fibroblast-myocyte coupling on resting potential, impulse propagation, and repolarization: insights from a microstructure model. Am J Physiol Heart Circ Physiol. 2008;294(5):H2040–52. doi: 10.1152/ajpheart.01298.2007. [DOI] [PMC free article] [PubMed] [Google Scholar]
- 11.Ramirez RJ, Nattel S, Courtemanche M. Mathematical analysis of canine atrial action potentials: rate, regional factors, and electrical remodeling. Am J Physiol Heart Circ Physiol. 2000;279:H1767–85. doi: 10.1152/ajpheart.2000.279.4.H1767. [DOI] [PubMed] [Google Scholar]
- 12.Geselowitz DB, Barr RC, Spach MS, et al. The impact of adjacent isotropic fluids on electrograms from anisotropic cardiac muscle. A modeling study Circ Res. 1982;51(5):602–13. doi: 10.1161/01.res.51.5.602. [DOI] [PubMed] [Google Scholar]
- 13.Plonsey R. Dependence of scalar potential measurements on electrode geometry. Rev Sci Instrum. 1965;36(7):1034–6. [Google Scholar]
- 14.van Oosterom A, Strackee J. Computing the lead field of electrodes with axial symmetry. Med Biol Eng Comput. 1983;21(4):473–81. doi: 10.1007/BF02442636. [DOI] [PubMed] [Google Scholar]
- 15.Houben RPM, de Groot NMS, Smeets JLRM, et al. S-wave predominance of epicardial electrograms during atrial fibrillation in humans: indirect evidence for a role of the thin subepicardial layer. Heart Rhythm. 2004;1(6):639–47. doi: 10.1016/j.hrthm.2004.08.015. [DOI] [PubMed] [Google Scholar]
- 16.Hubbard ML, Ying W, Henriquez CS. Effect of gap junction distribution on impulse propagation in a monolayer of myocytes: a model study. Europace. 2007;9(Suppl 6):vi20–8. doi: 10.1093/europace/eum203. [DOI] [PubMed] [Google Scholar]
- 17.Scherr D, Dalal D, Cheema A, et al. Automated detection and characterization of complex fractionated atrial electrograms in human left atrium during atrial fibrillation. Heart Rhythm. 2007;4(8):1013–20. doi: 10.1016/j.hrthm.2007.04.021. [DOI] [PubMed] [Google Scholar]
- 18.Spach MS, Dolber PC. Relating extracellular potentials and their derivatives to anisotropic propagation at a microscopic level in human cardiac muscle. Evidence for electrical uncoupling of side-to-side fiber connections with increasing age. Circ Res. 1986;58(3):356–71. doi: 10.1161/01.res.58.3.356. [DOI] [PubMed] [Google Scholar]
- 19.Roberts SF, Stinstra JG, Henriquez CS. Effect of nonuniform interstitial space properties on impulse propagation: a discrete multidomain model. Biophys J. 2008;95(8):3724–37. doi: 10.1529/biophysj.108.137349. [DOI] [PMC free article] [PubMed] [Google Scholar]


