

Abstract
Objective
Essential tremor (ET) is characterized by an action tremor believed to be due to excessive theta–alpha activity in the cerebello–thalamo–cortical system. This study aimed to test the hypothesis that therapeutic thalamic stimulation in patients with ET decreases theta–alpha oscillatory activity in primary motor (M1) and sensory (S1) cortices.
Methods
During surgical treatment of ET in 10 patients, an electrocorticography (ECoG) strip electrode was placed temporarily over the arm region of M1 and S1. Local field potentials (LFP) were recorded at rest, during a tremor-inducing posture, during acute therapeutic thalamic stimulation, and following therapeutic thalamotomy (three patients). Power spectral density (PSD) was calculated using the Fast Fourier Transform.
Results
At rest, alpha activity (8–13 Hz) in M1 was significantly decreased during high-frequency stimulation, while theta activity (4–8 Hz) decreased in S1. Following thalamotomy, theta and beta (13–30 Hz) was increased in M1. Induction of postural tremor reduced M1 theta, alpha and beta activity compared to the resting state.
Conclusions
High-frequency thalamic deep brain stimulation (DBS) significantly reduces alpha oscillatory activity in the primary motor cortex of patients with ET, though this change is probably not critical for therapeutic efficacy.
Significance
We demonstrate that ECoG can be effectively used to study the effect of subcortical stimulation on cortical oscillations.
Keywords: Essential tremor, Electrocorticography, Local field potentials, Deep brain stimulation, Sensorimotor cortex
1. Introduction
Deep brain stimulation (DBS) of the ventrolateral thalamus is a well-documented, effective treatment for essential tremor (ET) (Benabid et al., 1996), though its mechanism remains undefined. DBS provides equivalent tremor control to permanent lesioning of the ventrolateral thalamus (thalamotomy) (Schuurman et al., 2000). It has been hypothesized that ET is due to increased oscillatory activity in the cerebello–thalamo–cortical system. This has been supported by the identification of cells in the motor thalamus that oscillate at tremor frequency (Marsden et al., 2000; Lyons and Pahwa, 2004; Lenz et al., 1994). A second hypothesis follows that DBS acts to suppress tremor by disrupting this oscillatory activity. Whether DBS exerts its effect locally on the thalamus, or more broadly alters thalamocortical activity, remains unknown. Recent work has indicated that DBS acts pre-synaptically in the thalamus, preventing propagation of an aberrant cerebellothalamic signal (Anderson et al., 2006). This suggests that alteration of cortical activity may not be necessary for the therapeutic effect of thalamic DBS, though no study has specifically addressed this question. The aim of this study was to use intraoperative electrocorticography (ECoG) in ET patients undergoing brain stimulator placement or thalamotomy, to test the hypothesis that acute thalamic stimulation disrupts oscillatory activity in sensorimotor cortex.
2. Methods
2.1. Subjects
Study subjects were recruited from the Surgical Movement Disorders Clinic at the University of California San Francisco. All patients had the diagnosis of ET, confirmed by a movement disorder neurologist (NBG or JLO), were refractory to medical therapy and, therefore, offered either unilateral thalamic DBS lead placement or unilateral thalamotomy, based on the patient’s preference. Normal brain magnetic resonance imaging (MRI) examination and the ability to participate in an awake procedure were necessary for inclusion into the study. Patients exhibiting a resting limb tremor were excluded. All patients underwent formal characterization of their tremor utilizing the Fahn–Tolosa–Marin Tremor Rating Scale (FTM). This study was approved by the UCSF Institutional Review Board.
2.2. Surgical procedure
Pre-operative imaging and targeting was performed as previously described (Papavassiliou et al., 2004). Briefly, we used a surgical planning workstation (Stealth, Medtronic Inc., Minneapolis, MN) and software (Framelink, Medtronic Inc.) to target the ventrolateral thalamus at a point 6 mm anterior to the posterior commissure (PC) and 10 mm lateral to the lateral wall of the third ventricle on a contrast-enhanced T1-weighted MRI. On this MRI, we also identified a point on the primary motor cortex (M1, identified anatomically relative to the central sulcus), 3 cm from the midline, in the same parasagittal plane as the planned DBS lead entry point. This point was intended to be just medial to the “hand knob,” in the arm-related area of M1 (Yousry et al., 1997). Target and trajectory planning for the DBS lead or lesion probe were based solely on clinical considerations and not altered for this protocol.
Patients received conscious sedation (propofol) during the initial opening and drilling of the burr hole. A wide dural opening was made to allow easy passage of the ECoG strip. Methods for ECoG recording during movement disorders surgery have been previously described (Crowell et al., 2012). Briefly, a radio-opaque marker was stereotactically placed on the scalp over the intended M1 recording site. A 6-contact ECoG strip (4 mm contacts, 1 cm spacing, Ad-Tech, Racine, WI or Integra Lifesciences, Plainsboro, NJ) was placed subdurally, such that the middle of the strip was situated below the radio-opaque marker. The location of the ECoG strip was confirmed using intraoperative CT (iCT) (Shahlaie et al., 2011) or lateral fluoroscopy. Somatosensory evoked potentials (SSEP) were recorded (5000 Hz sampling rate, band-pass filtered 1–500 Hz, amplified 7000×) during stimulation of the median nerve (pulse frequency = 2 Hz, pulse width = 200 µs, pulse train length = 160, amplitude 25–40 mA) for physiologic confirmation of the electrode position. The physiologic location of M1 was determined by visually inspecting the signal-averaged SSEP for adjacent bipolar contact pairs and identifying reversal of the N20 waveform. The most posterior bipolar pair that showed a negative-going waveform was considered to be the M1 pair. The contact pair immediately posterior to M1 (non-overlapping) was considered to be S1. The ECoG strip was removed prior to securing the DBS lead to the skull.
For those in whom a DBS lead was implanted, bipolar macrostimulation (contact 0−, 3+, 180 Hz, 90 µs, 1–6 V) was performed through the lead (Medtronic 3387, Medtronic Inc. or St. Jude Medical DBS lead, 1.5 mm spacing, St. Jude Medical, Plano, TX) to confirm appropriate location for tremor control and assess for adverse effects of stimulation. For patients undergoing thalamotomy, monopolar stimulation (180 Hz, 90 µs, 1–3 V) was performed through the lesion probe (Cosman TC electrode, Cosman Medical, Burlington, MA) to confirm location prior to lesioning.
2.3. ECoG recordings
Propofol sedation was stopped at least 30 min prior to recordings to allow the patient to become fully alert and ensure sufficient time for recovery from propofol-induced neuronal effects (Fechner et al., 2004; Raz et al., 2010). Cortical LFPs were recorded using a customized 14-channel recording system (Guideline 4000 system, FHC Inc., Bowdoin, ME) approved by the United States Food and Drug Administration for human use. LFPs were recorded from each of the five most posterior ECoG contacts (1–5) referenced to the most anterior contact (6), with a scalp needle electrode serving as the ground. Recordings were sampled at 1000 Hz (three patients) or 2000 Hz (five patients), bandpass filtered 1–500 Hz, and amplified 7000×. A 60 Hz notch filter was used to reduce line artifact. The empirically-tested frequency response of the intrinsic 1 Hz high-pass filter of the Guideline system showed slight attenuation of the signal below 20 Hz. Therefore, the power spectral density of each frequency data point below 20 Hz was corrected using the square of the ratio of the input amplitude to the output amplitude to account for this attenuation.
ECoG recordings were performed while the patient was either in a “rest” or “tremor” position. During the rest position, the patient was asked to relax their arms at their sides while keeping their eyes open and focusing on a point approximately 1 m in front of them. During the tremor position, the patient was asked, using the contralateral arm, to hold a 500 ml sealed saline bottle near his/her mouth with the shoulder abducted and the elbow flexed. This position resulted in a high-amplitude, low-frequency tremor during the baseline exam, and intra-operatively prior to therapeutic interventions. LFPs (at least 30 s) were recorded in each position prior to lead or lesion probe insertion (pre-lead), once the lead or probe was lowered to the target (post-lead), and during high-frequency stimulation (180 Hz). High-frequency stimulation was performed as described above, at an amplitude sufficient to abolish tremor, but below the threshold for persistent paresthesias (Medtronic 1–1.5 V or St. Jude Medical 0.5–2 mAmps, equal to half the amplitude at which persistent paresthesias occurred). In some patients, additional recordings were obtained during low-frequency stimulation (50 or 60 Hz at 2× the amplitude as used during high-frequency stimulation, four patients) or after completion of the thalamotomy lesion (post-lesion, three patients).
2.4. EMG and accelerometry
Surface electromyography (EMG) was recorded from contralateral biceps brachii and extensor carpi radialis (bandpass filter 20–1000 Hz, amplification 7000× to 10,000×). Tri-axial accelerometry was recorded from the forearm. Both EMG and accelerometry were sampled at the same frequency as the LFP (1 or 2 kHz).
2.5. Signal analysis
All signal analysis was performed using custom programs created in MATLAB (Mathworks, Natick, MA). The ECoG recordings were computationally re-montaged into adjacent bipolar pairs (1–2, 2–3, etc.) for further analysis. Power spectral density (PSD) was calculated using the Welch periodogram method (Matlab function pwelch) with 1.95 Hz frequency resolution (512 and 1024 FFT for 1 kHz and 2 kHz sampling rates, respectively; 50% overlap using Hanning window). Also using the Welch periodogram method, magnitude squared coherence was calculated (Matlab function mscohere) between cortical LFP and EMG signals.
2.6. Grouped analysis and statistics
In order to use parametric statistics in grouped data analysis, PSD was log transformed prior to further analysis. Mean log PSD and its standard deviation were calculated at each frequency point. Because the amplitude of the signal varied between patients, all grouped statistical analyses were based on the mean difference in log PSD between conditions (e.g. rest vs. tremor position) at each frequency point. Change in log PSD across each of three frequency bands: theta (3.9–7.8 Hz, 3 frequency points), alpha (9.7–13.7 Hz, 3 frequency points), and beta (15.6–29.3 Hz, 8 frequency points) was calculated by averaging the change in log PSD in each band for each patient, then averaging these to obtain the grouped mean. Statistical significance was determined using within subjects, repeated measure, Student’s t-test (α = p < 0.05). The Bonferonni correction was then applied to account for multiple comparisons. Significant peaks in cortex-EMG coherence were assessed for each patient using the Halliday method (Halliday et al., 2000), setting the threshold of significance as 1 − (0.05)(1/(L−1)), where L is the number of nonoverlapping data segments used to analyze EMG coherence.
3. Results
3.1. Patient characteristics
Ten patients, five females and five males, participated in this study (see Table 1 for patient characteristics). Seven had DBS implantation. One of these patients (No. 7) had undergone DBS implantation in the contralateral thalamus 1 year prior. Stimulation of the contralateral thalamus remained off throughout the procedure. Due to patient choice or medical concerns over long-term risks of hardware implantation, thalamotomy was performed in three patients (Nos. 5, 6, and 8). Mean tremor frequency in the contralateral arm in the “tremor position” was 4.1 (range 3–6) Hz.
Table 1.
Patient Characteristics.
| Pt. No. | Age/sex | Handed-ness | Duration (years) | Pre-op arm score | Tremor frequency (Hz) | Side of ECoG | EEG–EMG coherence |
|---|---|---|---|---|---|---|---|
| 1 | 71 M | R | 20 | FTM 17 | 4.5 | L | N |
| 2 | 71 M | R | 45 | FTM 25 | 3.3 | L | N |
| 3 | 77 F | R | 30 | FTM 9 | 4.5 | R | N |
| 4 | 64 F | R | 12 | FTM 19 | 4.2 | L | N |
| 5 | 79 F | R | 50 | FTM 14 | 4.5 | L | N |
| 6 | 60 M | R | 15 | FTM 17 | 6 | L | N |
| 7 | 68 F | R | 48 | FTM 16a | 4.4 | R | N |
| 8 | 81 M | R | 20 | FTM 25^ | 3 | L | Y |
| 9 | 63 F | R | 19 | FTM 26 | 3 | L | Y |
| 10 | 77 M | R | 20 | FTM 12a^ | 3.9 | L | Y |
Fahn–Tolosa–Marin Tremor Rating Scale (FTM) reported is total of contralateral arm score (Part A 5 or 6, + Part B 10–14).
indicates handwriting (Part B 10) or
pouring (Part B 14) subscores not completed/included.
3.2. Effect of tremor on M1 and S1 cortical LFP
While patients were in the rest position, power spectral analysis of the cortical LFP showed predominant activity across the high alpha-low beta frequency range (8–20 Hz) in both M1 (Fig. 1A) and S1 (Fig. 1E). Peak PSD occurred at a mean frequency of 9.8 Hz in both M1 and S1. In comparison to the rest position, alpha–beta PSD decreased in both M1 and S1 while the patient maintained the tremor position (Fig. 1B and F), though the frequency of peak PSD did not change. This decrease in PSD was significant across theta, alpha and beta bands in M1 (p < 0.02, Fig. 1C) and theta and alpha bands in S1 (p < 0.02, Fig. 1G). When corrected for multiple comparisons (Bonferroni), there remained a significant difference in theta and alpha bands in M1 and in the alpha band in S1. The decrease in alpha–beta activity during tremor is similar, in magnitude and frequency characteristics, to the movement-related alpha–beta desynchronization of sensorimotor cortex LFPs documented in subjects without a movement disorder (Crone et al., 1998). One patient exhibited a slight increase in M1 and S1 PSD in the theta frequency band while maintaining tremor posture, with respect to the non-tremulous resting state (Fig. 1D and H, respectively). This indicates that the presence of a clinically meaningful tremor is not associated with a narrow-band spectral peak at tremor frequency or its harmonics, in primary sensorimotor cortex.
Fig. 1.

Mean M1 log power spectral density (PSD) during rest (A) and while holding the tremor posture (B). The dotted lines represent ± standard error of the mean. The mean difference in PSD (tremor-rest) across frequency is shown in (C). Mean S1 power spectral density at rest (E) and during tremor posture (F), as well as mean difference (G) are also shown. The change in PSD (tremor-rest) for each of the individual patients is shown in panels D (M1) and H (S1). * = p < 0.05.
3.3. Effect of high frequency stimulation on cortical LFP
Because the degree of tremor suppression caused by lead insertion (“microlesion” effect, assessed clinically by reduction in tremor amplitude) varied between patients, cortical LFP PSD during high frequency stimulation was compared to the pre-lead insertion condition. In addition, we focused on recordings obtained while the patient was at rest to isolate the effects of stimulation on cortical activity and remove the confounding effect of the strong alpha–beta desynchronization associated with the presence of tremor.
Visual inspection of the raw LFP recordings in the seven subjects undergoing bipolar stimulation through a DBS electrode indicated that the low frequency cortical activity could be adequately analyzed in the presence of high frequency stimulation artifact as illustrated in Fig. 2A–C. Low pass filtering of the signal removes the stimulation artifact (Fig. 2B and C). In one thalamotomy patient (No. 5), LFP recordings could not be obtained during stimulation due to significant interference/artifact from the radiofrequency lesion machine. In the remaining two patients who underwent thalamotomy, monopolar stimulation through the RF lesioning probe produced similar stimulation-related artifacts as bipolar stimulation through DBS electrodes, and did not interfere with LFP analysis, (see example Fig. 2D and E).
Fig. 2.

Effect of bipolar and monopolar deep brain stimulation on ECoG recordings. The raw signal (left-hand side) is shown with its respective PSD (right-hand side). Part A was recorded during the rest position, with DBS off. Part B: rest position with bipolar DBS on. Part C shows the same recordings shown in Part B after low-pass filtering (<50 Hz). Parts D and E are recordings from a patient who underwent monopolar stimulation through a radiofrequency electrode just prior to thalamotomy. Both pre- (D) and post- (E) low-pass filtered recordings are shown.
As can be seen in Fig. 3, high-frequency thalamic stimulation resulted in desynchronization of alpha activity in M1 (p = 0.037, Fig. 3A and B), while desynchronization of theta activity occurred in S1 (p = 0.015, Fig. 3E and F). The S1 desycnrhonization remained significant after correction for multiple comparisons. For M1, alpha power reduction occurred in seven of nine patients, with a small increase in PSD alpha power across the same frequency range in two patients (Fig. 3D). Mean change in PSD during high-frequency stimulation is shown in Fig. 3C and G. The mean change in PSD for individual patients is shown in Fig. 3D and H. This change in PSD was specific to high frequency stimulation as the same phenomenon was not seen during low frequency (60 Hz) stimulation (data not shown).
Fig. 3.
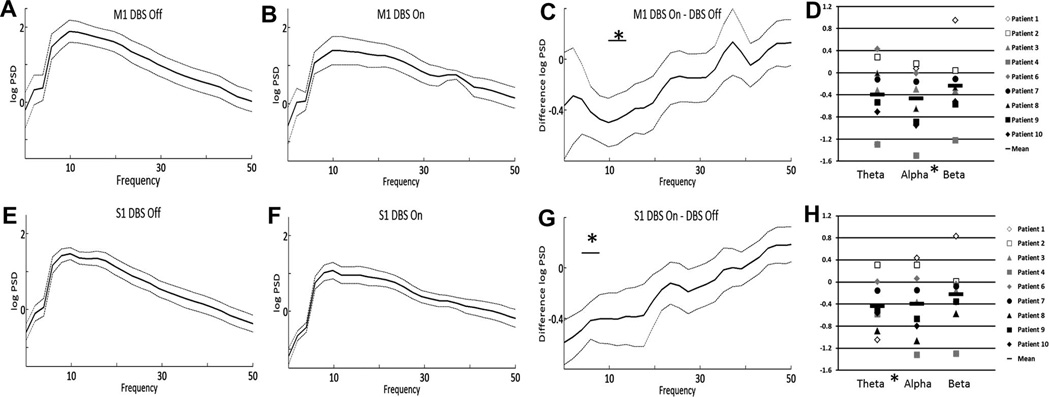
Effect of high-frequency DBS on PSD. Mean M1 log power spectral density (PSD) during DBS off (A) and DBS on (B). The dotted lines represent ± standard error of the mean. The mean difference in PSD (DBS on–DBS off) across frequency is shown in (C). Mean S1 power spectral density, DBS off (E) and DBS on (F), as well as mean difference (G) are also shown. The change in PSD (DBS on–DBS off) for each of the individual patients is shown in panels D (M1) and H (S1). All recordings were performed while the patient was in the rest position. * = p < 0.05.
3.4. Effect of thalamotomy on cortical LFP
In contrast to the effect of high frequency stimulation, an increase in PSD was seen across the theta (p = 0.044) and beta (p = 0.035) frequency ranges was seen following thalamotomy in M1 (Fig. 4A–D), however this was not significant after correction for multiple comparisons. This was not seen in S1 (Fig. 4E–H).
Fig. 4.

Effect of thalamotomy on PSD. Mean M1 log power spectral density (PSD) before (A) and after (B) lesioning. The dotted lines represent ±standard error of the mean. The mean difference in PSD (after–before lesioning) across frequency is shown in (C). Mean S1 power spectral density, before (E) and after (F) lesioning, as well as mean difference (G) are also shown. The change in PSD (after–before lesioning) for each of the individual patients is shown in panels D (M1) and H (S1). All recordings were performed while the patient was in the rest position. * p < 0.05.
3.5. LFP–EMG coherence
Tremor frequency while holding the tremor posture (Table 1) was determined by visual inspection of the raw EMG and accelerometry tracings. LFP–EMG coherence was evaluated using the EMG signal measured from the extensor carpii radialis, which routinely gave the most robust signal. In three patients, a small, but significant peak was noted in the coherence spectra at tremor frequency (see example Fig. 5), however no significant ECoG–EMG coherence was found in the remaining seven patients. EMG recordings from hand intrinsic muscles were not performed in this study.
Fig. 5.
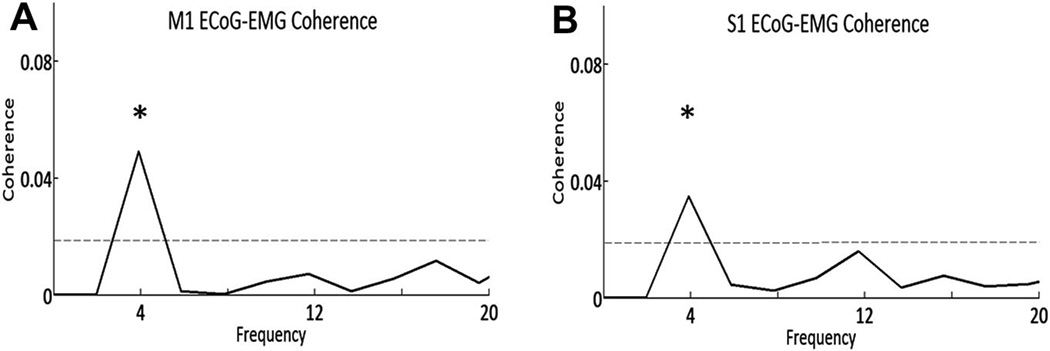
EMG–ECOG coherence. Example data from Patient 10 shows M1-extensor carpi radialis (A) and S1-extensor carpi radialis (B) coherence. The dotted line indicates the threshold for significance and * indicates significance (p < 0.05) at the tremor frequency.
4. Discussion
Here we present the results of the first study to utilize ECoG to measure the effect of high frequency thalamic stimulation on primary sensorimotor cortical activity. The ECoG technique has the potential advantages of stronger signal amplitude and better source localization compared with scalp electroencephalography (EEG) or magnetoencephalography (MEG). Utilizing bipolar cortical LFP recordings, evaluation of low frequency rhythms during clinically effective DBS was technically achievable without specially designed amplifiers or artifact blanking circuits. With this technique we characterized sensorimotor cortical activity in subjects with ET during the resting state without tremor, during a tremor inducing posture, and during therapeutic DBS. A tremor-inducing posture did not produce a specific tremor-frequency rhythm in M1 or S1, but rather a broadband 4–30 Hz theta–alpha–beta desynchronization (Fig. 1). Thalamic DBS at a clinically effective frequency produces a narrower desynchronization of sensorimotor cortical LFP across the alpha frequency range (Fig. 3).
During the awake, resting state in humans without movement disorders, alpha-low beta frequency activity predominates in the sensorimotor LFP (Crone et al., 1998). As we have noted previously (Crowell et al., 2012), this frequency also predominates at rest in patients with ET (Fig. 1). Further, voluntary movement in normal subjects reduces (“desynchronizes”) alpha–beta LFP activity (Crone et al., 1998; Miller et al., 2009). Our study subjects, like most patients with ET, did not have resting tremor. Thus, an outstretched posture was necessary to induce tremor, and the reduction in alpha–beta activity seen during tremor may be a “nonspecific” effect of the voluntary movement necessary to induce tremor, rather than an effect of the tremor. In patients with parkinsonian tremor, Timmerman et al. reported increased M1 oscillatory activity that occurred predominantly at twice the frequency of clinical tremor (Timmermann et al., 2003). Here, we did not detect a tremor-associated increase in cortical oscillatory activity either at tremor frequency or its harmonics, but the broad movement-related desynchronization observed during the outstretched posture could have masked a smaller increase in 10 Hz oscillatory activity induced by tremor.
A number of studies in human movement disorders have examined the acute effects of subcortical brain stimulation on subcortical local field potentials recorded in the same structure (Kuhn et al., 2008; Wingeier et al., 2006). Such studies are technically difficult, as stimulation artifact may saturate the amplifiers used for recording. Here, we evaluated the effect of subcortical brain stimulation on a recording site, sensorimotor cortex, located 5–6 cm from the stimulation site. We show that, using bipolar recording, M1 and S1 oscillatory activity at <50 Hz can be effectively assessed during stimulation with minimal artifact. This technical approach may prove useful in mechanistic studies of deep brain stimulation for other movement disorders.
We found that cortical oscillatory activity was affected differently by thalamotomy compared to thalamic stimulation. The major effect of thalamotomy was a trend toward an increase, rather than a decrease, in theta–alpha activity in M1. The fact that high-frequency DBS and thalamotomy had opposing effects on the M1 LFP (Supplementary Fig. S1) while providing similar degrees of tremor control (Schuurman et al., 2000 and Supplementary Fig. S2), indicates that M1 theta–alpha desynchronization is not critical for a therapy to be clinically effective in reducing symptoms of ET. Previous work by Anderson et al. in which DBS acted pre-synaptically to cause a “functional deafferentation” has also indicated that the effect of DBS may be independent of changes of thalamocortical activity (Anderson et al., 2006).
4.1. Pitfalls in interpretation
Prior studies have documented the frequency of tremor in patients with essential tremor to be 4–10 Hz (Calzetti et al., 1987; Elble, 1986; Wade et al., 1982). In our study, the frequency was on the low end of this range (3–6 Hz). This is likely due to specific tremor-inducing the arm position maintained by the patient, which would tend to evoke proximal rather than distal tremor, and the inertial load created by holding a 500 ml bottle, further reducing the frequency of the limb tremor. Advanced disease may also have contributed to the low frequency.
Our study was primarily designed to examine acute effect of thalamic DBS on cortical activity, rather than the relationship of cortex to muscle activity during tremor. Raethjen et al. documented coherence at tremor frequency between sensorimotor LFP, as measured by EEG, and surface EMG (Raethjen et al., 2007). Consistent with their finding, Schnitzler et al. also found coherence between sensorimotor LFP and surface EMG of hand intrinsic muscles by MEG (Schnitzler et al., 2009). However, several other groups have not found such coherence (Halliday et al., 2000) or have noted it to be inconsistent across recordings (Raethjen et al., 2007; Hellwig et al., 2001, 2003). We found significant coherence between cortical LFP and EMG in only three of the 10 patients studied. Prior studies have noted the ability to detect coherence dependent on the signal-to-noise ratio of the EMG recordings (Raethjen et al., 2007; Hellwig et al., 2001), which was quite variable in our patients. In addition, we did not record EMG over hand intrinsic muscles (extensively used in the studies cited above).
The oscillation frequencies studied here were relatively near to the 1 Hz cut off of intrinsic high-pass filter present in our clinical recording equipment. In spite of post hoc correction of power spectra for the frequency response of the filter, the slow roll-off of the filter may have reduced the fidelity of the signal at tremor frequency, limiting the ability to detect narrowband oscillations close to 1 Hz.
5. Conclusions
Intra-operative ECoG is a technically feasible method of studying the acute effects of subcortical stimulation on cortical oscillations. Induction of postural tremor did not produce any increase in sensorimotor cortex LFP power at tremor frequency or its harmonics. High-frequency thalamic DBS decreased theta–alpha activity in the primary sensorimotor cortex of patients with ET. This phenomenon was not present following clinically effective thalamotomy, suggesting that cortical alpha–beta desynchronization is not critical for tremor control.
Supplementary Material
HIGHLIGHTS.
High-frequency thalamic deep brain stimulation (DBS), but not thalamotomy, significantly reduces alpha oscillatory activity in the primary motor cortex of patients with essential tremor (ET).
Thalamotomy does not reduce alpha oscillatory activity, indicating that alpha desynchronization is not essential to the therapeutic efficacy of deep brain stimulation (DBS) in the treatment of essential tremor (ET).
ECoG can be effectively used to study the effect of subcortical stimulation on cortical oscillations.
Acknowledgements
This study was supported by the NIH (R01 NS069779 to P.A.S.) and an educational grant for fellowship training to Dr. Air from Medtronic Inc. Dr. Air receives consulting fees from St. Jude Medical. Drs. Larson, Ostrem and Starr receive consulting fees from Medtronic Inc., and Boston Scientific Inc., as well as research funding from MRI Interventions Inc.
Footnotes
Appendix A. Supplementary data
Supplementary data associated with this article can be found, in the online version, at http://dx.doi.org/10.1016/j.clinph.2012.04.020.
References
- Anderson TR, Hu B, Iremonger K, Kiss ZH. Selective attenuation of afferent synaptic transmission as a mechanism of thalamic deep brain stimulation-induced tremor arrest. J Neurosci. 2006;26:841–850. doi: 10.1523/JNEUROSCI.3523-05.2006. [DOI] [PMC free article] [PubMed] [Google Scholar]
- Benabid AL, Pollak P, Gao D, Hoffmann D, Limousin P, Gay E, et al. Chronic electrical stimulation of the ventralis intermedius nucleus of the thalamus as a treatment of movement disorders. J Neurosurg. 1996;84:203–214. doi: 10.3171/jns.1996.84.2.0203. [DOI] [PubMed] [Google Scholar]
- Calzetti S, Baratti M, Gresty M, Findley L. Frequency/amplitude characteristics of postural tremor of the hands in a population of patients with bilateral essential tremor: implications for the classification and mechanism of essential tremor. J Neurol Neurosurg Psychiatry. 1987;50:561–567. doi: 10.1136/jnnp.50.5.561. [DOI] [PMC free article] [PubMed] [Google Scholar]
- Crone NE, Miglioretti DL, Gordon B, Sieracki JM, Wilson MT, Uematsu S, et al. Functional mapping of human sensorimotor cortex with electrocorticographic spectral analysis. I. Alpha and beta event-related desynchronization. Brain. 1998;121:2271–2299. doi: 10.1093/brain/121.12.2271. [DOI] [PubMed] [Google Scholar]
- Crowell AL, Ryapolova-Webb ES, Ostrem JL, Galifianakis NB, Shimamoto S, Lim DL, et al. Oscillations in sensorimotor cortex in movement disorders: an electrocorticography study. Brain. 2012;135:615–639. doi: 10.1093/brain/awr332. [DOI] [PMC free article] [PubMed] [Google Scholar]
- Elble RJ. Physiologic and essential tremor. Neurology. 1986;36:225–231. doi: 10.1212/wnl.36.2.225. [DOI] [PubMed] [Google Scholar]
- Fechner J, Ihmsen H, Hatterscheid D, Jeleazcov C, Schiessl C, Vornov JJ, et al. Comparative pharmacokinetics and pharmacodynamics of the new propofol prodrug GPI 15715 and propofol emulsion. Anesthesiology. 2004;101:626–639. doi: 10.1097/00000542-200409000-00011. [DOI] [PubMed] [Google Scholar]
- Halliday DM, Conway BA, Farmer SF, Shahani U, Russell AJ, Rosenberg JR. Coherence between low-frequency activation of the motor cortex and tremor in patients with essential tremor. Lancet. 2000;355:1149–1153. doi: 10.1016/s0140-6736(00)02064-x. [DOI] [PubMed] [Google Scholar]
- Hellwig B, Haussler S, Schelter B, Lauk M, Guschlbauer B, Timmer J, et al. Tremor-correlated cortical activity in essential tremor. Lancet. 2001;357:519–523. doi: 10.1016/s0140-6736(00)04044-7. [DOI] [PubMed] [Google Scholar]
- Hellwig B, Schelter B, Guschlbauer B, Timmer J, Lucking CH. Dynamic synchronisation of central oscillators in essential tremor. Clin Neurophysiol. 2003;114:1462–1467. doi: 10.1016/s1388-2457(03)00116-0. [DOI] [PubMed] [Google Scholar]
- Kuhn AA, Kempf F, Brucke C, Gaynor Doyle L, Martinez-Torres I, Pogosyan A, et al. High-frequency stimulation of the subthalamic nucleus suppresses oscillatory beta activity in patients with Parkinson’s disease in parallel with improvement in motor performance. J Neurosci. 2008;28:6165–6173. doi: 10.1523/JNEUROSCI.0282-08.2008. [DOI] [PMC free article] [PubMed] [Google Scholar]
- Lenz FA, Kwan HC, Martin RL, Tasker RR, Dostrovsky JO, Lenz YE. Single unit analysis of the human ventral thalamic nuclear group. Tremor-related activity in functionally identified cells. Brain. 1994;117:531–543. doi: 10.1093/brain/117.3.531. [DOI] [PubMed] [Google Scholar]
- Lyons KE, Pahwa R. Deep brain stimulation and essential tremor. J Clin Neurophysiol. 2004;21:2–5. doi: 10.1097/00004691-200401000-00002. [DOI] [PubMed] [Google Scholar]
- Marsden JF, Ashby P, Limousin-Dowsey P, Rothwell JC, Brown P. Coherence between cerebellar thalamus, cortex and muscle in man: cerebellar thalamus interactions. Brain. 2000;123:1459–1470. doi: 10.1093/brain/123.7.1459. [DOI] [PubMed] [Google Scholar]
- Miller KJ, Zanos S, Fetz EE, den Nijs M, Ojemann JG. Decoupling the cortical power spectrum reveals real-time representation of individual finger movements in humans. J Neurosci. 2009;29:3132–3137. doi: 10.1523/JNEUROSCI.5506-08.2009. [DOI] [PMC free article] [PubMed] [Google Scholar]
- Papavassiliou E, Rau G, Heath S, Abosch A, Barbaro NM, Larson PS, et al. Thalamic deep brain stimulation for essential tremor: relation of lead location to outcome. Neurosurgery. 2004;54:1120–1129. doi: 10.1227/01.neu.0000119329.66931.9e. [discussion 1129-30]. [DOI] [PubMed] [Google Scholar]
- Raethjen J, Govindan RB, Kopper F, Muthuraman M, Deuschl G. Cortical involvement in the generation of essential tremor. J Neurophysiol. 2007;97:3219–3228. doi: 10.1152/jn.00477.2006. [DOI] [PubMed] [Google Scholar]
- Raz A, Eimerl D, Zaidel A, Bergman H, Israel Z. Propofol decreases neuronal population spiking activity in the subthalamic nucleus of Parkinsonian patients. Anesth Analg. 2010;111:1285–1289. doi: 10.1213/ANE.0b013e3181f565f2. [DOI] [PubMed] [Google Scholar]
- Schnitzler A, Munks C, Butz M, Timmermann L, Gross J. Synchronized brain network associated with essential tremor as revealed by magnetoencephalography. Mov Disord. 2009;24:1629–1635. doi: 10.1002/mds.22633. [DOI] [PubMed] [Google Scholar]
- Schuurman PR, Bosch DA, Bossuyt PM, Bonsel GJ, van Someren EJ, de Bie RM, et al. A comparison of continuous thalamic stimulation and thalamotomy for suppression of severe tremor. N Engl J Med. 2000;342:461–468. doi: 10.1056/NEJM200002173420703. [DOI] [PubMed] [Google Scholar]
- Shahlaie K, Larson PS, Starr PA. Intraoperative CT for DBS surgery: technique and accuracy assessment. Neurosurgery. 2011;68:114–124. doi: 10.1227/NEU.0b013e31820781bc. [DOI] [PubMed] [Google Scholar]
- Timmermann L, Gross J, Dirks M, Volkmann J, Freund HJ, Schnitzler A. The cerebral oscillatory network of parkinsonian resting tremor. Brain. 2003;126:199–212. doi: 10.1093/brain/awg022. [DOI] [PubMed] [Google Scholar]
- Wade P, Gresty MA, Findley LJ. A normative study of postural tremor of the hand. Arch Neurol. 1982;39:358–362. doi: 10.1001/archneur.1982.00510180036009. [DOI] [PubMed] [Google Scholar]
- Wingeier B, Tcheng T, Koop MM, Hill BC, Heit G, Bronte-Stewart HM. Intra-operative STN DBS attenuates the prominent beta rhythm in the STN in Parkinson’s disease. Exp Neurol. 2006;197:244–251. doi: 10.1016/j.expneurol.2005.09.016. [DOI] [PubMed] [Google Scholar]
- Yousry TA, Schmid UD, Alkadhi H, Schmidt D, Peraud A, Buettner A, et al. Localization of the motor hand area to a knob on the precentral gyrus. A new landmark. Brain. 1997;120:141–157. doi: 10.1093/brain/120.1.141. [DOI] [PubMed] [Google Scholar]
Associated Data
This section collects any data citations, data availability statements, or supplementary materials included in this article.