

Abstract
PURPOSE
We determined the association between novel and acid-labile skin collagen-linked advanced glycation endproducts (AGEs) and the progression of microvascular and neuropathic complications from baseline to near study closeout in the Diabetes Control and Complications Trial (DCCT).
METHODS
From a skin biopsy obtained near the close of the DCCT, proteolytic collagen digests were analyzed by liquid chromatography/mass spectrometry (LC/MS/MS) for glucosepane (GSPNE), glyoxal and methylglyoxal hydroimidazolones (G-H1 and MG-H1) and the glycation product fructose-lysine(FL) using isotope dilution method.
RESULTS
GSPNE and MG-H1 correlated with age and diabetes duration (p<0.02), while GSPNE and FL correlated with the history of glycemia expressed as mean A1c(p≤0.003). Age and duration-adjusted GSPNE and FL levels were lower in intensive (INT) vs. conventional (CONV) treatment subjects in the primary prevention DCCT cohort (p < 0.0001), and FL lower in INT in the secondary intervention cohort (p < 0.0001). GSPNE was associated with increased incidence of retinopathy progression (odds ratio (OR)/unit increase in GSPNE: 2.5 for 3 step progression on the ETDRS scale, p=0.003) and sustained ≥ 3 microaneurysms (MA) (OR=4.8, p<0.0001) from DCCT baseline up to the time of the biopsy, and prevalence of microalbuminuria or AER>40 mg/24 hr (OR=5.3, P<0.0001), and confirmed clinical neuropathy (OR=3.4, p=0.015) at the time of the biopsy. GSPNE adjusted for mean A1c remained significant for ≥ 3 MA (p=0.0252) and AER (p=0.0006). The strong association of complications with A1c was reduced or eliminated when adjusted for GSPNE.
CONCLUSIONS
Glucosepane is a novel AGE marker of diabetic complications that is robustly associated with nephropathic, retinopathic and neuropathic outcomes despite adjustment for A1c, suggesting that it could be one mediator of these complications with possible diagnostic implications.
Keywords: Glycemia, retinopathy, nephropathy, collagen, methylglyoxal, advanced glycation endproducts (AGEs)
Introduction
The discovery of HbA1c as a marker of cumulative glycemia over 2–3 months has greatly facilitated the design of clinical trials to probe the role of glycemia in the pathogenesis of diabetic complications. Notably, early and intensive treatment of glycemia over several years was associated with a lower progression rate of microvascular disease than conventional treatment in both type 1 and type 2 diabetes, e.g. in the Diabetes Control and Complications Trial (DCCT) and the United Kingdom Prospective Diabetes Study (UKPDS), respectively 1,2. The observed beneficial effects were sustained in observational follow-up studies of these cohorts, despite loss of the prior separation of hemoglobin A1c (A1c) between the treatment groups3,4.
While HbA1c (A1c) is a powerful measure of hyperglycemia and marker of complication risk5,6, several studies have examined the more stable advanced glycation endproducts (AGE’s) both as markers of and as contributors to the pathogenesis of diabetic complications (for a review see7). Major findings previously published revealed that skin collagen-linked AGE’s are associated with past cumulative glycemia (A1c level), severity of diabetic microvascular complications and lower tissue levels of these collagen AGEs after intensive glycemic control in the DCCT8. The AGE’s, especially fructose -lysine (FL) (measured as furosine) and carboxymethyl-lysine (CML), were also predictors of the future risk of progression of retinopathy and nephropathy in EDIC9. Similar observations were made by other groups, especially with measurement of skin autofluorescence, certain skin collagen-linked oxidation markers and various serum carbonyl and oxidant stress markers associated with diabetic complications7,10,11.
The initial results we reported were based on 4mm skin biopsies from 216 DCCT participants obtained near closeout of DCCT (1993)8. As only a limited number of chemically characterized advanced glycation endproducts were known, i.e. CML and pentosidine, two 4mm skin samples were obtained with the second stored at −80°C under argon for future assay of novel AGEs. Data reported herein was obtained from using the stored, frozen biopsy obtained in 1993.
We determined the associations of the severity of DCCT microvascular complications and other DCCT clinical parameters with glucosepane (GSPNE), the single major AGE and protein crosslink discovered to date in human skin collagen 12, as well as carboxyethyl-lysine (CEL), and the hydroimidazolones of glyoxal (G-H1) and methylglyoxal (MG-H1). Although we previously reported furosine8, which is the acid hydrolyzed product of FL, the latter is still included in the AGE panel in this paper as a way to validate the reproducibility of the enzymatic (new assay) and acid hydrolysis methods (old assay), as well as the stability of FL after 16 years of storage. In the present study we aimed to investigate whether any of the newer collagen variables are 1) associated with cumulative glycemia, 2) reduced by intensive glycemia control, 3) associated with past progression and cross-sectional severity of complications, and if so, whether this association is independent of the cumulative A1c levels during the DCCT.
Methods
Research Subjects
Two 4 mm skin punch biopsies were obtained 1–2 years prior to DCCT closeout in 1993 from 216 DCCT volunteers, 123 from the primary cohort [no retinopathy and AER < 40 mg/24 hours at baseline] and 93 from the secondary cohort [mild to moderate retinopathy and AER <200 mg/24 hours at baseline]. The biopsies were stored under argon at −80 °C. Retinopathy, AER, confirmed clinical neuropathy and A1c were assessed as previously described (1).
Chemicals
The source and preparation of isotopically labeled carboxymethyl-lysine, methylglyoxal hydroimidazolone (MG-H1), fructosyl-lysine (FL), carboxyethyl-lysine (CEL), glyoxal hydroimidazolone (G-H1) and methylglyoxal hydroimidazolone (MG-H1), and glucosepane have been described in detail 13. All other chemicals were purchased from Sigma-Aldrich (St. Louis, MO).
Processing of the skin biopsy and preparation of proteolytic collagen digest
The method for the preparation of the highly insoluble delipidated collagen fraction was previously described 8. Besides storage of the skin biopsy in dry form under argon at −80°C and working under anaerobic conditions such as flushing the collagen digest with argon, no other conditions were used to limit oxidative damage during storage. An enzymatic digest of insoluble collagen sample ~ 2 mg was prepared by sequential digestion with collagenase, peptidase, pronase, and aminopeptidase M as previously described with modifications 12. Each sample was weighed, placed in a 0.5 polypropylene micro tube (REF 72.730.006, SARSTEDT) and washed twice with 500 μl buffer H consisting of 0.1 M CaCl2, 0.02 M HEPES, pH 7.5. Insoluble material was recovered with a microcentrifuge (TOMY) run at maximum speed. The resulting pellet was digested for24 hrs at 37°C with 200 μl collagenase (56 units, C0773 Sigma) in buffer H. To each vial was added 1 μl each of toluene and chloroform as the antimicrobial agent. Vials were sealed under argon before incubation. Following incubation, the supernatant was removed and the residual pellet was re-digested for 24 hrs with 80 μl (22 units) collagenase. The supernatants were combined and further sequentially digested at 37°C at 24 hrs intervals with 10 μl (0.048 units) peptidase (P7500 Sigma), 20 μl (0.4 units) pronase (Roche) and 4 μl (0.08 units) aminopeptidase M (Roche). Collagen content was determined in the digests by the hydroxyproline assay assuming a content of 14% hydroxyproline by weight 14. The percentage collagen digestion was determined by the following formula:
Measurement of glycation products by liquid chromatography mass spectrometry (LC/MS)
Amounts of CEL, FL, G-H1, MG-H1, and GSPNE in enzymatically digested samples (see above) were measured by electrospray positive-ionization–mass spectrometric multiple reaction monitoring by using an LC/MS system composed of a 2690 separation module with a Quattro Ultima triple-quadrupole mass spectrometry detector (Waters-Micromass, Milford, MA, USA) following the previously published procedure by Ahmed and Thornalley15. After digestion, samples were filtered through 3 kDa cutoff centrifuge filters (Millipore, Bedford, MA, USA) prior to analysis. Equal amounts of protein (40 μg of collagen equivalent measured as described earlier8) were used for analysis. Analytical details are provided in the Supplemental section.
Assessment of Complications
Methods for assessment of retinopathy, nephropathy, and neuropathy were described in prior DCCT reports1. In brief, a sustained three-step progression defined as a three- or more- step worsening in final Early Treatment of Diabetic Retinopathy Scale (ETRDS) score from DCCT baseline at two consecutive visits 6 months apart was the principal retinopathy outcome event in the DCCT; the sustained presence of three or more microaneurysms (MA) was an outcome event specific to the primary prevention cohort that was free of retinopathy at DCCT enrollment. Microalbuminuria, i.e., albuminuria excretion rate (AER) >40 mg/24 h based on a four-hour urine collection, was a main renal outcome in the DCCT. Confirmed clinical neuropathy (CCN), defined as a finding of definite clinical neuropathy by a neurologist’s physical exam and history confirmed by either abnormal nerve conduction or abnormal autonomic nervous system testing at the fifth year of DCCT follow-up, was the main neuropathy outcome in the DCCT. A1c values were obtained at least quarterly on all subjects in the DCCT.
Statistical Analysis
Clinical characteristics were compared using Wilcoxon rank-sum test for quantitative or ordinal variables and Chi-square test for categorical variables. Skin collagen variables were adjusted for age and diabetes duration using residuals from a simple linear regression model. Spearman correlation was used to evaluate a monotone (possibly non-linear) relationship among skin collagen variables. To adjust for group differences, fractional ranks of the skin collagen levels were obtained separately within treatment groups, which were used to calculate Spearman correlation. Univariate linear regression models were used to determine the relationship between skin collagen variables and A1c over various times or intervals prior to the date of biopsy (DCCT screening, closest to the date of biopsy, mean A1c over the period from the DCCT randomization to the date of biopsy, and mean A1c during the year preceding the biopsy). The strength of the association was assessed by the model R2. Multivariate logistic regression models were used to assess the effect of skin collagen or A1c variables on the risk of complication outcomes in the DCCT with or without adjustment for A1c or skin collagen variables. Entropy R2 16 was used to assess the strength of association in logistic regression models. Odds ratio per unit or standard deviation increase in the skin collagen variables was reported. Backward elimination was used to select skin collagen variables nominally significant for the risk of complications at the level of 0.05. Unless otherwise noted, nominal P values were presented without adjustment for multiple tests. To adjust for multiple tests, the Benjamini and Hochberg method 17 was employed to control the false discovery rate at the 0.05 level.
RESULTS
Participant Characteristics
Table 1 recapitulates the clinical characteristics of the 216 participants at DCCT baseline and at closeout in the primary and secondary cohorts. As previously reported, the biopsy subgroups slightly differed from the non-participating DCCT cohorts (n= 1,225) in that they were older (29 vs. 27 years), had slightly higher blood pressure (116 vs. 113 mm Hg), and had a higher rate of neuropathy at baseline (12 vs. 6%) 8. At DCCT baseline subjects in the two treatment groups did not differ except that INT participants in the primary cohort were older and, in the secondary cohort, had higher screening A1c and lower systolic blood pressure than CONV participants. By design, the secondary cohort had longer diabetes duration and significantly more microvascular disease than the primary cohort. At DCCT closeout, as expected, INT participants had lower A1c and blood glucose levels than CONV participants. Retinopathy levels in the primary cohort were significantly lower among INT subjects.
Table 1.
Clinical Characteristics of DCCT Participants at DCCT Baseline and Closeout
| Primary Cohort | Secondary Cohort | |||||
|---|---|---|---|---|---|---|
|
| ||||||
| INT | CONV | P Value | INT | CONV | P Value | |
| n | 65 | 58 | 57 | 36 | ||
| DCCT Baseline | ||||||
| Age(years) | 28 ± 6 | 26 ± 7 | 0.016 | 30 ± 7 | 30 ± 6 | |
| Duration(months) | 31 ± 19 | 27 ± 14 | 108 ± 51 | 90 ± 43 | ||
| A1c(%) | 8.8 ± 1.9 | 9.1 ± 1.9 | 8.9 ± 1.5 | 8.3 ± 1.2 | 0.022 | |
| Mean blood glucose (mg/dl) | 221 ± 83 | 245 ± 85 | 237 ± 76 | 214 ± 72 | ||
| Triglycerides (mg/dl) | 79 ± 66 | 65 ± 23 | 97 ± 48 | 86 ± 56 | ||
| Cholesterol (mg/dl) | 182 ± 33 | 174 ± 32 | 181 ± 36 | 176 ± 37 | ||
| Retinopathy | ||||||
| 10/10: None | 100 | 100 | 0 | 0 | ||
| 20/≤20: Microaneurysms Only | 0 | 0 | 58 | 61 | ||
| 30/≤30: Mild NPDR | 0 | 0 | 23 | 25 | ||
| 45/≤45: Moderate NPDR | 0 | 0 | 19 | 14 | ||
| AER>40mg/24 h | 1.5 | 0.0 | 10.5 | 8.3 | ||
| Confirmed Clinical Neuropathy | 6.2 | 1.7 | 17.9 | 11.1 | ||
| sBP (mmHg) | 116 ± 10 | 114 ± 11 | 115 ± 12 | 120 ± 12 | 0.042 | |
| dBP (mmHg) | 73 ± 9 | 72 ± 9 | 73 ± 8 | 76 ± 10 | ||
| DCCT Closeout | ||||||
| Age (years) | 34 ± 6 | 31 ± 7 | 0.013 | 36 ± 7 | 36 ± 6 | |
| Duration (months) | 101 ± 31 | 94 ± 23 | 189 ± 55 | 169 ± 46 | ||
| DCCT Mean HbA1c(%) | 7.1 ± 0.8 | 9.5 ± 1.4 | <0.001 | 7.1 ± 0.8 | 8.8 ± 1.5 | <0.001 |
| Mean blood glucose (mg/dl) | 149 ± 48 | 239 ± 76 | <0.001 | 152 ± 46 | 215 ± 83 | <0.001 |
| Triglycerides (mg/dl) | 72 ± 35 | 76 ± 34 | 91 ± 57 | 78 ± 36 | ||
| Cholesterol (mg/dl) | 175 ± 31 | 178 ± 33 | 181 ± 33 | 178 ± 33 | ||
| Retinopathy | 0.005 | |||||
| 10/10: None | 58 | 36 | 4 | 3 | ||
| 20/≤20: Microaneurysms Only | 37 | 41 | 30 | 36 | ||
| 30/≤30: Mild NPDR | 2 | 19 | 44 | 36 | ||
| 45/≤45: Moderate NPDR | 3 | 3 | 23 | 25 | ||
| AER>40 mg/24 hr | 3.1 | 10.3 | 14.0 | 11.1 | ||
| Confirmed Clinical Neuropathy | 2.3 | 4.8 | 12.7 | 17.1 | ||
| sBP (mmHg) | 115 ± 9 | 115 ± 11 | 118 ± 9 | 121 ± 14 | ||
| dBP (mmHg) | 75 ± 9 | 74 ± 8 | 77 ± 8 | 77 ± 11 | ||
Age, diabetes duration, and collagen variables
Table 2 presents the Spearman correlations coefficients between attained age and diabetes duration at the time of the skin biopsy, near DCCT closeout, and the skin collagen AGE levels, as well as correlations among the age- and duration- adjusted collagen variables. Three of the five markers were correlated with age, i.e. the hydroimidazolones G-H1 and MG-H1, and GSPNE (R = 0.17–0.46, each P≤0.01). Two markers (MG-H1 and GSPNE) were correlated with diabetes duration (R = 0.16–0.51, each P<0.02). The correlation among age- and duration- adjusted collagen variables ranged from R = 0.07 to 0.61. GSPNE particularly stands out as having the highest correlation with age (0.46), diabetes duration (0.51), MG-H1 (0.44), and fructose-lysine (0.48).
Table 2.
Spearman Correlation among Age- and Diabetes Duration-adjusted Skin Collagen Levels, and of the unadjusted Skin Collagen Levels with Age and Diabetes Duration
| Age (years) | Diabetes Duration (months) | FL | CEL | GH1 | MG-H1 | |
|---|---|---|---|---|---|---|
| FL | 0.002 (NS) | −0.004 (NS) | -- | |||
| CEL | 0.054 (NS) | 0.002 (NS) | 0.149 (0.0288) | -- | ||
| GH1 | 0.171 (0.0121) | 0.110 (NS) | −0.03 (NS) | −0.572 (<.0001) | -- | |
| MG-H1 | 0.344 (<.0001) | 0.162 (0.0171) | 0.276 (<.0001) | 0.399 (<.0001) | −0.293 (<.0001) | -- |
| GSPNE | 0.458 (<.0001) | 0.5078 (<.0001) | 0.478 (<.0001) | 0.118 (NS) | 0.073 (NS) | 0.440 (<.0001) |
#Skin collagen variables used are the original levels in calculation of correlations with age and diabetes duration, and age- and duration-adjusted levels in calculating correlations among the collagen variables.
A1c/intensive glycemia treatment vs. collagen variables
Table 3 describes the association of the HbA1c at different times or intervals with the subsequent collagen AGE levels. Among the 4 new AGEs, GSPNE is significantly associated with A1c measures taken at various time points relative to the skin biopsy dates. In contrast to FL, whose association with A1c tended to weaken beyond one year of cumulative glycemia as previously reported for furosine8, this association for GSPNE tended to become stronger over the entire DCCT duration. Nevertheless, the strongest R2 values were still noted for FL, as previously also reported for furosine.
Table 3.
Univariate Regression Models of Age- and Duration-Adjusted Skin Collagen Variables versus HbA1c at different times
| Model R2 (%) | P-value * | |
|---|---|---|
| GSPNE | ||
| Mean HbA1c up to biopsy | 23.5 | <.0001† |
| Mean HbA1c over the past year | 22.4 | <.0001† |
| HbA1c nearest to biopsy | 22.7 | <.0001† |
| Screening HbA1c | 6.6 | 0.0001† |
| CEL | ||
| Mean HbA1c up to biopsy | 0.2 | NS |
| Mean HbA1c over the past year | 0.3 | NS |
| HbA1c nearest to biopsy | 0.1 | NS |
| Screening HbA1c | 0.2 | NS |
| G-H1 | ||
| Mean HbA1c up to biopsy | 0.1 | NS |
| Mean HbA1c over the past year | 1.1 | NS |
| HbA1c nearest to biopsy | 0.1 | NS |
| Screening HbA1c | 1.3 | NS |
| MG-H1 | ||
| Mean HbA1c up to biopsy | 0.4 | NS |
| Mean HbA1c over the past year | 0.0 | NS |
| HbA1c nearest to biopsy | 0.1 | NS |
| Screening HbA1c | 0.8 | NS |
| FL | ||
| Mean HbA1c up to biopsy | 36.8 | <.0001† |
| Mean HbA1c over the past year | 47.6 | <.0001† |
| HbA1c nearest to biopsy | 45.9 | <.0001† |
| Screening HbA1c | 4.1 | 0.003† |
Raw P values from linear regression models are reported.
P<0.05 after false discovery rate adjustment for multiple testing.
Likewise, in Figure 1, of the 4 new AGEs, GSPNE was 21% lower with intensive treatment in the primary cohort (INT 2.24 vs. CONV 2.82, P<.0001). However, the decrease in the secondary cohort was not statistically significant (2.51 vs. 2.75, P=0.07). Compared to the age-matched non-diabetic control cohort previously described8, DCCT INT and CONV participants had significantly higher levels of FL, GSPNE, CEL, and G-H1 (each p<.0001). Figure 1 also confirms our previous findings for furosine, that INT was associated with significantly lower FL in the primary (INT: 4.36, CONV: 6.48) and the secondary (4.8 vs. 6.71) cohort (each P<.0001).
Figure 1.

Effect of intensive glycemic control on skin collagen levels of glycation products by primary, secondary cohort and overall, grouped according to source of precursor carbonyl compound. Grey bar: non-diabetic controls, black bar: DCCT intensive treatment group, white bar: DCCT standard treatment group. All the asterisks in Fig. 1 indicate P < 0.0001.
Complication vs. collagen variables
Table 4 presents the relationship of significant AGEs with various microvascular complications in the DCCT. GSPNE was strongly associated with all of the reported microvascular complications. Particularly, an increase of one nmol/mg in GSPNE was associated with a 2.47 fold increase (p=0.0028) in the incidence of sustained 3-step retinopathy progression from the DCCT baseline up to the time of the skin biopsy, a 4.83 fold increase in the incidence of sustained ≥ 3 microaneurysms (MA) (p<.0001) in DCCT in the primary cohort, a 5.31 fold increase in the prevalence of AER > 40mg/24hrclosest to biopsy (p<.0001) and a 3.42 fold increase in the prevalence of confirmed clinical neuropathy (p=0.015) (Table 4, Figure 2). The association with sustained ≥ 3 MA in DCCT and AER >40 mg/24 hr remained significant after adjustment for mean DCCT A1c. The reverse analysis, asking whether adjustment for AGE impacted the association between mean DCCT A1c and complications, revealed that the A1c lost association with AER and confirmed clinical neuropathy if adjusted for GSPNE (each P > 0.22).
Table 4.
Logistic Regression Models of Complications with Significant Age- and Duration-Adjusted Skin Collagen Effects With and Without Adjustment for DCCT mean HbA1c up to the Biopsy and Vice Versa
| AGE | Outcome $ | N | Event N | AGE # Not Adjusted for HbA1c | AGE # Adjusted for HbA1c | Unadjusted DCCT Mean HbA1c# | Adjusted DCCT Mean HbA1c# | ||||||
|---|---|---|---|---|---|---|---|---|---|---|---|---|---|
| Odds Ratio * | ENTROPY R2 | P- value^ | Odds Ratio * | ENTROPY R2 | P- value ^ | ENTROPY R2 | P- Value ^ | ENTROPY R2 | P- Value^ | ||||
| GSPNE | |||||||||||||
| Sustained 3-step progression in DCCT | 216 | 25 | 2.47 (1.36, 4.48) | 5.8 | 0.003 | 1.81 (0.91, 3.58) | 1.8 | 0.096 | 6.7 | 0.001 | 2.7 | 0.041 | |
| Sustained >=3 MA in DCCT (primary cohort) | 123 | 31 | 4.83 (2.25,10.37) | 15.1 | <.0001 | 2.70 (1.09, 6.65) | 3.6 | 0.025 | 14.9 | <.0001 | 3.4 | 0.029 | |
| AER closest to biopsy > 40 mg/24hr | 206 | 15 | 5.31 (2.35,12.0) | 18.1 | <.0001 | 4.35 (1.83,10.32) | 11.0 | 0.001 | 8.3 | 0.003 | 1.2 | 0.25 | |
| Confirmed clinical neuropathy at DCCT Year 5 | 160 | 8 | 3.42 (1.27, 9.18) | 9.3 | 0.015 | 2.29 (0.70, 7.44) | 3.0 | 0.17 | 8.7 | 0.019 | 2.3 | 0.226 | |
| FL | 0.041 | ||||||||||||
| Sustained >=3 MA in DCCT (primary cohort Only) | 123 | 31 | 1.23 (1.03,1.46) | 3.8 | 0.022 | 0.95 (0.76,1.19) | 0.7 | 0.14 | 14.9 | <.0001 | 11.2 | <.0001 | |
| AER closest to biopsy > 40 mg/24hr | 206 | 15 | 1.54 (1.24,1.90) | 15.1 | <.0001 | 1.44 (1.11, 1.88) | 7.4 | 0.005 | 8.3 | 0.003 | 0.6 | 0.42 | |
| Confirmed clinical neuropathy at DCCT Year 5 | 160 | 8 | 1.31 (1.00, 1.70) | 5.6 | 0.046 | 1.11 (0.79, 1.56) | 0.6 | 0.54 | 8.7 | 0.017 | 3.7 | 0.125 | |
Unadjusted models are from univariate logistic regression with the respective AGE or DCCT mean HbA1c up to the biopsy time as the risk factor. Adjusted models are from logistic regressions with both as risk factors. Outcomes assessed include sustained 3-step progression in DCCT, sustained ≥ 3 MA in DCCT, AER closest to biopsy > 40 mg/24hr, and confirmed clinical neuropathy at DCCT Year 5.
Analysis is limited to those with no respective complication at DCCT baseline (excluding 10 subjects with AER>40, 19 with confirmed clinical neuropathy, and the secondary cohort for sustained >=3 MA).
Odds ratio is calculated based on 1 unit increase for Fru-Lys and GSPNE. Values in parenthesis indicate 95% confidence interval.
Entropy R2 is calculated as the ratio of chi square from a likelihood ratio test and -2 log transformed likelihood from the null model with intercept only.
P value is from the Likelihood Ratio test (LRT) between the respective reduced and full model
Figure 2.

Glucosepane levels (nmol per mg. collagen) as a function of risk of developing microvascular complications in DCCT. Odds ratios and p values are from Table 4
As previously reported for furosine, FL was strongly associated with sustained ≥ 3MA in the DCCT primary cohort (p=0.022), microalbuminuria (p<0.0001), and CCN (p=0.046). For microalbuminuria, this association remained significant even after adjustment for DCCT mean A1c (p=.005). In contrast, A1c lost significance for microalbuminuria and CCN when adjusted for FL (P>.13), though it remained significant for sustained ≥ 3MA (P<.0001).
Table 5 further identifies which skin collagen variables are most correlated with complications, and whether any single, or subgroup of collagen variables could serve as a surrogate for the complete set of five. Backward elimination revealed that GSPNE was consistently selected for all of the complications, individually for sustained retinopathy progression, sustained ≥ 3 MA, and confirmed clinical neuropathy (each P<0.02), and jointly with GH1 and MGH1 for microalbuminuria (P<.0001).
Table 5.
Selected Collagen Variables Associated with Complications from among GSPNE, CEL, G-H1, MG-H1, and FL
| Outcome$ | Selected AGE^ | Df | R2 (%)* | P# |
|---|---|---|---|---|
| Retinopathy | ||||
| Sustained >=3 step progression in DCCT | GSPNE | 1 | 5.8 | 0.003 |
| Sustained >=3 microaneurysms in DCCT(primary cohort only) | GSPNE | 1 | 15.1 | <.0001 |
| Renal: | ||||
| AER closest to Biopsy>40 mg/24h | G-H1, MG-H1, GSPNE | 3 | 30.3 | <.0001 |
| Neuropathy: | ||||
| Confirmed clinical neuropathy at DCCT Year 5 | GSPNE | 1 | 9.3 | 0.015 |
Analysis is limited to those with no respective complication at DCCT baseline (excluding 10 subjects with AER>40, 19 with confirmed clinical neuropathy, and the secondary cohort for sustained >=3 MA).
Backward selection is used to select the AGEs variables. Nominal level of 0.05 is used as the significance level to stay.
Entropy R2 is calculated as the ratio of chi square from a likelihood ratio test and -2 log transformed likelihood from the null model with intercept only.
P value is from Likelihood Ratio test (LRT) between the respective reduced and full model. In the backward elimination, the reported LRT p value is subject to data-dependent selection bias (Freedman 1983).
Further analyses examined the order of individual strength of association (entropy R2) with complications among all collagen markers, both previously and newly determined. For sustained 3 step progression, the order of strength is CML>GSPNE>acid soluble collagen>FL>furosine>pentosidine>fluorescence (each P<.05). For sustained greater than or equal to 3 MA: GSPNE>CML>pentosidine>furosine>FL (each P<.05). For Nephropathy: GSPNE>furosine>FL >CML> pentosidine>fluorescence (each P<.05). And for Neuropathy: fluorescence>furosine>pentosidine>GSPNE>FL(each P<.05).
Discussion
Overwhelming evidence implicates chronic hyperglycemia as a major risk factor for the progression of microvascular and macrovascular disease in both type 1 and type 2 diabetes. A1c, as a measure of chronic hyperglycemia, emerged as a powerful glycemic marker of progression of micro- and macrovascular disease in multiple studies18–22. The fact that complications still progress in some individuals in spite of years of intensive glycemic control has stimulated the search for alternative markers of complication risk. Several years ago we proposed that determination of AGEs in skin collagen, whose half-life is 15 years 23(and perhaps even greater in diabetes), might represent a better pathogenetic possible risk factor than A1c, which reflects mean glycemia only over the prior 2–3 months. We previously showed that skin collagen insolubility, level of fluorescent products, CML and pentosidine were reduced with intensive glycemic control and were correlated with severity of retinopathy, and/or nephropathy and/or neuropathy8 in the DCCT. Other groups made similar observations for skin collagen-linked AGEs24,25,26. In particular, a study using DCCT skin specimens also revealed that the oxidized collagen measured as methionine sulfoxide and other AGEs correlated with micro- and macrovascular events 11. Thus, what new information does the determination of GSPNE crosslinks, methylglyoxal and glyoxal hydroimidazolones, and carboxyethyl-lysine, provide in the context of this former DCCT skin biopsy ancillary study?
First and foremost, similar to FL, GSPNE was strongly associated with past cumulative glycemia. However, in contrast from FL, this association for GSPNE tended to become stronger over the entire DCCT duration rather than weakened beyond one year of cumulative glycemia as seen in FL. The partial reversibility of FL or its transformation into CML may explain why the R2 value was somewhat weaker for the entire DCCT A1c (36.8) than A1c in the year preceding skin biopsy (47.6).
Among the four new markers, GSPNE stands out as most robustly associated with microvascular disease; the association remained significant for retinopathy and microalbuminuria with or without adjustment for mean DCCT A1c (Table 4). Furthermore, the R2 values for associations with retinopathy and AER were generally higher than those for FL. This may not be surprising, as GSPNE is much more stable than FL from which it is derived.
Most interestingly, when we examined the order of individual strength of association with complications among all collagen markers, both previously and newly determined, GSPNE still stood out as having the strongest association with retinopathy and nephropathy. Other important collagen markers are CML for retinopathy and Furosine/FL for nephropathy. For neuropathy, although significant, the newly determined collagens (GSPNE and FL) did not have as strong associations as the previously determined markers (Fluorescence, furosine and pentosidine). The association of CML/GSPNE implies a mixed role of hyperglycemia mediated matrix crosslinking together with glycoxidation (CML) as a risk factor for retinopathy 9. The practical relevance of this analysis suggests that if one had to choose among AGEs as complications markers, only four of them would be needed, i.e. GSPNE, CML, furosine or FL and collagen-linked fluorescence at 370/440 nm). The lack of expected complete identity between furosine and FL data probably reflects methodological differences in the yields of these compounds during isolation from collagen.
Currently, there is little available information on GSPNE since its discovery by Lederer and colleagues 27. Its postulated mechanism of formation, shown in Fig. 3, implies a non-oxidative reaction initiated by FL reacting with an arginine residue via a so-called dideoxyglucosone intermediate. Very recently, an alternative, highly complex mechanism initiated by methylglyoxal, and followed by glyceraldehyde addition, was proposed based on computational calculations 28. However, the role of this mechanism for GSPNE formation in diabetes is questionable since we were unable to find mass spectrometric evidence for in vivo formation of triosidines (unpublished data), i.e. known AGEs from glyceraldehyde 29. Kinetic studies in our laboratory showed that GSPNE formed much more rapidly than the two other known glucose-derived crosslinks--GLUCOLD and crossline 30, and that these latter crosslinks were not detectable by LC/MS in biological tissues, questioning their in vivo significance. In addition, proteomics studies showed that GSPNE could form in proteins only when arginine residues were at a distance of less than 7Å.40
Figure 3.
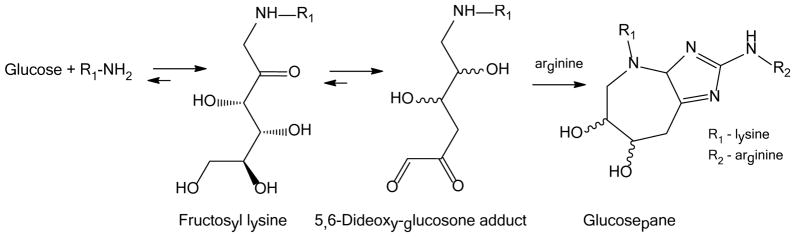
Mechanism of glucosepane formation
While considerable work remains to be performed on the full biological effects of GSPNE, its formation in diabetes is expected to be highly deleterious because it is the single major AGE and extracellular matrix (ECM) protein crosslink discovered to date31. First, it is expected to dramatically decrease the turnover rate of the modified ECM and contribute to basement membrane thickening in diabetes, 32 decreasing the tissue repair rate, as observed in diabetic nephropathy 33. Second its predilection for arginine residues and competition with sites of glyoxal and methylglyoxal dimer imidazole crosslink (GODIC and MODIC, respectively) formation34 might block arginine residues that are critical for integrin attachment to Arg -Gly-Asp (RGD) or GFOGER (whereby O stands for hydroxyproline) peptide sequences in basement membranes 35. This may favor anoikis and impair the attachment of endothelial progenitor cells on the denuded retinal vascular ECM 36.
Based on other studies that showed a two-fold increase in diabetic rat aorta MG-H135, that the methylglyoxal derived MG-H1 was not increased by diabetes was surprising, though its levels correlated with diabetes duration and age (Table 2). Similarly, there was no reduction of MG-H1 by improved glycemic control. These data, together with the recent demonstration that only three out of 23 skin collagen specimens from diabetic donors had elevated MG-H1 levels 31 suggests that tissue-bound methylglyoxal levels are sporadically elevated in diabetic humans, although serum and LDL-bound levels clearly are elevated by diabetes 37,38. Similarly to MG-H1, CEL was not reduced by glycemic control, although it was elevated by diabetes (Fig. 1). CEL can also form from methylglyoxal and levels correlated with MG-H1 (Table 2). Moreover, CEL is also an advanced lipoxidation product39.
Three of the 4 new AGEs, i.e. CEL, G-H1 and MG-H1, unexpectedly failed to reflect past glycemia. While acid hydrolysis would have destroyed GSPNE, it is possible that better correlations would have been obtained for these AGEs if acid hydrolysis had been used instead of enzymatic digestion. Also unexpected in this analysis was that some of the AGEs were negatively associated with each other. We attribute this in part to competition for the same formation site e.g. CEL or MG-H1 and G-H112, and the use of the efficient enzymatic (compared to acid) hydrolysis method8 that is needed in order to release GSPNE in intact form.
While our new data is presented as a cross-sectional analysis, a major aspect of this study is that microvascular and neuropathic complication outcomes being reported are not simply prevalence data. In each case, the data are measurements of progression of each complication from its measured DCCT baseline status up to that of the time of the biopsy (or nearest assessment). This is especially important for the participants in the primary prevention cohort who had no detectable retinopathy, virtually no nephropathy and very little neuropathy at baseline. This made it possible to study such outcomes as development of > 3 microaneurysms and demonstrate its association with tissue GSPNE levels, independent of preceding A1c. As a potential limitation in this study, the subjects volunteered for skin biopsies and therefore may not fully represent the entire DCCT cohort. However, the associations between GSPNE and microvascular complications remained the same when analyzed separately in the intensive and conventional treatment groups while GSPNE levels were lower in those who had been treated intensively compared to levels in those treated conventionally.
We do not address here the many studies that showed associations between serum or plasma AGEs and diabetic complications, some of which were previously reviewed by us 7. However, several studies in recent years have demonstrated a strong relationship between skin fluorescence, non-invasively determined by the AGE Reader, and the severity of micro- and macrovascular disease in Type 1 and 2 diabetes,10,40 though not with retinopathy (39). While glucosepane itself is not fluorescent, studies will be needed to define the correlation between serum and tissue bound AGEs and their roles as long-term predictors of complications.
In summary, this study revealed that skin collagen GSPNE, a glucose derived AGE, has the strongest association with past progression and prevalent severity of microvascular complications in type 1 diabetes to date, reinforcing the notion that high glucose levels per se lead to deleterious consequences in the pathogenesis of diabetic complications Furthermore, GSPNE has the potential to be one of the downstream mediators of hyperglycemic tissue damage, as shown by its association with, independent of A1c progression of complications. If so, therapy with a blocker of GSPNE formation might be efficacious in type 1 diabetes patients who remain hyperglycemic despite insulin treatment.
Acknowledgments
A complete list of the members of the DCCT/EDIC Research Group is provided in the supplementary appendix published in New England Journal of Medicine, 2011; 365:2366-76. A list of the participating radiologists and technologists is shown in the online supplemental material published in Circulation, 2011: 124(16):1737-1746. Industry contributors have had no role in the conduct of EDIC, but have offered free or discounted supplies or equipment as a thank you to participants: Abbott, Animas, Aventis, Bayer, Becton Dickinson, Can Am, Eli Lilly, Lifescan, Medtronic Diabetes, Minimed, Omron, Omnipod, Roche, and Sanofi Aventis.
Funding
We thank the Juvenile Diabetes Foundation International (grant# 17-2010-318 to V.M.M.) and the NIDDK (DK-79432 to D.R.S.) for support. The DCCT/EDIC project is supported by contracts with the Division of Diabetes, Endocrinology and Metabolic Diseases of the National Institute of Diabetes and Digestive and Kidney Diseases, National Eye Institute, National Institute of Neurological Disorders and Stroke, the General Clinical Research Centers Program and the Clinical and Translation Science Centers Program, National Center for Research Resources, and by Genentech through a Cooperative Research and Development Agreement with the National Institute of Diabetes and Digestive and Kidney Diseases.
Abbreviations
- AGE
Advanced Glycation Endproduct
- DCCT
Diabetes Control and Complications Trial
- EDIC
Epidemiology of Diabetes Interventions and Complications
- G-H1
Glyoxal Hydroimidazolone-1
- GSPN
Glucosepane
- MG-H1
Methylglyoxal hydroimidazolone-1
- UKPDS
United Kingdom Prospective Diabetes Study
Footnotes
Duality of Interest All authors have completed the Unified Competing Interest form at www.icmje.org/coi_disclosure.pdf (available on request from the corresponding author). V. Monnier is a paid consultant for L’Oreal. All other authors declare no competing interest.
Contribution statement VMM, SG, WS, DRS and CMS designed the study protocol and experimental design, VMM, SG, WS, DRS, and CMS performed literature reviews. WS, PAC JML designed the statistical analysis. WS performed the analysis. All authors provided support in the interpretation of results. VMM and SG performed the main writing of the ms. and all authors reviewed the manuscript.
Publisher's Disclaimer: This is a PDF file of an unedited manuscript that has been accepted for publication. As a service to our customers we are providing this early version of the manuscript. The manuscript will undergo copyediting, typesetting, and review of the resulting proof before it is published in its final citable form. Please note that during the production process errors may be discovered which could affect the content, and all legal disclaimers that apply to the journal pertain.
References
- 1.The DCCT Research Group. The effect of intensive treatment of diabetes on the development and progression of long-term complications in insulin-dependent diabetes mellitus. The Diabetes Control and Complications Trial Research Group. N Engl J Med. 1993;329:977–86. doi: 10.1056/NEJM199309303291401. [DOI] [PubMed] [Google Scholar]
- 2.UKPDS 33. Intensive blood-glucose control with sulphonylureas or insulin compared with conventional treatment and risk of complications in patients with type 2 diabetes (UKPDS 33). UK Prospective Diabetes Study (UKPDS) Group. Lancet. 1998;352:837–53. [PubMed] [Google Scholar]
- 3.White NH, Sun W, Cleary PA, et al. Effect of prior intensive therapy in type 1 diabetes on 10-year progression of retinopathy in the DCCT/EDIC: comparison of adults and adolescents. Diabetes. 2010;59:1244–53. doi: 10.2337/db09-1216. [DOI] [PMC free article] [PubMed] [Google Scholar]
- 4.Writing Team for the DDCT-EDIC. Sustained effect of intensive treatment of type 1 diabetes mellitus on development and progression of diabetic nephropathy: the Epidemiology of Diabetes Interventions and Complications (EDIC) study. JAMA. 2003;290:2159–67. doi: 10.1001/jama.290.16.2159. [DOI] [PMC free article] [PubMed] [Google Scholar]
- 5.Selvin E, Steffes MW, Gregg E, Brancati FL, Coresh J. Performance of A1C for the classification and prediction of diabetes. Diabetes Care. 2011;34:84–9. doi: 10.2337/dc10-1235. [DOI] [PMC free article] [PubMed] [Google Scholar]
- 6.Waden J, Forsblom C, Thorn LM, Gordin D, Saraheimo M, Groop PH. A1C variability predicts incident cardiovascular events, microalbuminuria, and overt diabetic nephropathy in patients with type 1 diabetes. Diabetes. 2009;58:2649–55. doi: 10.2337/db09-0693. [DOI] [PMC free article] [PubMed] [Google Scholar]
- 7.Monnier VM, Sell DR, Genuth S. Glycation products as markers and predictors of the progression of diabetic complications. Ann N Y Acad Sci. 2005;1043:567–81. doi: 10.1196/annals.1333.065. [DOI] [PubMed] [Google Scholar]
- 8.Monnier VM, Bautista O, Kenny D, et al. Skin collagen glycation, glycoxidation, and crosslinking are lower in subjects with long-term intensive versus conventional therapy of type 1 diabetes: relevance of glycated collagen products versus HbA1c as markers of diabetic complications. DCCT Skin Collagen Ancillary Study Group. Diabetes Control and Complications Trial. Diabetes. 1999;48:870–80. doi: 10.2337/diabetes.48.4.870. [DOI] [PMC free article] [PubMed] [Google Scholar]
- 9.Genuth S, Sun W, Cleary P, et al. Glycation and carboxymethyllysine levels in skin collagen predict the risk of future 10-year progression of diabetic retinopathy and nephropathy in the diabetes control and complications trial and epidemiology of diabetes interventions and complications participants with type 1 diabetes. Diabetes. 2005;54:3103–11. doi: 10.2337/diabetes.54.11.3103. [DOI] [PMC free article] [PubMed] [Google Scholar]
- 10.Gerrits EG, Lutgers HL, Kleefstra N, et al. Skin autofluorescence: a tool to identify type 2 diabetic patients at risk for developing microvascular complications. Diabetes Care. 2008;31:517–21. doi: 10.2337/dc07-1755. [DOI] [PubMed] [Google Scholar]
- 11.Yu Y, Thorpe SR, Jenkins AJ, et al. Advanced glycation end-products and methionine sulphoxide in skin collagen of patients with type 1 diabetes. Diabetologia. 2006;49:2488–98. doi: 10.1007/s00125-006-0355-8. [DOI] [PubMed] [Google Scholar]
- 12.Sell DR, Biemel KM, Reihl O, Lederer MO, Strauch CM, Monnier VM. Glucosepane is a major protein cross-link of the senescent human extracellular matrix. Relationship with diabetes. J Biol Chem. 2005;280:12310–5. doi: 10.1074/jbc.M500733200. [DOI] [PubMed] [Google Scholar]
- 13.Fan X, Zhang J, Theves M, et al. Mechanism of lysine oxidation in human lens crystallins during aging and in diabetes. J Biol Chem. 2009 doi: 10.1074/jbc.M109.032094. [DOI] [PMC free article] [PubMed] [Google Scholar]
- 14.Hamlin CR, Kohn RR. Evidence for progressive, age-related structural changes in post-mature human collagen. Biochim Biophys Acta. 1971;236:458–67. doi: 10.1016/0005-2795(71)90226-1. [DOI] [PubMed] [Google Scholar]
- 15.Thornalley PJ, Battah S, Ahmed N, et al. Quantitative screening of advanced glycation endproducts in cellular and extracellular proteins by tandem mass spectrometry. Biochem J. 2003;375:581–92. doi: 10.1042/BJ20030763. [DOI] [PMC free article] [PubMed] [Google Scholar]
- 16.Efron B. Regression and ANOVA with zero-one data: measures of residual variation. Journal of the American Statistical Association. 1978;73:113–21. [Google Scholar]
- 17.Benjamini Y, Hochberg Y. Controlling the false discovery rate: a practical and powerful approach to multiple testing. Journal of the Royal Statistical Society, Series B. 1995;54:289–300. [Google Scholar]
- 18.Janka HU, Warram JH, Rand LI, Krolewski AS. Risk factors for progression of background retinopathy in long-standing IDDM. Diabetes. 1989;38:460–4. doi: 10.2337/diab.38.4.460. [DOI] [PubMed] [Google Scholar]
- 19.Davis MD. Diabetic retinopathy. A clinical overview. Diabetes Care. 1992;15:1844–74. doi: 10.2337/diacare.15.12.1844. [DOI] [PubMed] [Google Scholar]
- 20.Genuth SM. The case for blood glucose control. Adv Intern Med. 1995;40:573–623. [PubMed] [Google Scholar]
- 21.The DCCT Research Group. The relationship of glycemic exposure (HbA1c) to the risk of development and progression in the Diabetes Control and Complications Trial. Diabetes. 1995;44:978–83. [PubMed] [Google Scholar]
- 22.Stratton IM, Adler AI, Neil HA, et al. Association of glycaemia with macrovascular and microvascular complications of type 2 diabetes (UKPDS 35): prospective observational study. BMJ. 2000;321:405–12. doi: 10.1136/bmj.321.7258.405. [DOI] [PMC free article] [PubMed] [Google Scholar]
- 23.Verzijl N, DeGroot J, Thorpe SR, et al. Effect of collagen turnover on the accumulation of advanced glycation end products. J Biol Chem. 2000;275:39027–31. doi: 10.1074/jbc.M006700200. [DOI] [PubMed] [Google Scholar]
- 24.Beisswenger PJ, Makita Z, Curphey TJ, et al. Formation of immunochemical advanced glycosylation end products precedes and correlates with early manifestations of renal and retinal disease in diabetes. Diabetes. 1995;44:824–9. doi: 10.2337/diab.44.7.824. [DOI] [PubMed] [Google Scholar]
- 25.Lyons TJ, Bailie KE, Dyer DG, Dunn JA, Baynes JW. Decrease in skin collagen glycation with improved glycemic control in patients with insulin-dependent diabetes mellitus. J Clin Invest. 1991;87:1910–5. doi: 10.1172/JCI115216. [DOI] [PMC free article] [PubMed] [Google Scholar]
- 26.McCance DR, Dyer DG, Dunn JA, et al. Maillard reaction products and their relation to complications in insulin-dependent diabetes mellitus. J Clin Invest. 1993;91:2470–8. doi: 10.1172/JCI116482. [DOI] [PMC free article] [PubMed] [Google Scholar]
- 27.Lederer MO, Buhler HP. Cross-linking of proteins by Maillard processes--characterization and detection of a lysine-arginine cross-link derived from D-glucose. Bioorg Med Chem. 1999;7:1081–8. doi: 10.1016/s0968-0896(99)00040-1. [DOI] [PubMed] [Google Scholar]
- 28.Nasiri R, Zahedi M, Jamet H, Moosavi-Movahedi AA. Theoretical studies on models of lysine-arginine cross-links derived from alpha-oxoaldehydes: a new mechanism for glucosepane formation. J Mol Model. 2011 doi: 10.1007/s00894-011-1161-x. [DOI] [PubMed] [Google Scholar]
- 29.Tessier FJ, Monnier VM, Sayre LM, Kornfield JA. Triosidines: novel Maillard reaction products and cross-links from the reaction of triose sugars with lysine and arginine residues. Biochem J. 2003;369:705–19. doi: 10.1042/BJ20020668. [DOI] [PMC free article] [PubMed] [Google Scholar]
- 30.Nemet I, Strauch CM, Monnier VM. Favored and disfavored pathways of protein crosslinking by glucose: glucose lysine dimer (GLUCOLD) and crossline versus glucosepane. Amino Acids. 2011;40:167–81. doi: 10.1007/s00726-010-0631-2. [DOI] [PMC free article] [PubMed] [Google Scholar]
- 31.Fan X, Sell DR, Zhang J, et al. Anaerobic vs aerobic pathways of carbonyl and oxidant stress in human lens and skin during aging and in diabetes: A comparative analysis. Free Radic Biol Med. 2010;49:847–56. doi: 10.1016/j.freeradbiomed.2010.06.003. [DOI] [PMC free article] [PubMed] [Google Scholar]
- 32.Kilo C, Vogler N, Williamson JR. Muscle capillary basement membrane changes related to aging and to diabetes mellitus. Diabetes. 1972;21:881–905. doi: 10.2337/diab.21.8.881. [DOI] [PubMed] [Google Scholar]
- 33.Fioretto P, Sutherland DE, Najafian B, Mauer M. Remodeling of renal interstitial and tubular lesions in pancreas transplant recipients. Kidney Int. 2006;69:907–12. doi: 10.1038/sj.ki.5000153. [DOI] [PubMed] [Google Scholar]
- 34.Mustata GT, Rosca M, Biemel KM, et al. Paradoxical effects of green tea (camellia sinensis) and antioxidant vitamins in diabetic rats: improved retinopathy and renal mitochondrial defects but deterioration of collagen matrix glycoxidation and cross-linking. Diabetes. 2005;54:517–26. doi: 10.2337/diabetes.54.2.517. [DOI] [PubMed] [Google Scholar]
- 35.Dobler D, Ahmed N, Song L, Eboigbodin KE, Thornalley PJ. Increased dicarbonyl metabolism in endothelial cells in hyperglycemia induces anoikis and impairs angiogenesis by RGD and GFOGER motif modification. Diabetes. 2006;55:1961–9. doi: 10.2337/db05-1634. [DOI] [PubMed] [Google Scholar]
- 36.Bhatwadekar AD, Glenn JV, Li G, Curtis TM, Gardiner TA, Stitt AW. Advanced glycation of fibronectin impairs vascular repair by endothelial progenitor cells: implications for vasodegeneration in diabetic retinopathy. Invest Ophthalmol Vis Sci. 2008;49:1232–41. doi: 10.1167/iovs.07-1015. [DOI] [PubMed] [Google Scholar]
- 37.Kilhovd BK, Berg TJ, Birkeland KI, Thorsby P, Hanssen KF. Serum levels of advanced glycation end products are increased in patients with type 2 diabetes and coronary heart disease. Diabetes Care. 1999;22:1543–8. doi: 10.2337/diacare.22.9.1543. [DOI] [PubMed] [Google Scholar]
- 38.Rabbani N, Chittari MV, Bodmer CW, Zehnder D, Ceriello A, Thornalley PJ. Increased glycation and oxidative damage to apolipoprotein B100 of LDL cholesterol in patients with type 2 diabetes and effect of metformin. Diabetes. 2010;59:1038–45. doi: 10.2337/db09-1455. [DOI] [PMC free article] [PubMed] [Google Scholar]
- 39.Januszewski AS, Alderson NL, Metz TO, Thorpe SR, Baynes JW. Role of lipids in chemical modification of proteins and development of complications in diabetes. Biochem Soc Trans. 2003;31:1413–6. doi: 10.1042/bst0311413. [DOI] [PubMed] [Google Scholar]
- 40.Mulder DJ, Water TV, Lutgers HL, et al. Skin autofluorescence, a novel marker for glycemic and oxidative stress-derived advanced glycation endproducts: an overview of current clinical studies, evidence, and limitations. Diabetes Technol Ther. 2006;8:523–35. doi: 10.1089/dia.2006.8.523. [DOI] [PubMed] [Google Scholar]