

Abstract
Bacterial receptors typically contain modular architectures with distinct functional domains that combine to send signals in response to stimuli. Although the properties of individual components have been investigated in many contexts, there is little information about how diverse sets of modules work together in full-length receptors. Here we investigate the architecture of Aer2, a soluble gas-sensing receptor that has emerged as a model for PAS and poly-HAMP domain signaling. The crystal structure of the heme-binding PAS domain in the ferric, ligand-free form, in comparison to the previously determined cyanide-bound state, identifies conformational changes induced by ligand binding that are likely essential for the signaling mechanism. Heme-pocket alternations share some similarities with the heme-based PAS sensors FixL and EcDOS, but propagate to the Iβ-strand in a manner predicted to alter PAS-PAS associations and the downstream HAMP junction within full-length Aer2. SAXS of PAS and poly-HAMP domain fragments of increasing complexity allow unambiguous domain assignments and reveal a linear quaternary structure. The Aer2 PAS dimeric crystal structure fits well within ab initioSAXS molecular envelopes and pulsed-dipolar ESR measurements of inter-PAS distances confirm the crystallographic PAS arrangement within Aer2. Spectroscopic and pull-down assays fail to detect direct interactions between the PAS and HAMP domains. Overall, the Aer2 signaling mechanism differs from the E. coliAer paradigm, where side-on PAS-HAMP contacts are key. We propose an in-line model for Aer2 signaling, where ligand binding induces alterations in PAS domain structure and subunit association that is relayed through the poly-HAMP junction to downstream domains.
Keywords: heme-binding PAS domain, HAMP domain, conformational change, signal transduction, bacterial chemoreceptor
INTRODUCTION
Two-component systems allow bacteria to respond to environmental changes and are therefore necessary for their survival. Signaling cascades are initiated by modular receptors that combine different functional domains to sense signals and relay changes to the activity of an enzymatic or non-enzymatic effector module. PAS and HAMP domains are two of the most common components. Found in over 29,000 and 26,000 proteins respectively, they regulate the same large class of effectors including Histidine kinases, Adenylyl cyclases, Methyl-accepting chemotaxis proteins, Phosphatases, GGDEF, and EAL domains. PAS domains often utilize a noncovalently bound cofactor (e.g. FAD or heme) that enables sensing of light, oxygen, voltage and chemical stimuli. HAMP domains are signal relay modules that couple input and output domains. The Escherichia coli aerotaxis receptor (EcAer) is the best-studied PAS-HAMP system, where signals are relayed through direct side-on PAS and HAMP domain interactions in this integral membrane protein. How signal transduction occurs in other multi-domain receptors is a major open question.
The Pseudomonas aeruginosa soluble receptor Aer2 has emerged as a promising system to investigate signal transduction by coupled PAS and HAMP domains. The domain architecture of Aer2 comprises 3 N-terminal HAMP domains (collectively known as a poly-HAMP domain) (pdb code 3LNR), a heme-binding PAS domain (pdb codes 3V0L, 4HI4), 2 C-terminal HAMP domains, and a kinase-control module (KCM) typical of methyl-accepting chemotaxis proteins (MCPs) (Figure 1, S1). Unlike EcAer, PaAer2 contains no integral membrane helices and thus, allows the study of interdomain signaling without the complication of the membrane component, which EcAer requires for function. The biological function of Aer2 is not yet clear. One report suggested Aer2 is involved in mediating aerotaxis in P. aeruginosabut this finding has not been confirmed. Nevertheless, Aer2 can interact with the chemotaxis system of E. coli to mediate repellent responses to O2, NO, and CO. Interestingly, deletion of CheB2, which is expressed from the same operon as Aer2 and likely mediates Aer2 adaptation, was necessary for P. aeruginosa pathogenesis in a C. elegans infection model. Thus, although how Aer2 relates to chemotaxis in P. aeruginosa is currently unclear, Aer2 is relevant to infection by P. aeruginosa.
Figure 1. Domain architecture of PAS and HAMP domains in PaAer2 and EcAer.
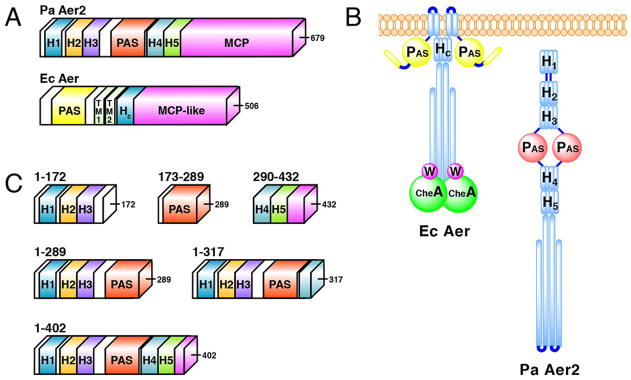
(A) Schematic representation of full-length PaAer2 and EcAer proteins. (B) Cartoon representation of full-length proteins displaying known PAS and HAMP domain interactions in EcAer and PaAer2. (C) Schematic representation of truncated PaAer2 proteins used in this study.
The crystal structure of the Aer2 PAS domain was recently determined with bound cyanide (CN-). The structure revealed a unique heme-binding PAS fold that is similar in overall architecture to the characterized heme-binding PAS domains of FixL and EcDOS, but different in important ways, which include primarily the regions surrounding the heme pocket and the mode of heme ligation. In addition, Aer2 PAS differs from the extracellular, heme c-binding PAS domains from G. sulfurreducens. This has raised the interesting question of precisely how the Aer2 PAS domain signals in response to ligand binding. Furthermore, how do the Aer2 PAS domains communicate with their downstream HAMP domains and why are the N-terminal HAMP domains, which occur prior to the sensing domain, necessary for function? To answer these questions we coupled structural data of the unligated ferric PAS domain using X-ray crystallography and low-resolution SAXS of PAS and poly-HAMP domains to establish the domain architecture of Aer2 and reveal conformational properties of the protein relevant to its signaling mechanism.
RESULTS
Crystal structure of Aer2 PAS
The structure of Aer2 PAS in the ferric heme state was determined at 2.3Å (Table 1) using the surface entropy reduction (SER) method, to reduce mobility of exposed loops. A variant protein containing the residue substitutions K176A and E275A(neither of which substantially affected the ability of full-length Aer2 to respond to oxygen) was readily crystallized and the structure determined by molecular replacement with the cyanide-bound form as a probe. In comparison with FixL and EcDOS, Aer2 represents a novel hemeb-binding PAS domain. Aer2 maintains the central Aβ, Bβ, Hβ, and Iβ PAS core but adopts a different structure between its Cα and Gβ elements to create a different cavity for heme binding (Figure 2). Cα/Dα form an extended, nearly continuous helix kinked at Ala209, which breaks with the i to i+4 main-chain hydrogen bonding pattern. This extension of Cα and Dα borders the heme edge and is compensated for by an abbreviated and repositioned turn between Gβ and Hβ. TheEα found in EcDOS and FixL distorts into a 310 helix (Eη in Aer2) with two i to i+3 main-chain hydrogen bonds. Surprisingly, the Fα helix does not supply the heme-ligating His residue as in FixL and EcDOS, despite two His residues being located on this helix in Aer2 PAS, including His239, which would be predicted by sequence alignments to be the proximal heme ligand (Figure 3). Instead, His234 on Eη serves as the proximal heme ligand. As a result, Fα, Gβ, and the heme moiety all adopt unique atomic positions in Aer2 PAS compared to EcDOS and FixL. The two Aer2 PAS His residues, including His239 project from the solvent exposed face of the Fα-helix. In EcDOS and FixL, the ligand stabilizing Met and Arg residues are located in the distal heme pocket constructed from the divergent region around Gβ. Rather in Aer2 PAS, a conserved Trp residue near the C-terminal end of Iβ interacts with the distal CN− ligand in the CN-bound structure. Overall, the structure of Aer2 highlights the degree of structural variability ofthe Cα- β cofactor-binding pockets of PAS domains, which cansupply a variety of ligands and adopt quite different conformations to accommodate the same cofactor.
Table 1.
Data collection and refinement statistics.
| Wavelength (Å) | 0.97720 |
| Resolution range (Å) | 50 – 2.3 (2.34 – 2.3) |
| Space group | P 21 2121 |
| Unit cell | 67.365 67.435 117.868 90 9090 |
| Total reflections | 159302 |
| Unique reflections | 24338 |
| Multiplicity | 6.5 (6.6) |
| Completeness (%) | 99.68 (97.25) |
| Mean I/sigma(I) | 18.05 (6.97) |
| Wilson B-factor | 28.25 |
| R-sym | 0.074 (0.32) |
| R-factor | 0.2281 (0.2270) |
| R-free | 0.2479 (0.2761) |
| Number of atoms | 4101 |
| macromolecules | 3685 |
| ligands | 197 |
| water | 67 |
| Protein residues | 476 |
| RMS (bonds) | 0.009 |
| RMS (angles) | 1.23 |
| Ramachandran favored (%) | 99 |
| Ramachandran outliers (%) | 0 |
| Clashscore | 20.03 |
| Average B-factor | 22.2 |
| macromolecules | 21.6 |
| solvent | 21.8 |
Figure 2. Aer2 is a novel heme-binding PAS domain that forms a parallel PAS dimer.

(A) Structural alignment of the heme-binding PAS domains of Aer2 (yellow, pdb 4HI4), FixL (purple, pdb 1D06), and EcDOS (pink, pdb 1V9Z). Aer2 conserves the core β– sheet (left) but adopts a novel conformation between the Cα helix and Gβ strand elements (middle and right) to bind heme in a unique way. (B) The ferric Aer2 PAS domain forms a parallel dimer with the Ncap and β sheet at the interface. FixL and EcDOS form similar parallel dimers but with different orientations of the PAS domains.
Figure 3. Sequence alignment of Aer2 with other heme-binding PAS domains.
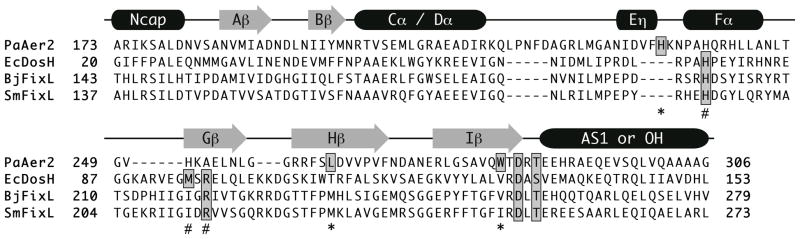
Sequence alignment of PaAer2, EcDos, B. japonicum FixL (BjFixL), and S. meliloti FixL (SmFixL) with secondary structure elements above. The proximal heme-coordinating histidine and distal ligand stabilizing residues are highlighted in grey. Residues important for PaAer2 are denoted by an asterick (*) symbol, while those for EcDOS/FixL are denoted by a # symbol. The C-terminal DxT motif is highlighted in grey.
Parallel PAS dimer
Aer2 PAS forms a parallel dimer in the crystallographic asymmetric unit with extensive contacts between the Ncap helices and β-sheets (Figure 2). This interface is consistent with typical modes of PAS dimerization. The Ncap helices point upward and reside slightly below the Gβ-Hβ loop. The C-termini of the Iβ strands align and face the opposite direction with the Cα carbons separated by 16.3 Å. This is approximately the same distance of separation predicted for the AS1–AS1′ helices of the downstream HAMP domain. A large pocket between the Ncap helices is lined with hydrophobic residues and is occupied by solvent molecules. FixL and EcDOS have also been crystallized as parallel dimers but with different PAS domain orientations (Figure 2). Aer2 PAS displays a tendency to dimerize in the crystal but is primarily a monomer in solution, as assessed by size-exclusion chromatography. However, the crystallographically observed dimer may well be relevant to the full-length receptor where the dimeric HAMP domains above and below would bring the PAS domains in close proximity.
Conformational changes associated with ligand binding
Important structural differences in the ferric heme state of Aer2 PAS compared to the CN-bound structure emanate from the ligand-binding region. These differences are consistent whether any of the four crystallographically unique molecules in the ligand-free structure are superimposed on the CN-bound structure. Strikingly, the Trp283 indole group that hydrogen bonds with bound CN−, rotates approximately 90° in the absence of ligand and Leu264 contracts toward the iron center to occupy the position where CN− binds (Figure 4). This shift in the position of Leu264 due to CN− coordination displaces Gβ, Hβ, and the C-terminus of Iβ, toward the dimer interface, with the C-alpha atoms of these β-strands moving by ~2.0 Å. The heme itself also shifts up toward Leu264 1.5–2.0 Å upon ligand binding and the surrounding regions of the proximal heme pocket adjust accordingly. The positions of residues in the Hβ-Iβ loop also differ by 3–4.5 Å in the two structures and couple to a similar magnitude shift in the Ncap helix, which packs against this loop at the dimer interface. The movement of the C-terminal Iβ strand, which appears to respond directly to the rotation of Trp283, causes a nearly 3.0 Å displacement toward the dimerfor the C-terminal DxT motif (Figure 4). This motif is a conserved feature of PAS domains, couples directly to the C-terminal HAMP domain in Aer2 and is known to undergo changes in different signaling states. Overall, the differences between the free-and CN-bound monomers are substantial and likely reflect the conformational change sutilized by Aer2 to respond to diatomic ligands. Importantly, if the CN-bound structure is superimposed on the ligand-free parallel PAS dimer found in the Aer2 PAS crystals, the shifts of the Ncap helix, and the Gβ-Hβ-Iβ cause collisions across the dimer interface that make the CN-bound form incompatible with the ligand-free structure (Figure 4). In particular, the C-terminal end of Hβ and the Ncap helix collide in the modeled dimer. Thus, ligand binding to Aer2 would in the least rearrange PAS-PAS interactions based on the parallel crystallographic dimer and may cause substantial changes to the junction between Iβ and the downstream HAMP domain.
Figure 4. Conformational changes associated with ligand binding.

Structural alignment of ferric (yellow) and CN-bound (grey) Aer2 PAS domains. (A) The absence of ligand alters the PAS domain structure shifting the β sheet and Ncap helix. (B) The active site rearranges in the absence of ligand with the Trp283 side chain, which interacts with bound CN, rotating 90 degrees and the Leu264 side chain moving over the iron center. (C) Ligand-induced conformational changes propagate to the DxT motif, at the C-terminal end of the Iβ strand, and associated Gβ-Hβ loop. (D) A superposition of the CN-bound structure on the ferric dimer structure finds the CN-bound monomer is incompatible with the ferric dimer. Asp265, which is adjacent to Leu264 in Hβ, collides with Val182, located at the C-terminal end of the Ncap, across the dimer interface. Superimposed CN-bound PAS molecules are shown as light grey (left) and dark grey (right).
The HAMP domains of Aer2 do not alter the local heme environment
Next, we aimed to determine how ligand binding might propagate from the Aer2 PAS domain to the down stream HAMP domains. We first asked whether Aer2 utilizes a similar mechanism asEcAer where side-on PAS/HAMP interactions mediate interdomain communication. Since EcAer requires the HAMP domain for stable FAD binding, we reasoned the HAMP domains might affect the spectroscopic properties of the Aer2 PAS domain. Initial characterization of PAS and PAS/HAMP fragments found substantial differences in UV-Visible spectra. However, we determined that rather than this being due to the presence of the HAMP domains it was caused by improper iron incorporation, as detected by fluorescence spectroscopy, which resulted in a mixture of heme and protoporphyrin IX (PPIX; heme lacking iron). Improper iron incorporation only occurred in the purified PAS/HAMP fragment. Co-expression of Aer2 with ferrochelatase, which catalyzes the insertion of iron into PPIX, resulted in full heme incorporation. The resulting UV-Visible spectra of PAS and PAS/HAMP fragments were now identical for all redox and ligation states assayed (Figure 5, Table 2). Thus, the HAMP domains do not alter the local environment surrounding the Aer2 PAS domain as monitored by UV-Visible spectroscopy.
Figure 5. The HAMP domains do not affect the UV-Visible absorption spectra of the heme-binding PAS domain.

UV-Visible absorption spectra of purified Aer2 PAS (173–289) and PAS/HAMP (1–402) proteins in ferric, ferrous, Fe(II)-O2, Fe(II)-NO, and Fe(III)-CN redox and ligation states. Absorption maxima (Table S2) and peak shape are identical in both Aer2 protein fragments.
Table 2.
UV-Visible absorption maxima for Aer2 PAS domains with and without HAMP domains.
| PAS (173–289) | PAS/HAMP (1–402) | |||||
|---|---|---|---|---|---|---|
| soret | β | α | soret | β | α | |
| Fe(III) | 393 | 511 | 646 | 396 | 511 | 645 |
| Fe(II) | 433 | 560 | 432 | 561 | ||
| Fe(II)-O2 | 418 | 543 | 577 | 418 | 543 | 577 |
| Fe(II)-NO | 419 | 534 | 568 | 419 | 533 | 567 |
| Fe(III)-CN | 422 | 545 | 421 | 545 | ||
The PAS and HAMP domains do not form stable complexes
The lack of spectroscopic changes does not necessarily rule out PAS and HAMP domain interactions in Aer2 since the heme environment is spatially removed from the likely contact interface involving the β, sheet. To directly assess inter-domain interactions we used pull-down assays of individually purified domains. The PAS domain failed to pull-down with both HAMP1-2/3 and HAMP4/5 (Figure S2). In addition, HAMP1-2/3-PAS failed to pull-down HAMP4/5. This suggests the PAS and HAMP domains do not form stable complexes but this data doesnot excludethe possibility of transient interactions, especially during signal transduction.
Determination of quaternary structure using small-angle X-ray scattering (SAXS)
Defining the domain juxtapositions within the quaternary structure of Aer2 should provide important clues to the mechanism of signal transduction. Small-angle X-ray scattering (SAXS) gives detailed information on mass distribution in molecules and can provide low-resolution molecular envelopes that are particularly useful to reconstruct quaternary structure when atomic structures of individual domains are known. To unambiguously identify the domain arrangement in Aer2, we collected SAXS data on progressively larger protein fragments: 1–172, 1–317, and 1–402. Conditions were optimized to ensure experimental data were suitable for analysis (see Materials and Methods). In summary, Guinier analysis and a plot of the intensity at zero scattering angle (I0) vs. concentration (Table 3, Figure 6) indicated all samples were monodisperse and suitable for ab initio reconstruction. In addition, a maximum distance (Dmax) for each receptor fragment was determined by calculating the pair-wise electron density distribution function (P(r)). Ten ab initio reconstructions were carried out for each Aer2 fragment using DAMMIN and the resulting models were compared and averaged to generate final envelopes (Figure 7).
Table 3.
SAXS parameters for data validation and interpretation.
| 1–172 | 1–317 | 1–402 | |
|---|---|---|---|
| Experimental | |||
| q-range | 0.0155 – 0.319 Å−1 | 0.0149 – 0.319 Å−1 | 0.01247 – 0.319 Å−1 |
| resolution | 402 – 19.7 Å | 422 – 19.7 Å | 504 – 19.7 Å |
| Rg (Guinier plot) | 32.4 Å | 45.8 Å | 62.7 Å |
| Rg ((P(r)) | 34.1 Å | 52.8 Å | 67.8 Å |
| Dmax | 115 Å | 205 Å | 250 Å |
| Ab initio SAXS model | |||
| Goodness of fit (χ2) | 1.02 | 1.16 | 1.31 |
| NSD | 1.00 | 0.64 | 0.69 |
| Rg model | 32.0 Å | 51.8 Å | 66.4 Å |
| Dmax model | 112.2 Å | 193 Å | 237.8 Å |
| Structural model | |||
| Dmax model | 112 Å | 207 Å | 241 Å |
Dmax values determined from experimental data, ab initio model, and structural model correlate well for each Aer2 protein fragment.
Figure 6. SAXS parameters for data validation and interpretation.

Guinier plot (left), I0 vs. protein concentration (middle), and P(r) vs. r (Å) (right) for (A) Aer2 1–172, (B) Aer2 1–317, and (C) Aer2 1–402 proteins. I0 = intensity at zero scattering angle; P(r) = pair-wise electron density distribution. Linear plots indicate the Aer2 protein samples are monodisperse and suitable for further analysis. Dmax values were determined from P(r) distributions.
Figure 7. Ab initio SAXS reconstructions of Aer2 protein fragments.

Molecular envelopes (grey) generated from scattering data of Aer2 protein fragments 1–172 (HAMP1–2/3), 1–317 (HAMP1-2/3, PAS, and HAMP4 AS-1/connector), and 1–402 (HAMP1-2/3, PAS, HAMP4/5, and 20 residues of SD). Due to the elongated nature of Aer2, protein fragments of increasing MW were used to allow clear identification of quaternary structure. Crystal structures of Aer2 HAMP1-2/3 (pdb3LNR) and the PAS dimer (pdb 4HI4) were manually placed and fit well inside the envelopes. HAMP2/3 of Aer2 was used as a model for HAMP4/5.
The ab initio reconstructions clearly distinguished the N-terminal poly-HAMP domains in each fragment (Figure 7). A wider envelope is found below HAMP3 and is consistent with a PAS dimer residing in this position. C-terminal extensions to PAS project downward and suggest HAMP4/5 lies below the PAS dimer. In addition, the Dmax values increased with addition of each domain (Table 3), which is consistent with a linear domain arrangement. Interestingly, a kink was observed at the PAS-HAMP4 junction. This feature was consistent among the various reconstructions. It may result from an inherent flexibility between the domainsor simply be an artifact given the highly elongated nature of Aer2. Elongated structures require increased search volumes compared to globular proteins making ab initio reconstructions less accurate.
Inter-domain distances defined by pulsed ESRare only consistent with a PAS dimer
We aimed to confirm the linear domain arrangement and lack of side-on PAS/HAMP interactions with pulsed dipolar ESR (PDS) distance measurements of spin labeled Aer2. We spin-labeled Aer2 1–402 and assessed the inter-domain PAS-PAS distanceby monitoring the magnetic dipolar interactions between spins. We chose to spin-labelat position S183, which is solvent exposed near the PAS dimer interface and should provide an intersubunit Cα-Cα distance of 11.7 Å if the crystallographic parallel dimer of Aer2 PAS is maintained in the larger protein (Figure 8). (Corresponding residues in the FixL and EcDOS dimeric structures are also near each other, with distances of 12.5 and 17.1 Å.) However, the 183 side chain is constrained by the dimer interface to project into solvent away from the symmetry axis of the dimer. Modeling S183C-nitroxide spin labels at the two corresponding 183 positions gives an intersubunit distance of ~26 Å between nitroxides (Figure 8). PDS distance measurements of MTSSL spin-labeled Aer2 1–402 S183C gave a strong dipolar signal and sharp P(r) distribution centered at 26.7 Å, in good agreement with the expected distance based on the crystal structure (Figure 8). There is no question that the presence of a HAMP domain between the PAS domains would greatly increase this distance by~26 Å, thus the experimental ESR distance measurements are only consistent with a dimeric PAS architecture within Aer2.
Figure 8. Inter-domain distance is only consistent with a PAS dimer.

(A) Time domain signal and (B) corresponding probability distance distribution (P(r)) for spin-labeled Aer2 1–402 S183C. A sharp P(r) centered at 26.8Å is smaller than the diameter of a HAMP domain and fully consistent with the ferric Aer2 PAS dimer. (c) Model of MTSSL spin labeled Aer2 S183C PAS dimer. The dimer interface directs the two spin labels (blue) away from each other to add approximately 15Å to the S183 Cα-Cα atom distance.
Model for Aer2 architecture
A final model of the Aer2 receptor architecture was produced using information derived from crystallography, SAXS, and ESR data (Figure 9). The ab initio molecular envelopes and Dmax values support a linear domain organization, with a PAS dimer sandwiched between the N- and C-terminal HAMP domains. This arrangementis consistent with the short, 3 amino acid linker between the PAS and HAMP4 termini whereas in EcAer the PAS and HAMP domains are separated by an F1 helical region and two transmembrane helices. Overall, the architecture of soluble Aer2 differs drastically from the membrane integrated EcAer, and thereby impliesan “in-line” mechanism for signal transduction between PAS and HAMP domains, much like those proposed for chemotaxis receptors, sensor kinases and sensory rhodopsin transducers.
Figure 9. Structural model of Aer2 receptor with a linear domain arrangement.

Full-length model of the soluble receptor Aer2 using structural information reported in this study. Dmax values derived from the SAXS data are displayed on right and are consistent with the linear domain arrangement as shown. A small region, comprising residues 158–172, predicted to be of helical structure would connect HAMP3 and the PAS domains. The MCP SD is modeled from T. maritima 1143 (pdb 2CH7).
DISCUSSION
Anin-line PAS and HAMP domain signaling mechanism in Aer2
The E. coliaerotaxis receptor Aer has served as aparadigm for PAS and HAMP domain signaling for more than a decade. EcAer is a transmembrane protein that has proved difficult to characterize structurally; however, through biochemical and genetic methods the signaling mechanism has been well characterized In EcAer, an F1 linker and two transmembrane helices separate the cytoplasmic PAS and HAMP domains. Signal relayoccurs through direct side-on inter-domain interactions between the PAS β – sheet and the cognate HAM PAS2 helix (Watts KJ, Johnson MS, and Taylor BL, unpublished data). It is noteworthy that this is an atypical type of inter-domain signaling for both PAS and HAMP domains. In general, PAS domains interact with other PAS domains through pseudo symmetric interfaces formed by the β – sheets or Ncaps and HAMP domains receive signal input from connected transmembrane helices.
To shed light on the signaling mechanisms in other PAS and HAMP domain systems we have investigated the architecture of the soluble receptor Aer2. This also represents the first structural characterization of poly-HAMP domains connected to a sensing domain. We have visualized the ligand induced PAS domain conformational changes between ferric and ferric CN-bound states and, combined with atomic resolution structures, defined the quaternary structure of the soluble receptor Aer2 using SAXS. Ab initio molecular envelopes and Dmax values clearly establish that the PAS and poly-HAMP domains of Aer2 are arranged in a linear fashion. Thus the mechanism by which PAS and HAMP communicate in Aer2 must be different than that of EcAer.
If Aer2 does not utilize side-on interactions, then how does ligand binding propagate to the downstream HAMP domains? Based on the work presented herein and previous, we hypothesize that signal relay occurs through changes at the junction between the PAS and HAMP domains caused by changes in PAS-PAS subunit orientations brought about by ligand binding. Namely, that changes at the C-terminal end of the PAS domain affect the conformation and signaling state of HAMP4, in a manner more similar to transmembrane signal input. Based on the dimeric crystal structure and matching ESR distance, we propose that Aer2 contains a PAS domain dimer and that alterations in sub unit interactions, which result from ligand binding in the heme-center, affect the conformation of HAMP4 AS1. Although the Aer2 PAS domains only have a weak affinity for dimerization in isolation, they are held in close proximity by the constitutively dimeric N- and C-terminal HAMP domains. This may explain why the N-terminal HAMP domains are required for function, even though they are not physically located between the input and output domains. In this scenario, a weak PAS dimerization affinity is preferential to allow perturbations at the PAS-PAS interface to be induced by ligand binding. In contrast, a very stable PAS dimer would be less able to respond to stimuli by altering the subunit interface.
Overall, these considerations lead to a model where the N-terminal poly-HAMPs are required as a dimerization motif. In support of this, Aer2 peptides lacking HAMP 2 and 3 cannot respond to changes in gas concentrations. Changes in ligation state cause conformational changes in PAS that propagate from the ligand binding site (e.g. rotation of Trp283 and contraction of Leu264) to shift the β-sheet, reposition the Ncap helix, alter the position of the C-terminal DxT motif, which connects directly to the downstream HAMP. This shifts the PAS monomer-dimer equilibrium or alternatively causes a rearrangement of the PAS dimer. The changes in PAS dimerization are interpreted by HAMP4/5 and relayed to the MCP signaling domain to regulate kinase activity. The orientation of the PAS domains relative to HAMP1-3 may also change in response to the ~3 Å change in Ncap helix position. However, due to its peripheral association with the PAS core, the position of the N-terminal helix could be affected by its lack of attachment to HAMP3 in the isolated PAS domain structures.
Comparison with conformational changes in other heme-binding PAS domains
FixL, EcDOS, and Aer2, the three PAS domains structurally defined in different ligation states appear to utilize different signaling mechanisms but nevertheless share some common themes for ligand induced conformational changes. In EcDOS, Met95 serves as the distal ligand in the 6-coordinate ferrous state. Oxygen binding purges Met95 far from the active site and the side chain of Arg97 flips downward to hydrogen bond with and stabilize bound O2 (Figure 10). The active site changes are propagated and coupled to a total rearrangement of the Fα-Gβ loop between residues Gly88 and Leu99. Other regions of the protein, including the core β-sheet, are nearly unchanged with the exception of the Leu99 and Tyr80 side chains. The ligand-induced conformational changes in FixL also occur in the Fα-Gβ loop but are relatively minor in comparison to EcDOS. FixL is 5-coordinate in the ferrous state. Bound O2 is stabilized by the side chain of Arg200, which moves inward from the periphery of the active site (Figure 10). Ile215 moves in the opposite direction, from the active site towards the periphery, and His214 alters its position to continue hydrogen bonding with the propionate group of heme. Overall, both EcDOS and FixL share a similar mechanism in that ligand binding is stabilized by an Arg residue and conformational changes are mainly localized to the Fα-Gβ loop, which contain the distal heme-coordinating and/or ligand-stabilizing residues.
Figure 10. Conformational changes in EcDOS and FixL PAS domains.
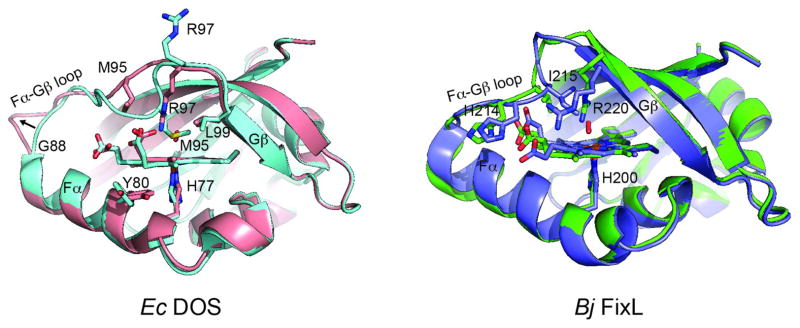
Superposition of EcDOS (pdb code: 1S66) and BjFixL (pdb codes: 1LSW, 1DP6) PAS domains in ferrous (blue, green) and O2 bound (pink, purple) states. The Fe (II) state of EcDOS is 6-coordinate with Met95 serving as the distal ligand. O2 binding displaces Met95 and is stabilized by Arg97. O2 binding is coupled to a rearrangement of the Fα-Gβ loop. In FixL, O2 binding also causes a rearrangement of the Fα-Gβ loop. This involves movement of Ile215 away from and Arg220 towards the heme center to hydrogen bond with molecular oxygen.
Analogous to the movement of M95/R97 in EcDOS and I215/R220 in FixL, CN-binding in Aer2 PAS displaces Leu264 from above the heme-iron center and rotation of the indole group of Trp283, which is already in the active site, facilitates a hydrogen bond to CN-. However, in contrast to FixL and EcDOS, the ferric and CN-bound structures of Aer2 differ not only in the active site but also throughout the entire domain, including the core β-sheet and Ncap. These global changes stem from the central location of the distal active site residues in Aer2, which reside in the Iβ (Trp283) and Hβ (Leu264) strands and not in Fα-Gβ loop/Gβ strand. The magnitude of these changes are not as large as the drastic shifts observed in the Fα-Gβ loop in EcDOS but importantly they affect the position of the C-terminal portion of the Iβ strand, Ncap, and dimer interface that more clearly illustrates the functional outcome of ligand binding in comparison to the localized movements observed for EcDOS and FixL. Overall, there is a similarity in the general mechanism of ligand-induced conformational changes in that one active site residue moves outward to allow ligand binding and another moves inward to hydrogen bond and stabilize bound ligand.
Although, the heme-binding PAS domains characterized thus far utilize different means to generate their respective signaling states, coordination of a diatomic ligand to the heme cofactor of these PAS sensors appears to be the key determinant in propagating conformational signals, as opposed to a change in heme redox state. In Aer2, any diatomic ligand capable of hydrogen bonding with its distal atom would be predicted to induce the same structural changes we observe with CN−. This may explain why Aer2 gives nearly equivalent chemotaxis repellent responses in E. coli with saturating levels of O2, NO or CO, the latter being isoelectronic with CN−. When ligation state control dominates, CN− can effectively mimic other diatomic ligands. The kinase activity of BjFixL is regulated nearly equivalently by O2 binding the ferrous heme or CN− binding the ferric form. Also, EcDOS is activated by both O2 and CO and cyanide binding to EcDOS induces similar all osteric changes in subunit interactions as CO or O2. In contrast, cyanide will not activate the heme-based CO transcription factor CooA, but this is because CN− is not a strong enough ligand to displace a protein-based proline ligand to the heme. Variant forms of CooA that have been engineered to be five coordinate bind cyanide and respond with an activated transcriptional response.
Endogenous ligands
The endogenous ligands sensed by Aer2 are currently not known, however the considerable differences between Fe3+ and Fe3+CN- structures that can propagate to the downstream HAMP domains suggest Aer2 switches between these two conformers during signaling. The response of Aer2 to CN− is not established, but all diatomic ligands tested (O2, NO, and CO) generate the same chemotactic response in E. coli cells expressing Aer2. Reaction toward these ligands indicates that Aer2 obtains the ferrous form within cells. Nonetheless, the CN− bound form, which favors ferric coordination, is likely a reasonable mimic for the ferrous ligation states of O2, NO and CO. The broad UV-visible spectral features of the Aer2 heme cofactor in either the ferric or ferrous forms indicate that the heme is 5-coordinate in the absence of ligand, regardless of redox state. Moreover, the conformational differences we observe between the ligand-bound and free forms stem from a coordinated diatomic ligand that is capable of accepting a hydrogen bond from Trp283 and excludes Leu264 from the active center. We suspect this is the critical factor in rearranging the PAS conformation, not the redox state of the heme per se. Cyanide simply allows a ligated state to be trapped by the ferric form. Nonetheless, determining structures of Aer2 in different redox/ligation states is an area of active investigation and will aid in determining the endogenous ligand and function of Aer2.
Summary
We determined the structure of Aer2 PAS with a 5-coordinate ferric heme, which in comparison with the six-coordinate ferric-CN− structure provide a view of conformation changes associated with ligand binding. In addition, we have reconstructed the structure of the soluble receptor Aer2 by combining atomic resolution structures of the individual PAS and HAMP domains with solution SAXS data. The resulting model indicates that the Aer2 PAS and HAMP domains do not directly interact but are arranged in a linear fashion, consistent with the results of both UV-Visible spectra, pull-down assays, and ESR distance measurements. Based on the structural architecture, a mechanism of signal transduction likely involves changes in PAS-PAS subunit association in response to changes in ligation state of the heme-iron. Overall, the quaternary structure of Aer2 establishes an in-line model for PAS-HAMP signaling that differs considerably from previously characterized systems, yet may be widely applicable to other signaling proteins that fuse sensory domains directly to HAMP modules.
EXPERIMENTAL PROCEDURES
Protein expression and purification
Various fragments (1–172, 173–289, 290–432, 1–289, 1–317, and 1–402) of the gene encoding Pseudomonas aeruginosa PAO1 Aer2 were cloned into the pET28a vector between NdeI and HindIII restriction sites, which added a cleavable N-terminal His-tag. The surface entropy reduction substitutions (K176A and E275A) were generated in Aer2 173–289 and full-length Aer2 1–679 using PCR (K176A-PAS) and site-directed mutagenesis. For over expression, plasmids were transformed into BL21 (DE3) cells, grown at 37° C in Luria Broth (LB) to an OD600 = 0.6 and incubated with 100 mM IPTG at either 18°C (1–402), 23°C (1–172, 1–289, 1–317, and 173–289), or 37°C (290–432) for 20 hrs (18°C and 23°C) or 6 hrs (37°C) before harvesting cells. Co expression with E. coli ferrochelatase was necessary to promote full heme incorporation in Aer2 1–402 as previously described. Proteins were purified using a Ni-NTA column following the manufacturers recommended protocol (Qiagen). After thrombin digestion His-tag free protein was applied to either a Superdex 75 26–60 Hi-Prep Column (1–172, 173–289, 290–432) or a Superdex 200 26–60 Hi-Prep Column (1–289, 1–317, and 1–402). Size exclusion columns were equilibrated with either 25 mM Tris, pH 7.5, 150 mM NaCl (1–172 and 290–432), 20 mM Imidazole, pH 8.0, 50 mM NaCl (1–289, 173–289, and 173–307) or 20 mM Imidazole, pH 8.0, 100 mM NaCl, 5% glycerol (1–402). Aer2 PAS fragments required imidazole for long-term stability. Concentrated protein was aliquoted, flash frozen, and stored at −80°C.
Behavioral assays
To determine any effects of the entropy reduction substitutions K176A and E275A on full-length Aer2 function, both lesions were independently introduced into pLH1, expressed in E. coli BT3388, and tested for their response to oxygen in a gas perfusion chamber. Mutants were induced with 200 μM IPTG and their swimming behavior observed after the addition or removal of oxygen.
Crystallization and data collection
Crystals of Aer2 173–289 K176A E275A protein (20–40 mg/mL) were grown by vapor diffusion, mixing 1.5 μL protein with 1.5 μL well solution, against a reservoir containing 5–20% PEG 4K, 0.2 M NaOAc, and 0.1 M Tris, pH 8.5–9.0 for 1–2 weeks at 17°C. Diffraction data were collected at the Cornell High Energy Synchrotron Source (CHESS) A1 beam line on an ADSC Quantum 210 CCD. Data were processed with HKL2000.
Structure determination and refinement
The ferric Aer2 PAS structure was determined by molecular replacement with Phenix Auto MR using the CN− bound Aer2 PAS structure (pdb code 3VOL) truncated from 183–287 with the heme removed. The structure was built using COOT and structure refinement was carried out using Phenix, amidst cycles of manual model building, minimization, B-factor refinement, and NCS to produce the final model (R-factor = 22.8, Rfree = 24.8) (Table 1).
UV-Visible absorption spectroscopy
Absorption spectra for Aer2 proteins were recorded at 25 °C in stoppered quartz cuvettes with an Agilent 8453 UV-Visible Absorption Spectrophotometer. Ferrous samples were prepared in an anaerobic glove box by diluting concentrated protein in previously degassed sample buffer and treating with the reducing agent dithionite. Subsequent addition of the nitric oxide releasing compound NOC-7 produced the ferrous-NO complex. Ferrous-NO complexes could also be generated by addition of 1μM ascorbate and NOC-7. Oxy complexes were generated by either adding cold, non-degassed buffer to dithionite treated ferrous Aer2 or by addition of 1 μM ascorbate in an aerobic environment. Ferric species were generated by addition of the oxidizing agent Fe(CN)6. Subsequent treatment with KCN produced the ferric-CN− complex. Multiple rounds of buffer exchange were conducted to remove any trace of imidazole prior to spectroscopic measurements.
Pull-down assays
Pull-down assays were carried out in binding buffer composed of 50 mM Tris, pH 7.5, 150 mM NaCl, and 50 mM Imidazole in an aerobic environment. Proteins were incubated with 30 mL washed Ni-NTA resin for 30 min and washed with binding buffer. SDS-loading buffer was added to Ni-NTA resin and used for SDS-PAGE analysis.
SAXS data collection
SAXS data were collected at the SIBYLS beam line (Advanced Light Source, Lawrence Berkeley National Laboratories) using a Mar CCD 165 detector capable of fast frame transfer mode. Protein samples at various concentrations and matching buffer samples were loaded into a 96 well plate and transferred to a helium purged sample chamber using a Hamilton robot. Data were collected for short (0.5 sec), long (5 sec), and short (0.5 sec) exposure times. Samples were checked for radiation damage by comparing data from both short exposure times. Guinier plots were used to evaluate potential sample aggregation and protein concentration effects. Initial data of Aer2 1–402 indicated inter-particle repulsion (decreased scattering at Io with increasing protein concentration). Buffer modification to 20 mM Imidazole, pH 7.0, 200 mM NaCl, 5% glycerol alleviated this effect generating monodisperse samples suitable for SAXS analysis.
SAXS data evaluation and ab initio reconstruction
Prior to analysis, scattering from matching buffer samples was subtracted to generate scattering curves due to protein alone. Guinier plots of buffer subtracted scattering curves were analyzed using PRIMUS and used to calculate the radius of gyration (Rg) and intensity at zero scattering angle (Io). All Guinier plot values reported include a range extending to Rg × 1.3. To optimize signal to noise ratios, merged data sets were created from short exposures for small values of q and long exposures for large values of q. Pair-distribution functions (P(r)) were generated using GNOM and used for ab initio shape reconstruction using DAMMIN. Ten independent ab initio runs were compared and averaged using SUPCOMB and DAMAVER to generate the final molecular envelopes. Crystal structures of Aer2 fragments 1–172 and 173–289 were manually fit into the envelopes. HAMP2/3 (residues 66–156) were used to model HAMP4/5.
Pulsed dipolar ESR distance measurements
Purified Aer2 1–402 S183C was spin-labeled by gentle mixing with excess MTSSL overnight at 4°C. Excess spin-label was removed by buffer exchange and protein was used immediately for ESR analysis. Pulsed dipolar electron spin resonance spectroscopy (PDS ESR, or PDS in short) measurements were conducted at the AdvanCed Electron Resonance Technology (ACERT) facility as previously described. Double Electron Electron Resonance (DEER) experiments were carried out at 17.35 GHz on a home-built 2D-FT ESR spectrometer, with either 16 ns or 32 ns pump pulses. Protein concentrations were in the range of 25–50 μM. The baseline was approximated by a linear polynomial in most cases. Subsequently, distance distributions were calculated by Tikhonov regularization and further refined by a maximum entropy regularization method (MEM).
Construction of structural model of full-length Aer2
The full-length model for Aer2 was manually constructed using Pymol by arranging crystal structures of Aer2 PAS fragments in accordance with Dmax values from scattering data.
Supplementary Material
HIGHLIGHTS.
Demonstrates that similar PAS domains can display distinctly different heme-binding modes and ligand sensing mechanisms
Reveals ligand-binding induces a global structural rearrangement in the Aer2 PAS domain
Proposes an in-line model for PAS-HAMP signaling that differs from the E. coli Aer paradigm
Acknowledgments
The authors thank Greg L. Hura and Michal Hammel at the SIBYLS beamline for assistance with data collection and processing and the beam line staff at CHESS. This work was supported by the NIH grants GM066775 to B.R.C., GM08267 to M.V.A, NIH/NIGMS P41GM103521 and NIH/NCRR P41RR016292 to J.H.F. (ACERT), and start-up funds (Loma Linda University) to K.J.W. Support for CHESS is by NIH/NIGMS GM103485 and the SIBYLS beam line in part by the DOE IDAT DE-AC02-05CH11231.
ABBREVIATIONS
- PAS
Per-Arnt-Sim
- HAMP
Histidine kinase-Adenylyl cyclase-Methyl-accepting chemotaxis protein-Phosphatase
- SER
surface entropy reduction
- SAXS
small-angle x-ray scattering
- ESR
electron spin resonance
- CN
cyanide
Footnotes
ACCESSION NUMBERS
The coordinates and structure factors for the ferric Aer2 PAS domain have been deposited in the protein data bank with PDB ID 4HI4.
Publisher's Disclaimer: This is a PDF file of an unedited manuscript that has been accepted for publication. As a service to our customers we are providing this early version of the manuscript. The manuscript will undergo copyediting, typesetting, and review of the resulting proof before it is published in its final citable form. Please note that during the production process errors may be discovered which could affect the content, and all legal disclaimers that apply to the journal pertain.
References
- 1.Parkinson JS. Signaling mechanisms of HAMP domains in chemo receptors and sensor kinases. Annual review of microbiology. 2010;64:101–122. doi: 10.1146/annurev.micro.112408.134215. [DOI] [PubMed] [Google Scholar]
- 2.Möglich A, Ayers RA, Moffat K. Structure and signaling mechanism of Per-ARNT-Sim domains. Structure. 2009;17(10):1282–1294. doi: 10.1016/j.str.2009.08.011. [DOI] [PMC free article] [PubMed] [Google Scholar]
- 3.Dunin-Horkawicz S, Lupas AN. Comprehensive analysis of HAMP domains: implications for transmembrane signal transduction. Journal of molecular biology. 2010;397(5):1156–1174. doi: 10.1016/j.jmb.2010.02.031. [DOI] [PubMed] [Google Scholar]
- 4.Schultz J, Milpetz F, Bork P, Ponting CP. SMART, a simple modular architecture research tool: identification of signaling domains. Proceedings of the National Academy of Sciences. 1998;95(11):5857–5864. doi: 10.1073/pnas.95.11.5857. [DOI] [PMC free article] [PubMed] [Google Scholar]
- 5.Henry JT, Crosson S. Ligand Binding PAS Domains in a Genomic, Cellular, and Structural Context. Annual review of microbiology. 2011;(0) doi: 10.1146/annurev-micro-121809-151631. [DOI] [PMC free article] [PubMed] [Google Scholar]
- 6.Taylor BL. Aer on the inside looking out: paradigm for a PAS–HAMP role in sensing oxygen, redox and energy. Molecular microbiology. 2007;65(6):1415–1424. doi: 10.1111/j.1365-2958.2007.05889.x. [DOI] [PMC free article] [PubMed] [Google Scholar]
- 7.Campbell AJ, Watts KJ, Johnson MS, Taylor BL. Gain-of-function mutations cluster in distinct regions associated with the signalling pathway in the PAS domain of the aerotaxis receptor, Aer. Molecular microbiology. 2010;77(3):575–586. doi: 10.1111/j.1365-2958.2010.07231.x. [DOI] [PMC free article] [PubMed] [Google Scholar]
- 8.Watts KJ, Taylor BL, Johnson MS. PAS/poly-HAMP signalling in Aer-2, a soluble haem-based sensor. Molecular microbiology. 2011;79(3):686–699. doi: 10.1111/j.1365-2958.2010.07477.x. [DOI] [PMC free article] [PubMed] [Google Scholar]
- 9.Airola MV, Watts KJ, Bilwes AM, Crane BR. Structure of concatenated HAMP domains provides a mechanism for signal transduction. Structure. 2010;18(4):436–448. doi: 10.1016/j.str.2010.01.013. [DOI] [PMC free article] [PubMed] [Google Scholar]
- 10.Sawai H, et al. Structural basis for oxygen sensing and signal transduction of the heme-based sensor protein Aer2 from Pseudomonas aeruginosa. Chemical Communications. 2012 doi: 10.1039/c2cc32549g. [DOI] [PubMed] [Google Scholar]
- 11.Hong CS, et al. Chemotaxis proteins and transducers for aerotaxis in Pseudomonas aeruginosa. FEMS microbiology letters. 2004;231(2):247–252. doi: 10.1016/S0378-1097(04)00009-6. [DOI] [PubMed] [Google Scholar]
- 12.Ferrández A, Hawkins AC, Summerfield DT, Harwood CS. Cluster II che genes from Pseudomonas aeruginosa are required for an optimal chemotactic response. Journal of bacteriology. 2002;184(16):4374–4383. doi: 10.1128/JB.184.16.4374-4383.2002. [DOI] [PMC free article] [PubMed] [Google Scholar]
- 13.Güvener ZT, Tifrea DF, Harwood CS. Two different Pseudomonas aeruginosa chemosensory signal transduction complexes localize to cell poles and form and remould in stationary phase. Molecular microbiology. 2006;61(1):106–118. doi: 10.1111/j.1365-2958.2006.05218.x. [DOI] [PubMed] [Google Scholar]
- 14.Garvis S, et al. Caenorhabditis elegans semi-automated liquid screen reveals a specialized role for the chemotaxis gene cheB2 in Pseudomonas aeruginosa virulence. PLoS pathogens. 2009;5(8):e1000540. doi: 10.1371/journal.ppat.1000540. [DOI] [PMC free article] [PubMed] [Google Scholar]
- 15.Gong W, et al. Structure of a biological oxygen sensor: a new mechanism for heme-driven signal transduction. Proceedings of the National Academy of Sciences. 1998;95(26):15177–15182. doi: 10.1073/pnas.95.26.15177. [DOI] [PMC free article] [PubMed] [Google Scholar]
- 16.Key J, Moffat K. Crystal Structures of Deoxy and CO-Bound bj FixLH Reveal Details of Ligand Recognition and Signaling. Biochemistry. 2005;44(12):4627–4635. doi: 10.1021/bi047942r. [DOI] [PubMed] [Google Scholar]
- 17.Miyatake H, et al. Sensory mechanism of oxygen sensor FixL from Rhizobium meliloti: crystallographic, mutagenesis and resonance Raman spectroscopic studies. Journal of molecular biology. 2000;301(2):415. doi: 10.1006/jmbi.2000.3954. [DOI] [PubMed] [Google Scholar]
- 18.Kurokawa H, et al. A redox-controlled molecular switch revealed by the crystal structure of a bacterial heme PAS sensor. Journal of Biological Chemistry. 2004;279(19):20186–20193. doi: 10.1074/jbc.M314199200. [DOI] [PubMed] [Google Scholar]
- 19.Park HJ, Suquet C, Satterlee JD, Kang CH. Insights into signal transduction involving PAS domain oxygen-sensing heme proteins from the X-ray crystal structure of Escherichia coli Dos heme domain (Ec DosH) Biochemistry. 2004;43(10):2738–2746. doi: 10.1021/bi035980p. [DOI] [PubMed] [Google Scholar]
- 20.Pokkuluri P, et al. Structures and Solution Properties of Two Novel Periplasmic Sensor Domains with< i> c</i>-Type Heme from Chemotaxis Proteins of< i> Geobacter sulfurreducens</i>: Implications for Signal Transduction. Journal of molecular biology. 2008;377(5):1498–1517. doi: 10.1016/j.jmb.2008.01.087. [DOI] [PubMed] [Google Scholar]
- 21.Derewenda ZS, Vekilov PG. Entropy and surface engineering in protein crystallization. Acta Crystallographica Section D: Biological Crystallography. 2005;62(1):116–124. doi: 10.1107/S0907444905035237. [DOI] [PubMed] [Google Scholar]
- 22.Cooper DR, et al. Protein crystallization by surface entropy reduction: optimization of the SER strategy. Acta Crystallographica Section D: Biological Crystallography. 2007;63(5):636–645. doi: 10.1107/S0907444907010931. [DOI] [PubMed] [Google Scholar]
- 23.Herrmann S, Ma Q, Johnson MS, Repik AV, Taylor BL. PAS domain of the Aer redox sensor requires C-terminal residues for native-fold formation and flavin adenine dinucleotide binding. Journal of bacteriology. 2004;186(20):6782–6791. doi: 10.1128/JB.186.20.6782-6791.2004. [DOI] [PMC free article] [PubMed] [Google Scholar]
- 24.Bibikov SI, Barnes LA, Gitin Y, Parkinson JS. Domain organization and flavin adenine dinucleotide-binding determinants in the aerotaxis signal transducer Aer of Escherichia coli. Proceedings of the National Academy of Sciences. 2000;97(11):5830–5835. doi: 10.1073/pnas.100118697. [DOI] [PMC free article] [PubMed] [Google Scholar]
- 25.Ma Q, Johnson MS, Taylor BL. Genetic analysis of the HAMP domain of the Aer aerotaxis sensor localizes flavin adenine dinucleotide-binding determinants to the AS-2 helix. Journal of bacteriology. 2005;187(1):193–201. doi: 10.1128/JB.187.1.193-201.2005. [DOI] [PMC free article] [PubMed] [Google Scholar]
- 26.Sudhamsu J, et al. Co-expression of ferrochelatase allows for complete heme incorporation into recombinant proteins produced in E. coli. Protein Expression and Purification. 2010;73(1):78–82. doi: 10.1016/j.pep.2010.03.010. [DOI] [PMC free article] [PubMed] [Google Scholar]
- 27.Airola MV, Du J, Dawson JH, Crane BR. Heme binding to the mammalian circadian clock protein period 2 is nonspecific. Biochemistry. 2010;49(20):4327–4338. doi: 10.1021/bi901945w. [DOI] [PMC free article] [PubMed] [Google Scholar]
- 28.Putnam CD, Hammel M, Hura GL, Tainer JA. X-ray solution scattering (SAXS) combined with crystallography and computation: defining accurate macromolecular structures, conformations and assemblies in solution. Quarterly reviews of biophysics. 2007;40(03):191–285. doi: 10.1017/S0033583507004635. [DOI] [PubMed] [Google Scholar]
- 29.Svergun D. Restoring low resolution structure of biological macromolecules from solution scattering using simulated annealing. Biophysical journal. 1999;76(6):2879. doi: 10.1016/S0006-3495(99)77443-6. [DOI] [PMC free article] [PubMed] [Google Scholar]
- 30.Watts KJ, Sommer K, Fry SL, Johnson MS, Taylor BL. Function of the N-terminal cap of the PAS domain in signaling by the aerotaxis receptor Aer. Journal of bacteriology. 2006;188(6):2154–2162. doi: 10.1128/JB.188.6.2154-2162.2006. [DOI] [PMC free article] [PubMed] [Google Scholar]
- 31.Watts KJ, Johnson MS, Taylor BL. Minimal requirements for oxygen sensing by the aerotaxis receptor Aer. Molecular microbiology. 2006;59(4):1317–1326. doi: 10.1111/j.1365-2958.2005.05012.x. [DOI] [PMC free article] [PubMed] [Google Scholar]
- 32.Watts KJ, Johnson MS, Taylor BL. Structure-function relationships in the HAMP and proximal signaling domains of the aerotaxis receptor Aer. Journal of bacteriology. 2008;190(6):2118–2127. doi: 10.1128/JB.01858-07. [DOI] [PMC free article] [PubMed] [Google Scholar]
- 33.Watts KJ, Johnson MS, Taylor BL. Different Conformations of the Kinase-On and Kinase-Off Signaling States in the Aer HAMP Domain. Journal of bacteriology. 2011;193(16):4095–4103. doi: 10.1128/JB.01069-10. [DOI] [PMC free article] [PubMed] [Google Scholar]
- 34.Watts KJ, Ma Q, Johnson MS, Taylor BL. Interactions between the PAS and HAMP domains of the Escherichia coli aerotaxis receptor Aer. Journal of bacteriology. 2004;186(21):7440–7449. doi: 10.1128/JB.186.21.7440-7449.2004. [DOI] [PMC free article] [PubMed] [Google Scholar]
- 35.Campbell AJ, Watts KJ, Johnson MS, Taylor BL. Role of the F1 Region in the Escherichia coli Aerotaxis Receptor Aer. Journal of bacteriology. 2011;193(2):358–366. doi: 10.1128/JB.01028-10. [DOI] [PMC free article] [PubMed] [Google Scholar]
- 36.del Carmen Burón-Barral M, Gosink KK, Parkinson JS. Loss-and gain-of-function mutations in the F1-HAMP region of the Escherichia coli aerotaxis transducer Aer. Journal of bacteriology. 2006;188(10):3477–3486. doi: 10.1128/JB.188.10.3477-3486.2006. [DOI] [PMC free article] [PubMed] [Google Scholar]
- 37.Repik A, et al. PAS domain residues involved in signal transduction by the Aer redox sensor of Escherichia coli. Molecular microbiology. 2002;36(4):806–816. doi: 10.1046/j.1365-2958.2000.01910.x. [DOI] [PMC free article] [PubMed] [Google Scholar]
- 38.Amin DN, Taylor BL, Johnson MS. Organization of the aerotaxis receptor Aer in the membrane of Escherichia coli. Journal of bacteriology. 2007;189(20):7206–7212. doi: 10.1128/JB.00871-07. [DOI] [PMC free article] [PubMed] [Google Scholar]
- 39.Hao B, Isaza C, Arndt J, Soltis M, Chan MK. Structure-based mechanism of O2 sensing and ligand discrimination by the FixL heme domain of Bradyrhizobium japonicum. Biochemistry. 2002;41(43):12952–12958. doi: 10.1021/bi020144l. [DOI] [PubMed] [Google Scholar]
- 40.Tuckerman JR, Gonzalez G, Dioum EM, Gilles-Gonzalez MA. Ligand and oxidation-state specific regulation of the heme-based oxygen sensor FixL from Sinorhizobium meliloti. Biochemistry. 2002;41(19):6170–6177. doi: 10.1021/bi025628w. [DOI] [PubMed] [Google Scholar]
- 41.Hiroto Takahashi TS. Phosphodiesterase Activity of Ec DOS, a Heme-regulated Enzyme from Escherichia coli, toward 3′,5′-Cyclic Diguanylic Acid Is Obviously Enhanced by O2 and CO Binding. Chemistry Letters. 2006;35(8):970–971. [Google Scholar]
- 42.Lechauve C, et al. Heme ligand binding properties and intradimer interactions in the full-length sensor protein DOS from Escherichia coli and its isolated heme domain. Journal of Biological Chemistry. 2009;284(52):36146–36159. doi: 10.1074/jbc.M109.066811. [DOI] [PMC free article] [PubMed] [Google Scholar]
- 43.Youn H, Kerby RL, Roberts GP. The role of the hydrophobic distal heme pocket of CooA in ligand sensing and response. Journal of Biological Chemistry. 2003;278(4):2333–2340. doi: 10.1074/jbc.M210825200. [DOI] [PubMed] [Google Scholar]
- 44.Thorsteinsson MV, Kerby RL, Roberts GP. Altering the specificity of CooA, the carbon monoxide-sensing transcriptional activator: characterization of CooA variants that bind cyanide in the FeII form with high affinity. Biochemistry. 2000;39(28):8284–8290. doi: 10.1021/bi000327c. [DOI] [PubMed] [Google Scholar]
- 45.Yu HS, et al. Aerotactic responses in bacteria to photoreleased oxygen. FEMS microbiology letters. 2006;217(2):237–242. doi: 10.1111/j.1574-6968.2002.tb11481.x. [DOI] [PubMed] [Google Scholar]
- 46.Otwinowski Z, Minor W. Processing of X-ray diffraction data collected in oscillation mode. Macromolecular Crystallography, Pt A. 1997;276:307–326. doi: 10.1016/S0076-6879(97)76066-X. [DOI] [PubMed] [Google Scholar]
- 47.Adams PD, et al. PHENIX: a comprehensive Python-based system for macromolecular structure solution. Acta Crystallographica Section D: Biological Crystallography. 2010;66(2):213–221. doi: 10.1107/S0907444909052925. [DOI] [PMC free article] [PubMed] [Google Scholar]
- 48.Emsley P, Cowtan K. Coot: model-building tools for molecular graphics. Acta Crystallographica Section D: Biological Crystallography. 2004;60(12):2126–2132. doi: 10.1107/S0907444904019158. [DOI] [PubMed] [Google Scholar]
- 49.Konarev PV, Volkov VV, Sokolova AV, Koch MHJ, Svergun DI. PRIMUS: a Windows PC-based system for small-angle scattering data analysis. Journal of Applied Crystallography. 2003;36(5):1277–1282. [Google Scholar]
- 50.Svergun D. Determination of the regularization parameter in indirect-transform methods using perceptual criteria. Journal of Applied Crystallography. 1992;25(4):495–503. [Google Scholar]
- 51.Kozin MB, Svergun DI. Automated matching of high-and low-resolution structural models. Journal of Applied Crystallography. 2001;34(1):33–41. [Google Scholar]
- 52.Volkov VV, Svergun DI. Uniqueness of ab initio shape determination in small-angle scattering. Journal of Applied Crystallography. 2003;36(3):860–864. doi: 10.1107/S0021889809000338. [DOI] [PMC free article] [PubMed] [Google Scholar]
- 53.Bhatnagar J, et al. Structure of the ternary complex formed by a chemotaxis receptor signaling domain, the CheA histidine kinase, and the coupling protein CheW as determined by pulsed dipolar ESR spectroscopy. Biochemistry. 2010;49(18):3824–3841. doi: 10.1021/bi100055m. [DOI] [PMC free article] [PubMed] [Google Scholar]
- 54.Borbat PP, Freed JH. Measuring distances by pulsed dipolar ESR spectroscopy: Spin-labeled histidine kinases. Methods in enzymology. 2007;423:52–116. doi: 10.1016/S0076-6879(07)23003-4. [DOI] [PubMed] [Google Scholar]
- 55.Park SY, et al. Reconstruction of the chemotaxis receptor–kinase assembly. Nature structural & molecular biology. 2006;13(5):400–407. doi: 10.1038/nsmb1085. [DOI] [PubMed] [Google Scholar]
- 56.Chiang YW, Borbat PP, Freed JH. The determination of pair distance distributions by pulsed ESR using Tikhonov regularization. Journal of Magnetic Resonance. 2005;172(2):279–295. doi: 10.1016/j.jmr.2004.10.012. [DOI] [PubMed] [Google Scholar]
- 57.Chiang YW, Borbat PP, Freed JH. Maximum entropy: A complement to Tikhonov regularization for determination of pair distance distributions by pulsed ESR. Journal of Magnetic Resonance. 2005;177(2):184–196. doi: 10.1016/j.jmr.2005.07.021. [DOI] [PubMed] [Google Scholar]
Associated Data
This section collects any data citations, data availability statements, or supplementary materials included in this article.