Abstract
An icosahedral closo-B122− scaffold supports twelve copies of Gd3+-chelate held in close proximity with each other by suitable linkers which employ azide-alkyne click chemistry. This design is the first member of a new class of polyfunctional MRI contrast agents carrying a high payload of Gd3+-chelate in a sterically constrained configuration. The resulting contrast agent shows higher relaxivity values at high magnetic fields. MRI contrast agents currently in use are not as effective in this regard, presumably due to a lack of steric constraint of gadolinium centers and lower water exchange rates. In vivo MRI studies in mice show excellent contrast enhancement even at one-seventh of the safe clinical dose (0.04 mmol Gd/kg) for up to a 1 h exposure.
INTRODUCTION
Magnetic Resonance Imaging (MRI) is one of the most useful, non-invasive diagnostic imaging tools used in medicine.1 Image contrast in MRI depends essentially on differences in the relaxation times and proton density provided by water between adjacent tissues. Since this difference is very small, administration of an MRI contrast agent (CA) is required to enhance the contrast between adjacent tissues.2 The efficiency of a CA is measured by the relaxivity r1 [mM−1s−1], that represents the increase in water proton relaxation rate R1. Currently, a wide variety of MRI CAs have been approved for clinical use.3 MRI CAs are species that typically contain a paramagnetic metal ion, such as gadolinium (Gd3+) chelated within a poly(aminocarboxylate) core, e.g., diethylenetriaminepentaacetic acid (DTPA)- or 1,4,7,10-tetraazacyclododecane-1,4,7,10-tetraacetic acid (DOTA).4,5 Despite several years of research and development, most clinically used low molecular weight MRI CAs suffer from some basic disadvantages, namely relatively low r1 values (~4 mM−1s−1 at higher magnetic field strength), toxicity (nephrogenic systemic fibrosis in patients with renal dysfunction), lack of selectivity for tissues and extremely short intravascular half-lives (~20 min).6 Moreover these low molecular weight CAs do not provide sufficient contrast at low concentrations, which is essential for biomedical and targeted imaging.2, 7
Solomon-Bloembergen-Morgan (SBM) theory8 relates the relaxivity of a CA to three principal factors: the number of water molecules directly coordinated to the central metal ion (q), the residence time of a water molecule coordinated to the metal center (τM), and the rotational correlation time that measures the extent of the rotation or tumbling undergone by a Gd3+/H2O complex (τR). The relaxivity of Gd3+-based CAs can be improved by reducing their rotational motion in solution, e.g. by immobilizing the gadolinium complexes onto macromolecules of different shapes and sizes (proteins, polylysine, dendrimers, polysaccharides, micelles, liposomes etc.).9 Macromolecular CAs carrying multiple copies of Gd3+ chelates show great promise for enhancing the contrast, sensitivity and diagnostic imaging time frame, as well as slow vascular diffusion and clearance rates due to the enhanced permeability and retention (EPR) effect. However, they suffer from polydispersity and the resulting difficulties in characterization.9a, 10
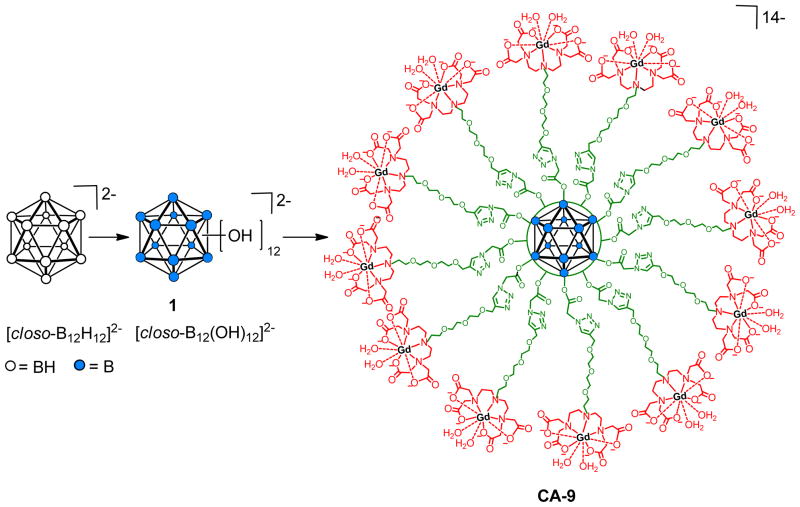
More recently, the focus of MRI CAs development has been shifted from macromolecules to smaller or medium size molecular design where multiple copies of Gd3+-chelate have been covalently attached to either a benzene or a β-Cyclodextrin (β-CD) core.11 The higher r1 values of these multimeric MRI CAs were attributed to their rigid framework and the presence of multiple Gd3+-chelates in close proximity to each other, that restricts the rotational motion (τR) of Gd3+-chelates.11 We herein report a new class of monodisperse, nanomolecular polyfunctional MRI CAs that has twelve radial Gd3+-chelate arms in close proximity, linked to a central rigid closo-B122− core (CA-9, figure 1). These new MRI CAs show high relaxivity values and improved contrast enhancement during in vivo MRI studies in mice.
Figure 1.
Icosahedral closo-borane scaffold decorated with twelve Gd3+-DTTA chelates.
Our laboratory has been actively pursuing research with the aim of establishing polyhedral boranes as a scaffold for the targeted high payload delivery of drugs and imaging agents.12 The hydroxylation of all of the B-H vertices of [closo-B12H12]2− using 30% hydrogen peroxide provides [closo-B12(OH)12]2−, 1, a monodisperse functionalizable molecular scaffold that can be used to anchor up to twelve radial arms with desired pendant functionalities (Figure 1).13 Consequently, twelve-fold carboxylate ester, carbamate and ether derivatives, referred to as “closomers”, are now available.14 The twelve linker arms that simultaneously originate at the icosahedral surface are in close proximity to each other. This unique configuration is ideally suited for the construction of a monodisperse nanomolecular assembly having twelve Gd3+-chelates in a sterically constrained configuration, which can restrict rotational motion of individual Gd3+-chelates resulting in high r1 values and an enhanced MRI contrast image. One example of such a configuration having Gd3+-DTTA chelates is presented in figure 1 (CA-9). The key features of the design are: (i) twelve Gd3+-chelates covalently attached to a central core at zero generation, (ii) a highly symmetrical and compact architecture compared to dendrimers of similar twelve fold functionality, and (iii) a simple and straightforward synthetic route that can be further translated to attach other chelating ligands (e.g. DTPA, DOTA).
RESULTS AND DISCUSSION
Synthesis of the DTTA Ligand
The closomer Gd3+-DTTA complex design is based on our recently reported synthesis of the 12-fold azidoacetate closomer 7 (scheme 2) and its Cu(I)-catalyzed 1,3-dipolar cycloaddition reaction with various alkynes to afford 12-fold 1,2,3-triazole-linked closomers.14f The choice of the diethylenetriaminetetraacetic acid (DTTA) Gd3+-chelator ligand was inspired by recent literature reports showing that DTTA-type ligands allow two inner sphere open water exchange sites (q = 2) for the central metal ion and exhibit a relatively faster water exchange rate.15 However, the lower denticity of DTTA ligands can result in Gd3+-DTTA complexes with slightly lower thermodynamic stability (log KGdL~17–19) than eight coordinate Gd3+-DTPA (log KGdL~22) or Gd3+-DOTA (log KGdL~23) complexes.3 The synthetic methodology presented here can easily be adapted to DTPA or DOTA ligand-type Gd3 chelators.
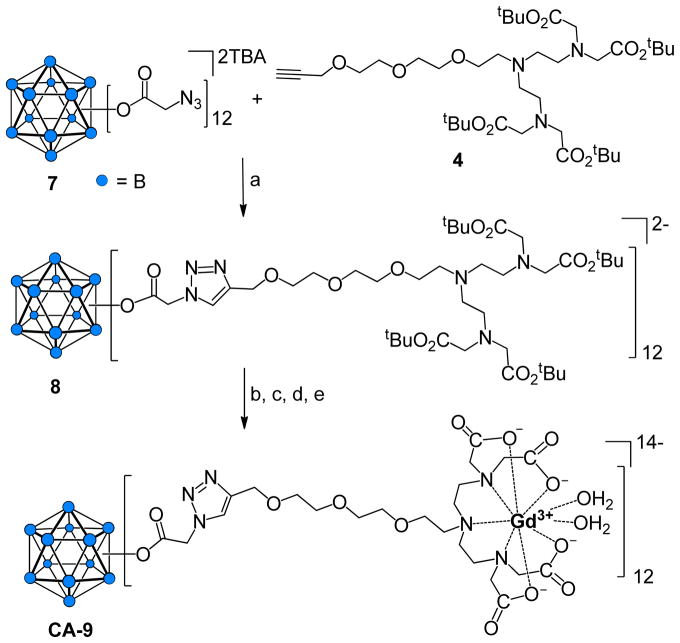
Scheme 2.
Synthesis of CA-9.
Reagents and conditions: (a) CuI, DIPEA THF-ACN, 3 days, 76%; (b) 80% TFA-DCM, 6 h, RT; (c) GdCl3·6H2O, citrate buffer, pH 7, 24 h, RT, sonication; (d) Dialysis, 1,000 MWCO, 48 h; (e) Lyophilization, 82%.
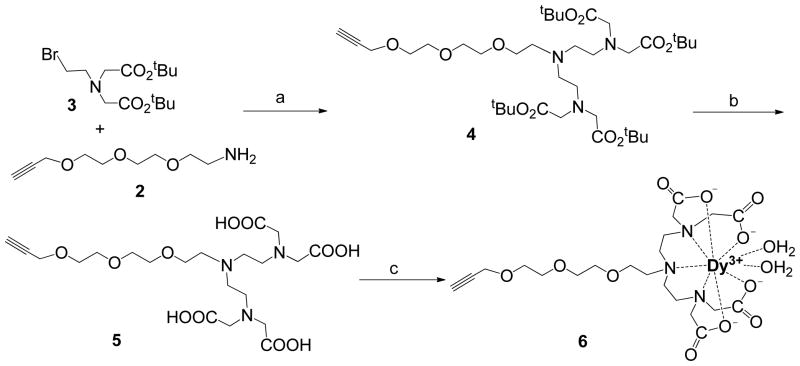
In order to pack twelve Gd3+ chelates in a sterically confined space, a suitable linker with a terminal alkyne functional group must be synthesized which will react with the azido terminated closomer scaffold. To increase the water solubility of the CA, a necessary compromise was made towards the rigidity by introducing a short poly(ethylene glycol) (PEG) linker on the newly designed DTTA ligand 5 shown in scheme 1. First, a heterobifunctionalized alkyne-terminated short PEG linker, 2, that has an amino group at the distal end, was synthesized from commercially available 2-[2-(2-chloroethoxy)ethoxy]ethanol (see supplementary information). The bis alkylation of amine 2 using bromoethylamine derivative16 3 afforded 4 in 60% yield. The tert-butyl groups on 4 were deprotected using formic acid to give the alkyne terminated DTTA ligand 5 in quantitative yield.
Scheme 1.
Synthesis of alkyne-terminated DTTA ligands.
Reagents and conditions: (a) KHCO3, DMF, 0 °C - RT, 36 h, 60%; (b) HCOOH, 65 °C, 15 h, 89%; (c) DyCl3·6H2O, pyridine, 70 °C, 15 h, 87%.
Determination of Hydration Number (q)
In general, the q value of the Gd3+ complex of DTTA is predicted to be 2; however, the PEG oxygen donor in the modified DTTA ligand 5 can partially displace the water molecules coordinated to the DTTA-Gd3+ consequently reducing the overall relaxivity of the CA.17 Thus, the q value for the newly synthesized DTTA ligand 5 was determined using the Dy3+-induced water 17O NMR shifts (d.i.s.) method.18 First, a Dy3+ complex of DTTA, 6, was synthesized in 87% yield by reacting 5 with DyCl3·6H2O in pyridine (Scheme 1). Various concentrations of complex 6 and DyCl3·6H2O over the range of 20–80 mmol dm−3 were prepared and the d.i.s. (Δδ) was measured (Figure 2). The Δδ for a complex with the general formula Dy(ligand)n(H2O)q is given by the equation Δδ = qΔ[Dy(ligand)n(H2O)q]/[H2O]. The slope of a plot of the d.i.s. versus the Dy3+ concentration is proportional to the q value of the complex. As expected the d.i.s. method gave a q value of 2 for the complex 6 (see supplementary information).
Figure 2.
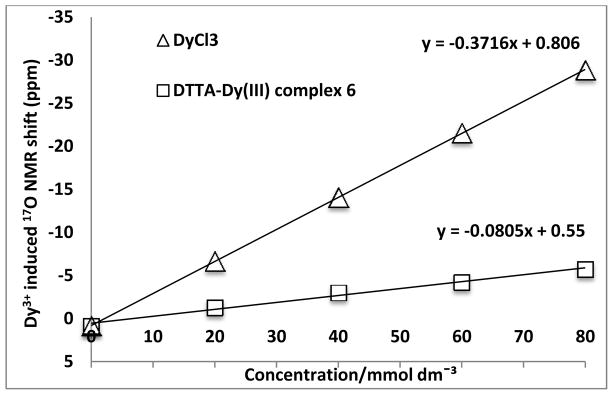
Plot of the Dy3+-induced water 17O NMR shift as a function of [Dy].
Synthesis of CA-9
The 12-fold azidoacetate closomer 7 was synthesized using the procedure previously described by us.14f The reaction of this closomer 7 with the alkyne terminated DTTA ligand 4 gave the closomer-DTTA conjugate 8 in 76% yield. The closomer 8 was purified by size-exclusion column chromatography (Lipophilic Sephadex® LH-20) using ACN as the eluent and characterized by IR, NMR and HRMS. Closomer 8 exhibited a characteristic singlet at δ 7.58 ppm in the 1H NMR spectrum that was assigned to the twelve alkene-CH protons of the twelve triazole rings. The IR spectrum of the product did not exhibit the characteristic peak at 2109 cm−1, which was attributed in closomer 7 to the asymmetric stretching of the azide group.14f
Next, closomer 8 was treated with 80% trifluoroacetic acid (TFA) in dichloromethane (DCM) to remove the tert-butyl ester protecting groups; complete deprotection was confirmed by the absence of a large singlet at δ 1.34 ppm in the 1H NMR spectrum. Subsequently, the deprotected closomer 8 was reacted with GdCl3·6H2O in a citrate buffer at pH ~7 to give closomer CA-9 in 82% yield (Scheme 2). The CA-9 was purified via exhaustive dialysis in ultrapure water and was characterized using IR and HRMS. Due to the possibility of various charged species origination during the ionization process, the mass spectrometry analysis of closomer 8 was very challenging. The IR spectrum of CA-9 exhibited the characteristic shift of the carbonyl stretch from 1736 cm−1 to 1595 cm−1, which demonstrates the complexation of Gd3+ with DTTA ligands.9a The purity of CA-9 was tested by size-exclusion HPLC (SE-HPLC) analysis, and the gadolinium loading was determined using inductively coupled plasma optical emission spectroscopy (ICP-OES), which showed the formation of essentially fully loaded chelates with average of 11.3 Gd3+ ions per closomer. The presence of any free Gd3+ ions in closomer contrast agent CA-9 was determined by spectrophotometric method using xylenol orange,19 and found to contain a negligible amount (0.003%) of free Gd3+ ions (see supplementary information).
Relaxivity Studies
The closomer CA-9 has an r1 value of 13.8 mM−1s−1 per Gd (155.9 mM−1s−1 per closomer) at 25 °C and 7 Tesla (T) in water and phosphate buffered saline (PBS) solution. This almost 300% increase in the r1 value for CA-9 over clinically employed MRI CA Omniscan® (r1 =4.2 mM−1s−1 at 7T) may be attributed to the confinement of the twelve Gd3+ ions in a sterically constrained space on the icosahedral closo-borane scaffold and the two inner-sphere water molecules (q = 2) of the Gd3+-chelate. The dynamic light scattering (DLS) analysis of CA-9 in water and PBS solution gave the average particle size of 500 nm, indicating possible aggregation of the CA-9 particles. To negate the possibility of a high r1 value due to aggregation of CA-9 in water or PBS solutions, a formulation of CA-9 in polysorbate-80, a nonionic surfactant, was prepared, which lowered its average particle size to 12 nm range (see supplementary information). The relaxivity measurements of this formulation at 7T gave an r1 value of 13.8, the same as that obtained in water and PBS solution.
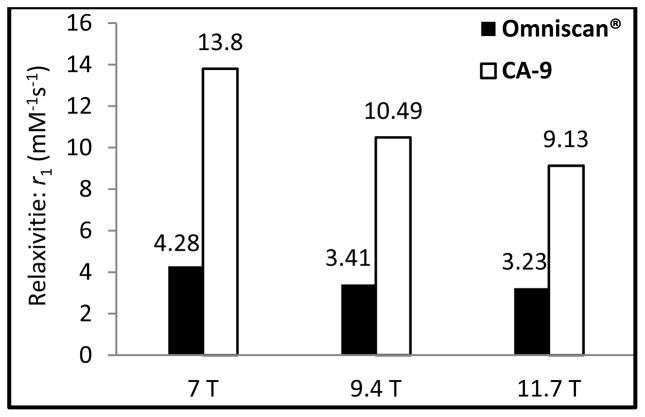
Table 1 summarizes the relaxivity profiles of some of the polyfunctional MRI CAs reported to date, and CA-9 compares very favorably. At high magnetic field strengths (figure 3), the r1 value for CA-9 follows a predictable decreasing trend, but has significantly higher r1 value than Omniscan®.
Table 1.
Comparison of the r1 of CA-9 and various polyfunctional MRI CAs reported in the literature.
| Contrast Agents | per Gd r1 (mM−1s−1) | Gd3+/molecule | Molar relaxivity |
|---|---|---|---|
| Omniscan® (7T) | 4.2 | 1 | 4.2 |
| CA-9 (7T) | 13.8 (±0.49) | 12 | 155.9† |
| [11a]Cyclodextrin-(DTTA)7 (9.4T) | 6.2 | 7 | 43.4 |
| [11b]Cyclodextrin-(DOTA)7 (1.4T) | 12.2 (±0.54) | 7 | 85.4 |
| [15b]Metallostar-(DTTA)6 (9.4T) | 8.5 | 6 | - |
Molar relaxivity is based on the actual number of Gd per closomer (~11.3) determined from an ICP-OES analysis.
Figure 3.
Comparison of the per-Gd r1 values of CA-9 and Omniscan® in PBS at high magnetic fields.
Figure 4 shows the T1-weighted MRI images of CA-9 and Omniscan® at various concentrations in PBS, clearly showing greater contrast enhancement for CA-9 even at very low Gd concentrations (0.1 mM).
Figure 4.
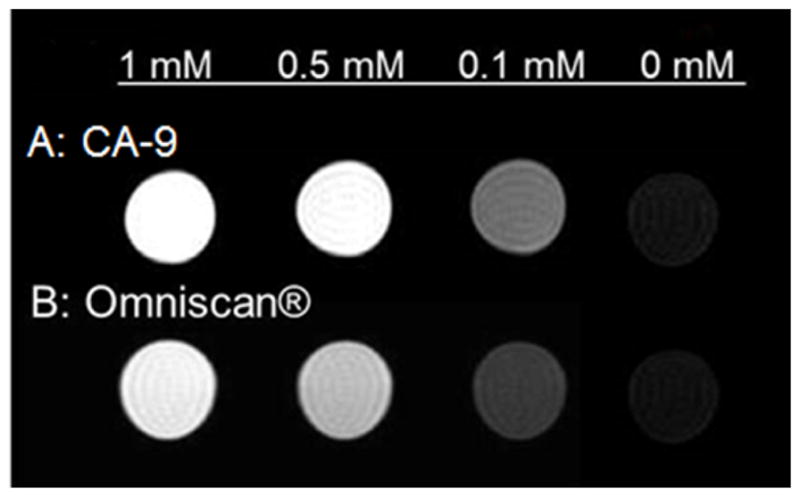
T1-weighted MR images of CA-9 at various Gd-concentrations in PBS compared with Omniscan® (at 7T).
Serum Stability
The Gd3+-DTTA based polyfunctional complexes have shown to be well tolerated by mice.20 However, detailed biostability and toxicity studies are required for their in vivo use. Our preliminary biostability study of CA-9 has shown that it is stable in bovine calf serum at physiological pH (7.4) and temperature (37 °C). Stability of CA-9 in serum was examined by using a literature procedure21, where the amount of free Gd3+ concentration is determined by measuring the ratio of relaxivities, r1(t)/r1(0), as a function of the incubation time for a serum solution of CAs at 37 °C. Essentially, any increase in the ratio of relaxivities r1(t)/r1(0) would indicate the release of free Gd3+, which occurs when the CA is unstable under the given conditions. Free Gd3+ ions have very high r1 values compared with those of chelated Gd3+. A plot of the ratio of relaxivities r1(t)/r1(0) as a function of the incubation time in serum (Figure 5) indicates that CA-9 is stable in serum at physiological pH and temperature. However, a slight decline in r1 values for CA-9 was observed after 24 h, which may be attributed to possible aggregation that may lead to the precipitation of the compound from solution over time.
Figure 5.
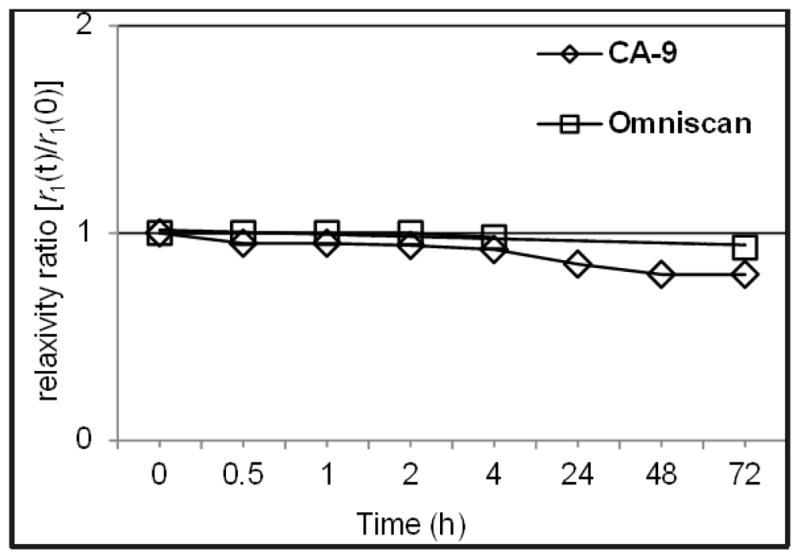
Stability plot of CA-9 and Omniscan® in serum at 37 °C showing the changes in the relaxivity ratio as a function of incubation time.
In vivo MRI studies
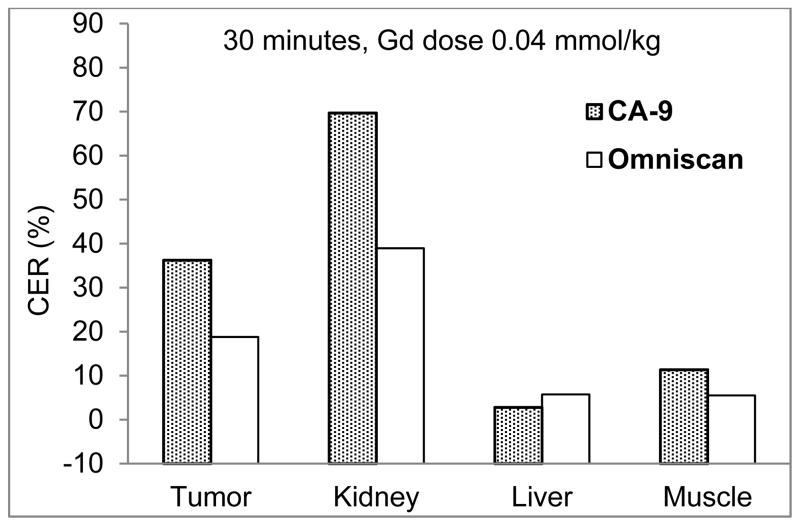
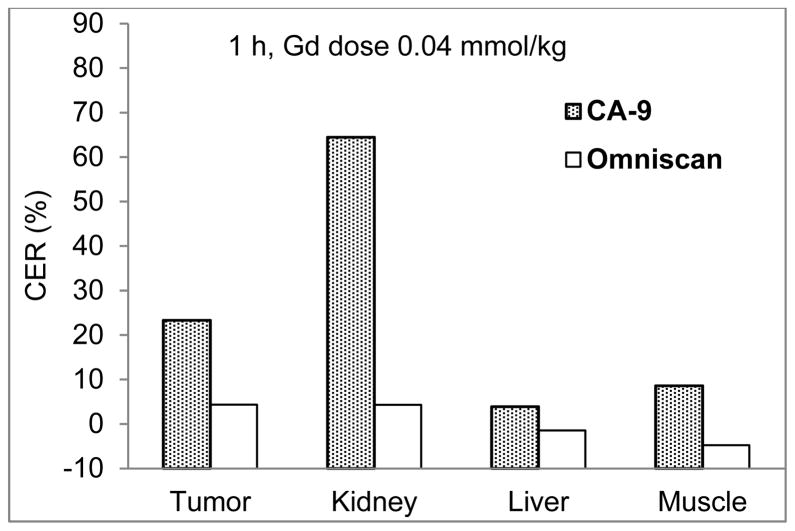
The mice were given intravenous injections of CA-9 or Omniscan® at a gadolinium dose of 0.04 mmol/kg body weight. As shown in Figure 6, tumors treated with CA-9 were strongly enhanced at 30 minutes and 1 h post injection (p.i.) (Figure 6, panel A), whereas the image intensity in tumors after the injection of Omniscan® diminishes rapidly and does not show measurable enhancement at 30 minutes and 1 h p.i. (Figure 6, panel B). Similarly, the kidneys exhibit higher intensities in mice 30 minutes p.i. of CA-9 (Figure 6, panel A) compared with those obtained using Omniscan® (Figure 6, panel B), indicating clearance of CA-9 through the kidneys. Figures 7 and 8 show the contrast enhancement ratio in various organs of mice at 30 minutes and 1 h p.i. respectively for CA-9 and Omniscan®.
Figure 6.
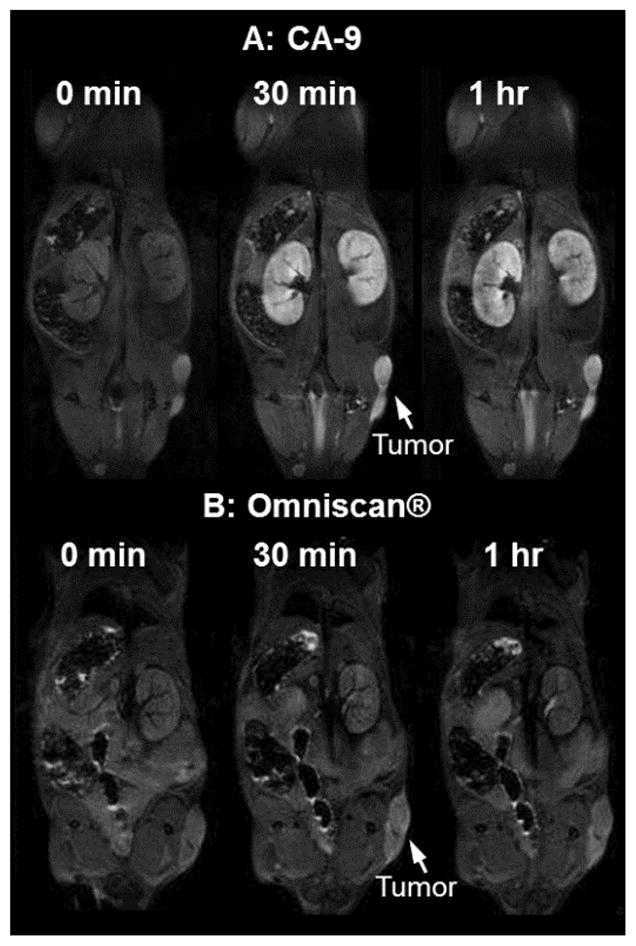
In vivo T1-weighted MRI scans of mice at 0 minute, 30 minutes and 1 h post-intravenous injection of (A) CA-9 and (B) Omniscan® with a gadolinium dose of 0.04 mmol/kg.
Figure 7.
Comparison of relative increase in contrast (Contrast Enhancement Ratio or CER) for various organs of mice at 30 minutes p.i. of CA-9 and Omniscan® (gadolinium dose of 0.04 mmol/kg).
Figure 8.
Comparison of relative increase in contrast (Contrast Enhancement Ratio or CER) for various organs of mice at 1 h p.i. of CA-9 and Omniscan® (gadolinium dose of 0.04 mmol/kg).
Long term toxicity studies of CA-9
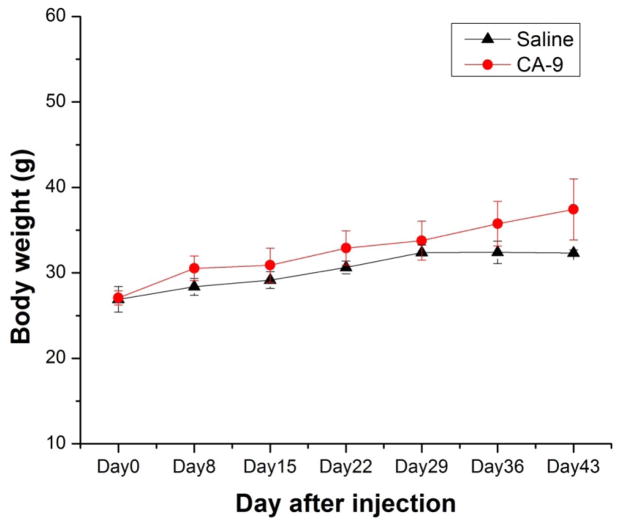
All mice, from both the experimental group (injected with 120 μL of CA-9 at gadolinium dose of 0.04 mmol/kg in saline solution) and the control group (injected with 120 μL saline), appeared healthy and normal over the entire period of six weeks. The body weights between both groups were comparable; they all showed regular weight gain each week (Figure 9). At the end of 6 weeks of observation, all mice were euthanized and tissues (including tail, blood, heart, lungs, liver, spleen, stomach, large and small intestines, kidneys, brain, muscle) were collected and analyzed for the presence of gadolinium ions using ICP-OES analysis. The analysis did not show the presence of gadolinium ions in the collected tissue samples, which indicates the complete excretion of the CA-9 over time. Accumulation of gadolinium ions in the tissues is a safety concerns for the in vivo use of any Gd3+ based CA particularly in the patients with renal dysfunction (nephrogenic systemic fibrosis or NSF).
Figure 9.
Mean body weights of CF-1 mice post injection of 120 μL of CA-9 (gadolinium dose of 0.04 mmol/kg in saline) or saline via tail vein.
CONCLUSIONS
In summary, we report a novel monodisperse, nano-sized, multimeric, high-performance MRI CA based on icosahedral closo-borane architecture. CA-9 is water-soluble, carry up to twelve Gd3+-chelates tightly in a sterically confined space and is stable in serum at physiological pH (7.4) and temperature (37°C). This unique configuration exhibits exceptionally high relaxivity value (per Gd relaxivity, r1 = 13.8 mM−1s−1, per molecule r1 = 155.9 mM−1s−1 at 7T in water or PBS). Serial T1-weighted in vivo MR images of mice bearing human PC-3 prostate cancer xenografts, after the intravenous injection of CA-9, show enhanced contrast in tumor and kidneys compared with Omniscan® even at one-seventh of the safe clinical dose (0.04 mmol/kg) without any apparent toxicity. High relaxivity values and the persistent contrast enhancing effect of CA-9 for up to 1 h allow for a longer acquisition time window that may be useful in increasing both the signal-to-noise ratio and/or the image resolution during MRI procedures. The closomer synthesis methodology presented here is very versatile and can easily be adapted to other ligand types such as DTPA and DOTA ligands coupled with biological receptor-specific targeting moieties. In the accompanying article we describe the synthesis and biological evaluation of a cell-targeted high performance closomer CA carrying a DOTA ligand.
EXPERIMENTAL SECTION
General information
Common reagents and chromatographic solvents were obtained from commercial suppliers (Sigma-Aldrich, Fisher Scientific and Acros Organics) and used without any further purification. Lipophilic Sephadex® LH-20 was obtained from GE Healthcare. NMR spectra were recorded on Bruker DRX 300 MHz and Bruker Avance 400 and 500 MHz spectrometers. All NMR chemical shifts (δ) are reported in parts per million (ppm). The high-resolution mass spectrometry analysis was performed using an Applied Biosystems Mariner ESI-TOF. Mass analysis of CA-9 (dissolved in water) was performed on a Q-TOF instrument using ESI mode and long integration time. IR spectra were recorded on a Thermo Nicolet FT-IR spectrometer. The dynamic light scattering analysis was performed on Microtrac’s Zetatrac particle size analyzer. Gd concentrations of the samples used in MRI experiments were measured by inductively coupled plasma optical emission spectroscopy (ICP-OES) using a PekinElmer OptimaTM 7000 DV instrument.
Abbreviations
N,N′-dimethylformamide (DMF), triethylamine (Et3N), sodium sulfate (Na2SO4), sodium hydride (NaH), potassium hydrogen carbonate (KHCO3) tetrahydrofuran (THF), dichloromethane (DCM), ethyl acetate (EtOAc), acetonitrile (ACN), ammonium chloride (NH4Cl), methanol (MeOH), hydrochloric acid (HCl), N,N-diisopropylethylamine (DIPEA), room temperature (RT), diethylenetriaminetetraacetic acid (DTTA), trifluoroacetic acid (TFA), phosphate-buffered saline (PBS), molecular weight cut-off (MWCO), and hours (h).
Synthesis of tert-Butyl-6-(2-(bis(2-(tert-butoxy)-2-oxoethyl)amino)ethyl)-3-(2-(tert-butoxy)-2-oxoethyl)-9,12,15-trioxa-3,6-diazaoctadec-17-yn-1-oate (4)
A suspension of 2 (1.40 g, 7.50 mmol) and KHCO3 (2.30 g, 22.4 mmol) in DMF (40 mL) was placed in an ice bath and 3 (6.60 g, 18.7 mmol) dissolved in DMF (15 mL) was added to it over 3 h. The reaction mixture was allowed to warm to RT and stirred under an atmosphere of argon for 36 h. The reaction mixture was treated with a 3:2 mixture of ethyl acetate and water. The product was extracted in the organic layer and washed with brine, dried over Na2SO4 and concentrated to obtain dark yellow viscous oil. Purification using column chromatography yielded the product as a light yellow colored viscous oil (3.30 g, 60%). 1H NMR (400 MHz, CDCl3): δ 3.93 (d, J = 2.3 Hz, 2H), 3.44-3.39 (m, 4H), 3.38-3.32 (m, 4H), 3.27 (t, J = 7.1 Hz, 2H), 3.17 (s, 8H), 2.54 (t, J = 7.8 Hz, 4H), 2.45 (t, J = 6.1 Hz, 2H), 2.40 (t, J = 6.3 Hz, 4H), 2.26 (t, J = 2.3 Hz, 1H); 13C NMR (100 MHz, CDCl3): δ 170.27 (4C), 80.28 (4C), 79.41, 74.46, 70.25, 70.09, 70.07, 69.44, 68.74, 57.98, 55.89 (2C), 53.72, 53.42, 51.87, 27.93 (12C). HRMS (m/z): Calcd. for C37H67N3O11 [M+H]+ 730.4854. Found 730.5893.
Synthesis of 6-(2-(bis(carboxymethyl)amino)ethyl)-3-(carboxymethyl)-9,12,15-trioxa-3,6-diazaoctadec-17-yn-1-oic acid (5)
A solution of 4 (1.30 g, 1.80 mmol) in formic acid (50 mL, 90%) was stirred for 15 h at 65 °C and then concentrated under reduced pressure. The residue was dissolved in a minimal amount of MeOH, and the crude product was precipitated by adding ether. Yield: 0.90 g (89%). 1H NMR (400 MHz, CD3OD): δ 4.21 (d, 2H, J = 2.4 Hz), 3.87 (m, 2H), 3.70-3.66 (m, 16H), 3.50 (m, 3H), 3.42 (m, 4H), 3.27 (m, 4H), 2.91 (t, 1H, J = 2.4 Hz). HRMS (m/z): Calcd. for C21H35N3O11 [M+H]+ 506.2350. Found: 506.2003.
Synthesis of 6-(2-(bis(carboxymethyl)amino)ethyl)-3-(carboxymethyl)-9,12,15-trioxa-3,6-diazaoctadec-17-yn-1-oic acid-Dysprosium(III) complex (6)
A mixture of 5 (0.35 g, 0.69 mmol) and dysprosium chloride (0.25 g, 0.69 mmol) in pyridine (25 mL) was stirred for 15 h at 70 °C. The solvent was removed under vacuum and the residue was dissolved in a minimum amount of ethanol and passed through a celite pad to remove any solid present. Ether was added to precipitate an off-white powder which was then filtered, washed with ether and dried to obtain the product as a white solid. Yield: 0.40 g (87%). M.P.: 215 °C (decomposed). HRMS (ESI) m/z for C21H31DyN3O11 [M]− calcd 665.1250, found 665.1483.
Synthesis of Closomer 8
A mixture of 12-fold Azidoacetate Closomer 7 (0.10 g, 0.06 mmol) and DTTA ligand 4 (2.40 g, 3.30 mmol) was dissolved in ACN-THF (30 mL, 50:50 mixture). To this mixture, DIPEA (0.85 g, 6.60 mmol) and copper (I) iodide (0.13 g, 0.66 mmol) were added and the resulting mixture was stirred for 3 days at RT under an argon atmosphere. The reaction mixture was then concentrated to dryness and the residue was redissolved in DCM and filtered. The filtrate was washed with an aqueous 2% ethylenediaminetetraacetic acid disodium salt (EDTA.2Na) solution and the organic layer was separated, dried and concentrated. The closomer 8 was purified via size-exclusion chromatography over Lipophilic Sephadex® (LH-20) using ACN as eluent. Yield: 0.42 g (76%), obtained as viscous oil. 1H NMR (400 MHz, CD3CN): δ 7.58 (s, 12H), 4.84 (s, 24H), 4.52 (s, 24H), 3.54-3.43 (m, 125H), 3.32 (m, 98H), 2.68-2.55 (m, 117H), 1.34 (m, 444H). 13C NMR (100 MHz, CD3CN): δ 171-64, 166.55, 145.32, 125.82, 81.44, 70.97, 70.23, 64.70, 56.88, 54.64, 54.21, 52.79 and 28.43. 11B NMR (128 MHz, CD3CN): δ 18.07. HRMS (ESI) m/z for C468H828B12N72O156 [M]+ calcd 10083.6210, found 2522.2649 [M]4+
Synthesis of CA-9
Closomer 8 (0.20 g, 0.02 mmol) was treated with 80% TFA/DCM (10 mL) for 4 h at RT under an argon atmosphere. The reaction mixture was concentrated under reduced pressure and the resulting residue was dissolved in a minimum amount of methanol and precipitated by adding ether. The solid was filtered, washed with ether and dried under high vacuum overnight. It was then dissolved in 1M citrate buffer (15 mL, pH-7) and added to to a solution of GdCl3.6H2O (0.44 g, 1.19 mmol) in 15 mL of 1M citrate buffer over 5 h at RT with vigorous stirring. The pH of the reaction mixture was maintained at approximately 7 using 0.3 N NaOH. The reaction mixture was stirred for additional 12 h at RT and was sonicated a few times during the course of the reaction. The reaction mixture was then dialyzed in deionized water for 2 days using 1,000 MWCO membrane tubes (Spectra/Por®). The product CA-9 was obtained as an off-white solid after lyophilization. Yield: 0.15 g (82%). M.P.: 265 °C (decomposed). HRMS (ESI) m/z for C276H408B12Gd12N72O156 [M3−+Na+K] calcd 3146.5606, found 3146.6066. ICP-OES analysis for Gd calcd 12, found 11.3.
Relaxivity Studies
Relaxivity measurements in serum and in PBS buffer were performed using a 7 Tesla Varian Unity Inova MRI system (Varian Inc./Agilent Technologies) and Bruker Avance 400 and 500 MHz spectrometers at room temperature. The solutions of closomer contrast agent CA-9 were prepared in serum and in PBS buffer at varied Gd(III) ion concentrations of 1 mM, 0.5 mM and 0.25 mM. For comparison, T1 relaxation (r1) rates of 1 mM solution of the clinical MRI CA Omniscan in PBS buffer and in serum as well as serum blank samples and PBS buffer blank samples were measured in the same experiment. A T1-weighted MRI (T1W-MRI) pulse sequence was applied with TE = 15 ms, and TR = 500 ms, slice thickness = 1 mm, matrix = 256 × 256, and FOV = 30 × 30 mm. A series of inversion recovery (IR) spin-echo images were acquired using TR = 3 s, TE = 15 ms, and following inversion delays: 0.082, 0.1, 0.12, 0.16, 0.24, 0.32, 0.64, 1.28, 2.56, 3.6 s. The water signal intensities were measured using the VnmrJ software (Varian Inc./Agilent Technologies). The relaxation rates were calculated using a three-parameter experiential recovery fitting in Origin8 (OriginLab Corporation).
In vivo MRI studies
In vivo MRI studies of closomer CA-9 were performed in SCID (severely compromised immunodeficient) mice bearing human PC-3 prostate cancer xenografts. Four to five week old ICR SCID outbred mice were obtained from Taconic (Germantown, NY). Mice were housed four animals per cage in sterile micro isolator cages in a temperature- and humidity-controlled room with a 12-hour light/12-hour dark schedule. The animals were fed autoclaved rodent chow (Ralston Purina Company, St. Louis, MO) and water ad libitum. All animal studies were conducted in accordance with the highest standards of care as outlined in the NIH guide for ‘Care and Use of Laboratory Animals and the Policy and Procedures for Animal Research’ at the Harry S. Truman Memorial Veterans’ Hospital. Mice were inoculated with human prostate cancer PC-3 tumor cells on the right flank; average body weight was between 25–30 grams at the time of MRI.
All MRI experiments were performed on a 7T Varian Unity Inova MRI equipped with a Millipede quadrature RF coil (40 mm ID). A T1 weighted multi-slice spin echo sequence was performed to record sequential images pre and post injection of CAs. The animals were injected with 120 μL (10mM Gd) of CA (in 2% Tween-80 in PBS) via the tail vein and imaged immediately. The mice were again imaged at 2, 4, and 24 h post injection time points. Vitals were continually monitored and mice were released to their cage after each imaging session in order to fully recover. Mice were then euthanized for tissue collection. Organs (including tail, tumor, blood, heart, lungs, liver, spleen, stomach, large intestine, small intestine, kidney, brain, muscle) were collected for ICP-OES analysis of gadolinium and boron concentrations.
Image Analysis
Image analysis and processing were performed with VnmrJ software (Varian/Agilent Technologies). A water tube placed under the animal was treated as a reference signal. Regions of interest (ROIs) were manually drawn on the tumor tissue, kidney cortex, liver, and the muscle tissue near the tumor for each time point. Signal intensity (SI) was measured as the mean of the intensity over the segmented ROI. SIs were normalized according to the signal intensity of the muscle assuming the enhancement of signal of the muscle tissue is zero 2 h post injection of CAs. The contrast enhancement ratio (CER) was calculated according to:
Long term toxicity studies
Six CF-1 female mice (Charles River), 6 weeks old, were randomly assigned to two groups. Group one, as a placebo control group consisting of three mice, was injected with 120 μL saline (bacteriostatic 0.9% Sodium Chloride) via the tail vein. Group two, also consisting of three mice, was injected with 120 μL of CA-9 at a gadolinium dose of 0.04 mmol/kg body weight in saline solution via the tail vein. Mice were provided water and food ad lib. The mice were observed for health status and behavior three times a week. Body weight was measured once every week. At the end of 6 weeks of observation, all mice were euthanized and tissues were immediately collected. Organs (including tail, blood, heart, lungs, liver, spleen, stomach, large and small intestines, kidneys, brain, muscle) were collected, and weighed for ICP-OES analysis of gadolinium concentration.
Supplementary Material
Acknowledgments
This research was funded by National Cancer Institute (Grant R21-CA114090). We acknowledge the support provided by the Veterans’ Affairs Biomolecular Imaging Center at the Harry S. Truman VA Hospital and the University of Missouri-Columbia. Authors thank Brett Meers, Sarah Higdon, Lisa Watkinson and Terry Carmack for technical assistance.
Footnotes
ASSOCIATED CONTENTS
Supporting information contains synthesis and characterization data for compound 2 and 3, experimental details for determination of hydration number (q) for ligand 5 and estimation of the free Gd3+ ions present in CA-9. Copies of IR, HPLC and dynamic light scattering data for CA-9 are also provided. This material is available free of charge via the Internet at http://pubs.acs.org.
References
- 1.Mansfield P. Angew Chem Int Ed. 2004;43:5456–5464. doi: 10.1002/anie.200460078. [DOI] [PubMed] [Google Scholar]
- 2.Lauffer RB. Chem Rev. 1987;87:901–927. [Google Scholar]
- 3.Hermann P, Kotek J, Kubíček V, Lukeš I. Dalton Trans. 2008:3027–3047. doi: 10.1039/b719704g. [DOI] [PubMed] [Google Scholar]
- 4.Caravan P, Ellison JJ, McMurry TJ, Lauffer RB. Chem Rev. 1999;99:2293–2352. doi: 10.1021/cr980440x. [DOI] [PubMed] [Google Scholar]
- 5.(a) Werner EJ, Datta A, Jocher CJ, Raymond KN. Angew Chem Int Ed. 2008;47:8568–8580. doi: 10.1002/anie.200800212. [DOI] [PubMed] [Google Scholar]; (b) Yang CT, Chuang KH. Med Chem Comm. 2012;3:552–565. [Google Scholar]; (c) Botta M, Tei L. Eur J Inorg Chem. 2012;2012:1945–1960. [Google Scholar]
- 6.(a) Idée J, Port M, Medina C, Lancelot E, Fayoux E, Ballet S, Corot C. Toxicology. 2008;248:77–88. doi: 10.1016/j.tox.2008.03.012. [DOI] [PubMed] [Google Scholar]; (b) Caravan P. Acc Chem Res. 2009;42:851–862. doi: 10.1021/ar800220p. [DOI] [PubMed] [Google Scholar]
- 7.(a) Laurent S, Elst VL, Muller RN. Contrast Med Mol Imaging. 2006;1:128–137. doi: 10.1002/cmmi.100. [DOI] [PubMed] [Google Scholar]; (b) Lauffer RB, Brady TJ. Magn Reson Imaging. 1985;3:11–16. doi: 10.1016/0730-725x(85)90004-9. [DOI] [PubMed] [Google Scholar]
- 8.(a) Solomon I. Phys Rev. 1955;99:559–565. [Google Scholar]; (b) Bloembergen N. J Chem Phys. 1957;27:572–573. [Google Scholar]; (c) Aime S, Botta M, Fasano M, Terreno E. Chem Soc Rev. 1998;27:19–29. [Google Scholar]
- 9.(a) Langereis S, de Lussanet QG, van Genderen MHP, Backes WH, Meijer EW. Macromolecules. 2004;37:3084–3091. [Google Scholar]; (c) Torchilin V, Babich J, Weissig V. J Liposome Res. 2000;10:483–499. [Google Scholar]; (d) Mohs AM, Wang X, Goodrich KC, Zong Y, Parker DL, Lu Z-R. Bioconjugate Chem. 2004;15:1424–1430. doi: 10.1021/bc049828r. [DOI] [PubMed] [Google Scholar]; (e) Kielar F, Tei L, Terreno E, Botta M. J Am Chem Soc. 2010;132:7836–7837. doi: 10.1021/ja101518v. [DOI] [PubMed] [Google Scholar]; (b) Floyd WC, Klemm PJ, Smiles DE, Kohlgruber AC, Pierre VC, Mynar JL, Fréchet JMJ, Raymond KN. J Am Chem Soc. 2011;133:2390–2393. doi: 10.1021/ja110582e. [DOI] [PMC free article] [PubMed] [Google Scholar]; (c) De León-Rodríguez LM, Lubag A, Udugamasooriya DG, Proneth B, Brekken RA, Sun X, Kodadek T, Sherry AD. J Am Chem Soc. 2010;132:12829–12831. doi: 10.1021/ja105563a. [DOI] [PMC free article] [PubMed] [Google Scholar]
- 10.Langereis S, Dirksen A, Hackeng TM, Van Genderen MHP, Meijer EW. New J Chem. 2007;31:1152–1160. [Google Scholar]
- 11.(a) Bryson JM, Chu W, Lee J, Reineke TM. Bioconjugate Chem. 2008;19:1505–1509. doi: 10.1021/bc800200q. [DOI] [PubMed] [Google Scholar]; (b) Song Y, Kohlmeir EK, Meade TJ. J Am Chem Soc. 2008;130:6662–6663. doi: 10.1021/ja0777990. [DOI] [PMC free article] [PubMed] [Google Scholar]; (c) Livramento JB, Helm L, Sour A, O’Neil C, Merbach AE, Tóth É. Dalton Trans. 2008:1195–1202. doi: 10.1039/b717390c. [DOI] [PubMed] [Google Scholar]
- 12.(a) Hawthorne MF, Maderna A. Chem Rev. 1999;99:3421–3434. doi: 10.1021/cr000001+. [DOI] [PubMed] [Google Scholar]; (b) Hawthorne MF, Farha OK, Julius R, Ma L, Jalisatgi SS, Li T, Bayer MJ. ACS Symp Ser. 2005;917:312–324. [Google Scholar]
- 13.Bayer MJ, Hawthorne MF. Inorg Chem. 2004;43:2018–2020. doi: 10.1021/ic030289w. [DOI] [PubMed] [Google Scholar]
- 14.(a) Maderna A, Knobler CB, Hawthorne MF. Angew Chem Int Ed Engl. 2001;40:1662–1664. doi: 10.1002/1521-3773(20010817)40:16<2947::AID-ANIE33332947>3.0.CO;2-X. [DOI] [PubMed] [Google Scholar]; (b) Li T, Jalisatgi SS, Bayer MJ, Maderna A, Khan SI, Hawthorne MF. J Am Chem Soc. 2005;127:17832–17841. doi: 10.1021/ja055226m. [DOI] [PubMed] [Google Scholar]; (c) Farha OK, Julius RL, Lee MW, Huertas RE, Knobler CB, Hawthorne MF. J Am Chem Soc. 2005;127:18243–18251. doi: 10.1021/ja0556373. [DOI] [PubMed] [Google Scholar]; (d) Lee MW, Farha OK, Hawthorne MF, Hansch C. Angew Chem Int Ed. 2007;46:3018–3022. doi: 10.1002/anie.200605126. [DOI] [PubMed] [Google Scholar]; (e) Jalisatgi SS, Kulkarni VS, Tang B, Houston ZH, Lee MW, Hawthorne MF. J Am Chem Soc. 2011;133:12382–12385. doi: 10.1021/ja204488p. [DOI] [PMC free article] [PubMed] [Google Scholar]; (f) Goswami LN, Chakravarty S, Lee MW, Jalisatgi SS, Hawthorne MF. Angew Chem Int Ed. 2011;50:4689–4691. doi: 10.1002/anie.201101066. [DOI] [PMC free article] [PubMed] [Google Scholar]
- 15.(a) Costa J, Ruloff R, Burai L, Helm L, Merbach AE. J Am Chem Soc. 2005;127:5147–5157. doi: 10.1021/ja0424169. [DOI] [PubMed] [Google Scholar]; (b) Livramento JB, Tóth É, Sour A, Borel A, Merbach AE, Ruloff R. Angew Chem Intl Ed. 2005;14:1480–1484. doi: 10.1002/anie.200461875. [DOI] [PubMed] [Google Scholar]; (c) Livramento JB, Sour A, Borel A, Merbach AE, Tóth É. Chem Eur J. 2006;12:989–1003. doi: 10.1002/chem.200500969. [DOI] [PubMed] [Google Scholar]; (d) Ruloff R, Van Koten G, Merbach AE. Chem Commun. 2004:842–843. doi: 10.1039/b400169a. [DOI] [PubMed] [Google Scholar]; (e) Costa J, Tóth É, Helm L, Merbach AE. Inorg Chem. 2005;44:4747–4755. doi: 10.1021/ic0500309. [DOI] [PubMed] [Google Scholar]; (f) Aime S, Calabi L, Cavallotti C, Gianolio E, Giovenzana GB, Losi P, Maiocchi A, Palmisano G, Sisti M. Inorg Chem. 2004;43:7588–7590. doi: 10.1021/ic0489692. [DOI] [PubMed] [Google Scholar]; (g) Raymond KN, Pierre VC. Bioconjugate Chem. 2005;16:3–8. doi: 10.1021/bc049817y. [DOI] [PubMed] [Google Scholar]
- 16.Williams MA, Rapoport H. J Org Chem. 1993;58:1151. [Google Scholar]
- 17.Doble DM, Botta M, Wang J, Aime S, Barge A, Raymond KN. J Am Chem Soc. 2001;123:10758–10759. doi: 10.1021/ja011085m. [DOI] [PubMed] [Google Scholar]
- 18.Djanashvili K, Peters JA. Contrast Media Mol Imaging. 2007;2:67–71. doi: 10.1002/cmmi.132. [DOI] [PubMed] [Google Scholar]
- 19.Barge A, Cravotto G, Gianolio E, Fedeli F. Contrast Med Mol Imaging. 2006;1:184–188. doi: 10.1002/cmmi.110. [DOI] [PubMed] [Google Scholar]
- 20.Livramento JB, Weidensteiner C, Prata MIM, Allegrini PR, Geraldes CFGC, Helm L, Kneuer R, Merbach AE, Santos AC, Schmidt P, Tóth É. Contrast Media Mol Imaging. 2006;1:30–39. doi: 10.1002/cmmi.92. [DOI] [PubMed] [Google Scholar]
- 21.Jung K, Kim H, Lee GH, Kang D, Park J, Kim KM, Chang Y, Kim T. J Med Chem. 2011;54:5385–5394. doi: 10.1021/jm2002052. [DOI] [PubMed] [Google Scholar]
Associated Data
This section collects any data citations, data availability statements, or supplementary materials included in this article.


