

Abstract
Background
The presence and severity of coronary artery calcified plaque (CAC) differs markedly between individuals of African and European descent, suggesting that admixture mapping (AM) may be informative for identifying genetic variants associated with subclinical cardiovascular disease (CVD).
Methods and Results
AM of CAC was performed in 1,040 unrelated African Americans with type 2 diabetes mellitus from the African American-Diabetes Heart Study (AA-DHS), Multi-Ethnic Study of Atherosclerosis (MESA), and Family Heart Study (FamHS) using the Illumina custom ancestry informative marker (AIM) panel. All cohorts obtained computed tomography scanning of the coronary arteries using identical protocols. For each AIM, the probability of inheriting 0, 1, and 2 copies of a European-derived allele was determined. Linkage analysis was performed by testing for association between each AIM using these probabilities and CAC, accounting for global ancestry, age, gender and study. Markers on 1p32.3 in the GLIS1 gene (rs6663966, LOD=3.7), 1q32.1 near CHIT1 (rs7530895, LOD=3.1), 4q21.2 near PRKG2 (rs1212373, LOD=3.0) and 11q25 in the OPCML gene (rs6590705, LOD=3.4) had statistically significant LOD scores, while markers on 8q22.2 (rs6994682, LOD=2.7), 9p21.2 (rs439314, LOD=2.7), and 13p32.1 (rs7492028, LOD=2.8) manifested suggestive evidence of linkage. These regions were uniformly characterized by higher levels of European ancestry associating with higher levels or odds of CAC. Findings were replicated in 1,350 AAs without diabetes and 2,497 diabetic European Americans from MESA and the Diabetes Heart Study.
Conclusions
Fine mapping these regions will likely identify novel genetic variants that contribute to CAC and clarify racial differences in susceptibility to subclinical CVD.
Keywords: ancestry, cardiovascular disease risk factors, type 2 diabetes, admixture mapping
Introduction
Despite similar or more detrimental cardiovascular disease (CVD) risk factor profiles, African Americans (AAs) have markedly lower levels of coronary artery calcified atherosclerotic plaque (CAC), relative to European Americans (EAs)1, 2. This observation is consistent in persons with and without type 2 diabetes mellitus (T2DM)3, 4 and suggests that CVD risk factors have differential impacts on atherosclerosis based upon ethnicity. The underlying cause(s) of ethnic differences in CAC are not well understood and likely reflect the interplay between multiple genetic and non-conventional CVD risk factors5. Wassel et al.6 reported positive association between CAC in AAs and proportion of European ancestry. We performed admixture mapping in 1,040 AAs with T2DM to determine genomic regions contributing to ethnic differences in subclinical CVD. T2DM led to higher levels of CAC with the potential for improved power to better discriminate susceptible individuals. Regional admixture mapping (RAM) or mapping by admixture linkage disequilibrium (MALD), is a gene mapping tool used to identify genetic variants associated with differences in prevalence and/or distribution of a trait between two or more ancestral populations7. The premise of RAM is that if a genetic variant underlies ethnic differences in disease then it will be easier to map the location of that variant in a recently admixed population relative to panmictic ancestral populations. The proportion of alleles at the marker locus that have ancestry from the high-risk population will be higher in affected individuals then expected by chance, assuming no other influential evolutionary forces (genetic selection or drift).
RAM successfully identified disease genes or loci involved in various complex traits and diseases8–10. Recent methodological developments revealed that combining admixture mapping and genetic association testing can lead to improved power11.
Materials and Methods
Subjects
The discovery data were pooled from three study cohorts where CAC was quantified by cardiac computed tomography (CT) using identical protocols12. Statistical analyses included 1,040 unrelated individuals; 22 samples were removed because they failed quality control (QC).
African American-Diabetes Heart Study (AA-DHS)
The AA-DHS contained AAs with T2DM recruited from two Wake Forest School of Medicine (WFSM) studies: the Diabetes Heart Study (DHS) and African American-DHS. DHS is a cross-sectional study of EA and AA families with siblings concordant for T2DM. AA-DHS started after DHS and enrolled only unrelated AAs. AA-DHS objectives were to improve understanding of the striking ethnic differences in CAC observed between AAs and EAs. T2DM was diagnosed after the age of 30 years in the absence of diabetic ketoacidosis. The DHS “family of studies” is described in Bowden et al.13. Subjects who underwent prior coronary artery bypass surgery were not included in the MALD analysis, as the CAC mass score could be impacted14. Those with prior myocardial infarction or stroke were included. The final analysis included 635 unrelated AAs obtained by selecting all AA-DHS participants and one AA from each of 150 DHS sibpairs (the sibling with the most complete phenotypic data and best kidney function). The study was approved by the WFSM Institutional Review Board; all participants provided written informed consent.
Multi-Ethnic Study of Atherosclerosis (MESA)
MESA investigates the prevalence, correlates, and progression of subclinical CVD15. Recruitment was restricted to diabetic and non-diabetic individuals free of clinical CVD. The cohort included participants with previously and newly diagnosed diabetes. Data for this analysis were collected at baseline, with exception of HbA1c collected at exam 2. MESA contributed data on 302 unrelated AA participants.
Family Heart Study (FamHS)
A substudy of the Family Heart Study (FamHS) was conducted to obtain cardiac CT scans for CAC16. University of Alabama in Birmingham recruited AAs, some with T2DM. For this analysis, individuals with coronary artery bypass surgery were excluded. FamHS contributed data on 103 unrelated AA participants.
Replication and validation efforts were conducted using existing genome-wide association (GWAS) data in MESA SHARe and in the European-American DHS study. The MESA SHARe data came from 1,350 non-diabetic AAs and 2,497 diabetic EAs. The diabetic AAs were included in our discovery sample. Analyses in DHS were conducted on 920 EAs with T2D.
In summary, analyses were performed on 1,040 unrelated AAs with T2DM, 1,350 unrelated AAs without diabetes and 3,417 EAs with T2D. MESA diabetic EA participants were also unrelated.
Genotyping of ancestry informative marker selection
DNA was extracted from peripheral blood using PureGene system (Gentra Systems, Minneapolis, MN). The streamlined panel of 1,509 ancestry informative markers (AIMs) was typed using the Illumina AA admixture panel covering all 22 autosomes and chromosome X; analyses were restricted to autosomes.
Vascular Imaging
Calcified plaque was measured in the coronary arteries using single and multidetector CT systems incorporating a standardized scanning protocol based on the National Heart Lung and Blood Institute’s MESA17. Traditionally, the Agatston or Calcium score was reported. However, this scoring system adds noise to CT measurement of CP, compared to volume-based measures. We use the calcium mass score (SmartScore, General Electric [GE] Healthcare, Waukesha, WI) derived from the volume score, but also accounting for the density of CP on a pixel-by-pixel basis. Additional scoring parameters included a 90 Hounsfield Unit (H.U.) threshold and 2 adjacent pixels to define the maximum calcified lesion size and the program accounted for slice thickness.
Quality control
Quality control (QC checks similar to those performed in a GWAS were run before performing the main analyses. Twenty-nine SNPs were flagged because Hardy-Weinberg equilibrium testing had p-values <10−3, and 2 additional SNPs were flagged because their call rate was <98% (none showed a significant result). Six individuals with call rates <90% were dropped. We dropped one individual with a heterozygosity score outside the mean ± 4 times standard error (SE) confidence interval. There was no indication of first degree familial relationships in the analyzed dataset. The estimated kinship coefficient ranged between 0 and 0.13. Lower levels of familial relationship would be harder to detect with the small number of markers. We did not pursue evaluation of familial relationships further.
Statistical methods
The RAM model that we applied is described in Redden et al.18. Briefly, for the ith individual, let Yi denote the phenotype of interest, let P1i and P2i represent the ancestry of proportions of this individual’s parents and finally, let I(Gij= k) denote dummy variables indicating whether this individual has inherited exactly k copies of a particular allele from an ancestral population at the jth marker. The RAM model can be written as:
| (1) |
where f( ) is the appropriate link function, and Ai is the individual ancestry (average of P1i and P2i the ancestry proportion of the 2 parents of the ith individual). Note that P1i and P2i do not have to be observed in order to fit this model. First, existing software will only provide an estimate of Ai. Second, the product of parental ancestries can be estimated based on the individual genotype (Redden et al. contains details on a maximum likelihood estimate of (P1i P2i) that can be obtained without parental genotypes)18. Third, when the two parents have similar ancestry proportion, as it is likely the case under assortative mating where ancestry is closely linked with socioeconomic status, we have . We used ADMIXMAP19 to compute these estimates. ADMIXMAP used a combination of Bayesian and classical approaches to fit a multilevel model for the distribution of individual ancestry proportion in the population and the stochastic variation of ancestry on hybrid chromosomes.
In practice, I(Gij = k) where k=0, 1 or 2 and will not be available; however, the probability of inheriting exactly 0, 1 or 2 alleles from a specific ancestral population can be estimated. These probabilities are identity by descent (IBD) probabilities; therefore, equation (1) allows for testing for linkage controlling for individual and parental ancestries20, 21. This model can be fitted easily using standard statistical packages, facilitating inclusion of covariates and interaction effects. Details regarding the computation of these probabilities based on the observed genotypes and the estimated individual ancestry proportions are in the appendix. We use logarithm of odds (LOD) scores to present evidence against the null hypothesis to reinforce the idea that we are performing linkage analysis.
Analyses were run using Log(CAC+1)as a continuous trait and CAC dichotomized (individuals with CAC ≥10 treated as cases and CAC <10 as controls). This is justified based on the assumption that factors governing presence of CAC may differ from those influencing amount of CAC once calcification is initiated22. Age, gender and study were included as covariates in Equation 1. Supplementary Table 1 suggests the distribution of Hb1Ac, BMI, smoking status and use of lipid-lowering medication were statistically different among the three studies. However, the model adjusted for age, gender and study allowed to us to capture these differences.
Significant effect and correction for multiple testing
We excluded chromosome X from our analyses; therefore, the MALD analyses were run on 1,426 SNPS. A strict Bonferroni correction would place the significance threshold at 3.5×10⁻⁵ for a two-sided test, an excessively conservative threshold. We chose to prioritize AIMs that reached a LOD score of 2.5 corresponding to an alpha level of 7 × 10⁻⁴. This approach can be viewed as somewhat conservative for identifying suggestive evidence of linkage. Following Reich and Patterson’s recommendation23, we also repeated the analyses using the software ANCESTRYMAP24. The results were similar to our unadjusted analyses and are not discussed further.
Fine mapping
To confirm the preliminary results, additional mapping was performed using a sparse set of markers located on 3 chromosomal regions: 1p32.3, containing the largest LOD score (LOD=3.7); 9p21.2 with a LOD of 2.7 and strong prior evidence of involvement in coronary artery disease; and 11p15.4 with suggestive evidence of linkage (LOD score=2.5), the lowest LOD score considered suggestive. SNPs for fine mapping were selected from HapMap rel27 with preference given to AIMs with a delta-value of 0.5 or greater. We used an r-squared threshold of 0.3 to minimize the LD among the 53 selected SNPs. Pairwise linkage disequilibrium (LD) between markers was evaluated using Haploview25. Genotyping was performed using the MassARRAY SNP Genotyping System (Sequenom Inc., San Diego, CA)26. SNP genotyping was >94.4% efficient and 71 blind duplicates were 99.8% concordant. QC checks similar to those described herein identified two SNPs with Hardy-Weinberg equilibrium test p-values <10−3. These analyses were conducted in the discovery sample. Results obtained with these SNPs are shown in Supplementary Tables 5a, 5b and 5c.
Additional analyses in MESA
Approximately, one million SNPs are typed using the Affymetrix Genome-Wide Human SNP Array 6.0. First, we focused on 1,350 non-diabetic AAs in MESA (diabetic AAs were already included in our initial analysis). Second, we analyzed the 2,497 EA participants with diabetes. We again conducted association tests between Log (CAC+1) and CAC as binary outcome with a cutpoint of 10. SNPs were selected located 1,000 kb upstream and downstream of the sentinel AIM that had a LOD score ≥2.5. SNPs were either directly genotyped or imputed using IMPUTE27. Imputation in the EA sample was performed using 1,000 Genomes EUR (BCBI Build 37) as the reference panel and the combination HapMap I + HapMap II+CEU+YRI+CHB+JPT (BCBI Build 36) served as the reference panel in the AA sample. We used the expected genotype (allelic dosage) for imputed SNPs. The analyses were adjusted for age, sex, and individual admixture proportion. A Bonferroni correction was applied in each region by dividing the nominal alpha level (5%) by the effective number of independent markers28. Therefore, the significance threshold was lower than the typical threshold used for a whole-genome scan.
Analyses in European Americans from the Diabetes Heart Study
We genotyped SNPs located 1,000 kb upstream and downstream of each marker that had a LOD score ≥2.5. Linear mixed effect models were fitted to account for the familial correlation as measured by the realized kinship coefficient matrix. These models were fitted using the GWAF package in R29 adjusting for age, gender and principal components. The significance threshold was again established using the effective number of tests28.
Results
Demographic and clinical characteristics
Demographic and clinical characteristics of 1,040 unrelated AAs with T2DM from AA-DHS, MESA, and FamHS have been reported previously 5, summarized in Table 1. Participants had a mean (standard deviation; SD) age of 58.8 (10.2) years, diabetes duration 10.4 (8.5) years, HbA1c 7.9 (2.0) %, fasting serum glucose 153.8 (62.68) mg/dl, HDL-cholesterol 48.1 (13.4) mg/dl, and LDL-cholesterol 109.8 (35.7) mg/dl. The mean (SD) CAC mass score was 276.0 (628.7) H.U., with a median CAC mass score of 10 H.U. Participants were 54.5% female, 23.7% were current and 35.6% former smokers. Approximately 45% took lipid lowering medications, 36% insulin, and 42% angiotensin converting enzyme inhibitors. Demographic and clinical characteristics of each study are provided in Supplementary Table 1. Analyses were adjusted for study to account for variations between the three cohorts. We repeated the analyses stratified by study and results were similar to those observed in study-adjusted analyses (Supplementary Table 2).
Table 1.
Characteristics of the combined cohort of African Americans with type 2 diabetes
| Variable | CAC < 10 | CAC ≥ 10 | All | P-value | ||||||
|---|---|---|---|---|---|---|---|---|---|---|
| Mean | SD | Median | Mean | SD | Median | Mean | SD | Median | ||
| Age (years) | 55.4 | 9.9 | 55 | 61.9 | 9.5 | 62.0 | 58.8 | 10.2 | 59.0 | <0.0001 |
| African Ancestry proportion | 0.81 | 0.116 | 0.84 | 0.79 | 0.114 | 0.82 | 0.80 | 0.115 | 0.83 | 0.002 |
| Diabetes duration (years) | 8.7 | 7.0 | 7 | 12.0 | 9.4 | 10.0 | 10.4 | 8.5 | 8.0 | <0.0001 |
| Hemoglobin A1c (%) | 7.9 | 2.1 | 7.4 | 8.0 | 1.9 | 7.5 | 7.9 | 2.0 | 7.5 | 0.32 |
| High sensitivity C-reactive protein (mg/dl) | 0.9 | 1.4 | 0.4 | 0.8 | 1.2 | 0.4 | 0.8 | 1.3 | 0.4 | 0.65 |
| Glucose, fasting (mg/dl) | 152.7 | 60.6 | 140.0 | 152.7 | 63.5 | 137.0 | 152.6 | 62.7 | 138.0 | 0.79 |
| LDL -cholesterol (mg/dl) | 109.6 | 35.2 | 107 | 109.5 | 36.1 | 107 | 109.8 | 35.7 | 107.0 | 0.92 |
| HDL -cholesterol (mg/dl) | 48.6 | 13.3 | 46.0 | 47.6 | 13.5 | 45 | 48.1 | 13.4 | 46.0 | 0.21 |
| Triglycerides (mg/dl) | 127.4 | 103.5 | 105.5 | 130.2 | 130.7 | 102.0 | 128.9 | 117.8 | 104.0 | 0.52 |
| BMI (kg/m2) | 34.6 | 8.0 | 33.3 | 33.3 | 7.5 | 31.8 | 33.9 | 7.8 | 32.6 | 0.009 |
| CAC (original scale) | 0.7 | 1.9 | 0 | 519.2 | 786.7 | 204.3 | 276.0 | 628.7 | 16.5 | NA |
| CAC (log10 scale ) | 0.1 | 0.3 | 0 | 2.3 | 0.7 | 2.3 | 1.3 | 1.2 | 1.2 | |
| ACE inhibitor use (%) | 37.1% | 45.9% | 41.4% | 0.005 | ||||||
| Current smoker (%) | 21.2% | 24.9% | 23.7% | 0.005 | ||||||
| Past Smoker (%) | 31.0% | 40.4% | 35.6% | |||||||
| Hypertension (%) | 77.6% | 86.4% | 82.3% | 3.7×10⁻⁴ | ||||||
| Lipid-lowering medications (%) | 38.0% | 51.2% | 44.8% | 4.8×10⁻⁵ | ||||||
| Female (%) | 62.0% | 47.6% | 53.1% | 4.3×10⁻⁶ | ||||||
ACE – angiotensin converting enzyme inhibitor; BMI - body mass index; LDL - low density lipoprotein; HDL - high density lipoprotein; CAC – coronary artery calcified plaque; SD – standard deviation.
P-values were computed using the Chi-square tests for categorical outcomes and the Wilcoxon two-sample test for continuous outcomes.
Ancestry proportion distribution
The allele frequency of each AIM estimated in the Yoruban and CEPH populations were supplied as prior probabilities in the estimation process. The average proportion of genome-wide African ancestry in the combined sample was 80% (SD 11.5%). When the sample was split based on a CAC cutpoint of 10 H.U., the average proportion of African ancestry was 79% for individuals with CAC ≥10 and 81% for CAC <10 (p-value=0.002). The association between CAC and African ancestry proportion remained statistically significant after adjusting for age, gender and study with an odds ratio 0.24 (p-value=0.02) when CAC was analyzed as a binary outcome, and a parameter estimate β=−1.8 (p-value=0.01) when Log(CAC+1)served as the outcome.
Regional admixture mapping results
Admixture mapping was performed using CAC mass score as a binary trait (Supplementary Table 3), and as a continuous outcome (Supplementary Table 4). These complementary analyses led to similar conclusions in most cases. When evidence of linkage was detected in a region with both outcomes (quantity and presence), we focused only on the result observed with the continuous outcome since the observed LOD scores tended to be greater. The result with the lower p-value is reported in all cases. Results shown for presence (CAC ≥10 vs. CAC <10) were only observed with this outcome, as presence and amount of CAC may be governed by different processes30, 31. We considered the additive, dominant and recessive models, allowing us to effectively reduce the models described in Equation 1 to 1 degree of freedom tests, with potential improvement in power32. Adjusted p-values computed using the maximum of the test statistic observed with the dominant, recessive and additive models appeared to be one order of magnitude lower than their unadjusted counterparts33. SNPs at 1p32.3 (rs6663966, LOD=3.7), 4p21.2 (rs1712373, LOD=3.0), 8q22.2 (rs6994682, LOD=2.7), 9p21.2 (rs439314, LOD=2.7), and 13q32.1 (rs7492028, LOD=2.8) revealed significant evidence of linkage with Log(CAC+1) . We also detected significant evidence of linkage at 1q32.1 (rs7530895, LOD=3.1), 4q31.1 (rs1872861, LOD=2.7) and 11q25 (rs6590705, LOD=3.3) with the binary outcome. Results for these and other SNPs reaching a LOD score ≥2.5 are summarized in Table 2. This Table also lists the average probability of inheriting exactly two copies of the European derived allele at each marker. Based on the global ancestry proportion estimate, the probability that an AA individual would inherit exactly two alleles at random from the European population is 4%. For individuals with CAC mass scores ≥10, we observed that the mean probability of inheriting exactly two European-derived alleles at rs6994682, for example, was approximately 6.5%, more than 60% higher than the expected probability under the null. The observed mean was 4.1% in those with CAC mass scores <10.
Table 2.
Summary of SNPs associated with coronary artery calcified plaque in African Americans with type 2 diabetes, ordered by chromosomal region.
| SNP | Chromosomal region | Outcome | LOD Score | Nearest gene | Allele frequency | Average probability of inheriting 2 European derived alleles | ||||
|---|---|---|---|---|---|---|---|---|---|---|
| Alleles | CEPH | YRI | Observed | CAC<10 | CAC≥10 | |||||
| rs6663966 | 1p32.3 | Log(CAC+1) | 3.7 | GLIS1 | A/G | P(A)=1 | P(A)=0.26 | 0.42 | 0.0440 | 0.0648 |
| rs7530895 | 1q32.1 | CAC < 10 vs. ≥10 | 2.9 | 61.9 kb from CHIT1 | A/G | P(A)=0.97 | P(A)=0.33 | 0.43 | 0.0394 | 0.0507 |
| rs9309717 | 2p25.3 | CAC < 10 vs. ≥10 | 2.5 | 6.611 kb from ADI1 | A/G | P(A)=0.73 | P(A)=0.05 | 0.18 | 0.0426 | 0.0538 |
| rs1712373 | 4q21.2 | Log(CAC+1) | 3.0 | 29.1 KB from PRKG2 | A/G | P(A)=0 | P(A)=0.86 | 0.65 | 0.0498 | 0.0788 |
| rs1872861 | 4q31.1 | CAC < 10 vs. ≥10 | 2.7 | 78.4 kb from TBC1D9 | A/C | P(A)=0.98 | P(A)=0.23 | 0.4 | 0.0540 | 0.0639 |
| rs6994682 | 8q22.2 | Log(CAC+1) | 2.7 | 26.7 kb from MIR4471 | A/G | P(A)=0.84 | P(A)= 0.11 | 0.25 | 0.0296 | 0.0379 |
| rs439314 | 9p21.2 | Log(CAC+1) | 2.7 | 261.4 kb from LOC100506422 | A/G | P(G)=0.99 | P(G)= 0.3 | 0.58 | 0.0381 | 0.0509 |
| rs7933164 | 11p15.4 | Log(CAC+1) | 2.5 | STIM1 | A/G | P(A)=0.88 | P(A)=0.11 | 0.27 | 0.0388 | 0.0620 |
| rs6590705 | 11q25 | CAC < 10 vs. ≥10 | 3.4 | OPCML | A/C | P(C)=0.98 | P(C)=0.2 | 0.64 | 0.0350 | 0.0596 |
| rs790325 | 13q21.1 | CAC <=10 vs. >10 | 2.9 | 85.3 kb from PRR20A | A/G | P(A)=0.08 | P(A)=0.77 | 0.65 | 0.0381 | 0.0522 |
| rs7492028 | 13q32.1 | Log(CAC+1) | 2.8 | 77.3 kb from HS6ST3 | C/G | P(C)=0.92 | P(C)=0.16 | 0.31 | 0.0489 | 0.0569 |
These regions all display a higher than expected proportion of European ancestry.
Regional admixture mapping results stratified by study
Analyses were repeated stratified by study, instead of accounting for study as in the initial model. Supplementary Table 2 shows the study-specific LOD score and meta-analysis LOD score for each SNP reaching a LOD ≥2.5 in the analysis adjusted for study. In general, the two analysis strategies yielded similar results and would lead to similar inferences in most cases. The AA-DHS specific LOD scores tended to be higher than those observed in the other studies, except for rs9309717 and rs7933164 which had stronger LOD scores in MESA (AA-DHS had a larger sample size). The extent to which the difference in sample size explains differences in LOD scores is not clear. Ascertainment differences may also contribute.
Fine mapping
Fine mapping was performed at 1p32.3 (highest LOD score 3.7), 9p21.2 with established involvement in cardiac disease34–36, and 11p15.4 (lowest LOD score 2.5). Supplementary Tables 5a–5c summarizes the admixture mapping results in these regions using an additional set of AIMs typed around each sentinel SNP. The results of conditional analyses adjusted for the sentinel AIM are included. Evidence of support for the linkage peak observed and refinement of the interval on 1p32.3 was observed with four SNPs distal to the sentinel SNP (rs6663966) showing nominal evidence of association (p-value<0.040; Supplementary Table 5a). Analysis of 19 additional AIMs on 9p21.2 also provided evidence of support for the linkage observed. Twelve SNPs located around the sentinel SNP (rs439314) showing evidence of association (P-value=0.034–4.5×10⁻⁴; Supplementary Table 5b). Finally, sporadic evidence of support was observed with markers around the 11p15.4 sentinel SNP (Supplementary Table 5c). In all three regions, conditional analyses accounting for the sentinel SNP revealed that each signal was primarily driven by the previously identified SNP with little evidence of additional AIMs contributing.
Analyses in other study samples
Results in additional samples are summarized in Supplementary Tables 6a and 6b, including associated Manhattan plots. These plots show supportive evidence in identified regions; indicating that the association is not likely an uncontrolled artifact. Analyses in the MESA non-diabetic AA sample identified numerous nearby SNPs with p-values ranging between 10−3 and 10−4 in each region. The chromosome 8 region had a SNP whose p-value was 2.5×10⁻⁵ with additional supporting evidence around it. Results are shown in Figure 1a for Log(CAC+1) and Figure 1b for presence of CAC.
Figure 1.
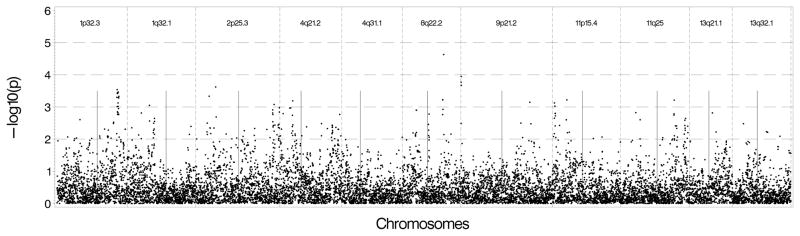
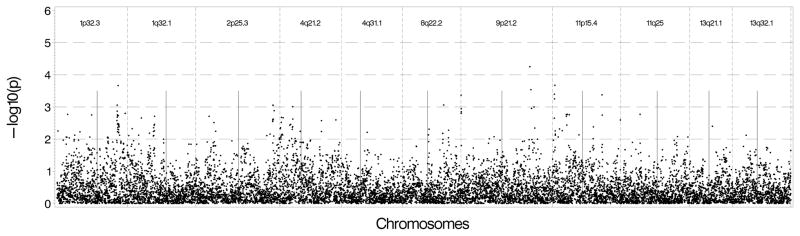
Figure 1A: Genetic association results in non-diabetic African Americans in MESA using Log(CAC+1) as the outcome and genotyped and imputed SNPs found 500 kb upstream and downstream of the sentinel marker in each region. B: Genetic association results in non-diabetic African Americans in MESA using presence of CAC as the outcome and genotyped and imputed SNPs found 500 kb upstream and downstream of the sentinel marker in each region.
We conducted association tests using available GWAS data on EAs in MESA and DHS. Figure 2a shows that the strongest results in MESA EAs were on chromosome 11 near the 11p15.4 peak with several SNPs located near the sentinel marker with p-values between 10−4 and 10−5. We also observed associations with Log(CAC+1) near 13q32.1 with p-values between 10−3 and 10−4, and between the 2 sentinel makers on chromosome 1 with p-values ranging between 0.01 and 0.001. There was no evidence of association nearthe 9p21.2 region. Results were similar when presence of CAC was used as the outcome except for the chromosome 1 regions, which had p-values between 10−2 and 10−3 (See Figure 2b). As shown in Figures 3a and 3b, DHS provided minimal evidence of support for genomic regions from the initial analysis, with p-values 10−2 to 10−3. One SNP near 2p25.3 had stronger evidence (p-value between 10−3 and 10−4).
Figure 2.
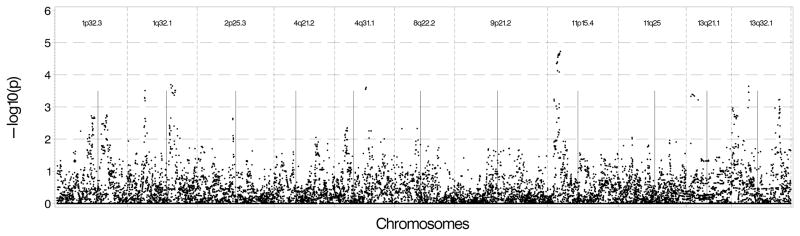
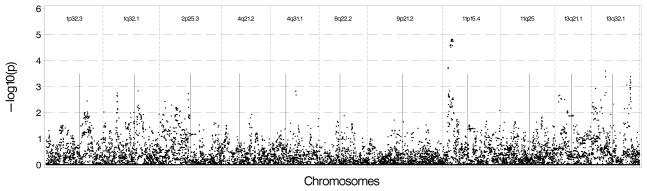
Figure 2A: Genetic association results in European Americans in MESA using Log (CAC+1) as the outcome and genotyped and imputed SNPs found 500 kb upstream and downstream of the sentinel marker in each region. B: Genetic association results in European Americans in MESA using presence of CAC as the outcome and genotyped and imputed SNPs found 500 kb upstream and downstream of the sentinel marker in each region.
Figure 3.
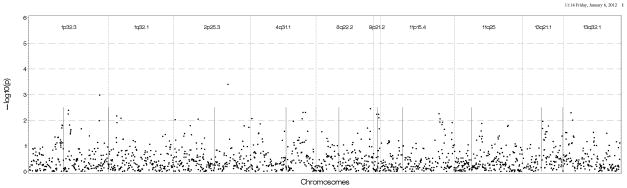
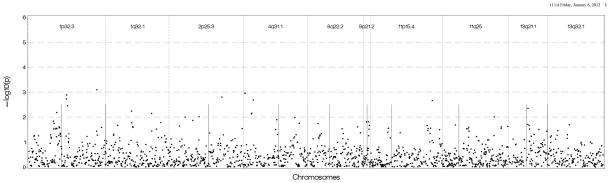
Figure 3A: Genetic association results in European Americans in DHS using Log (CAC+1) as the outcome and genotyped SNPs found 500 kb upstream and downstream of the sentinel marker in each region. B: Genetic association results in European Americans in DHS using presence of CAC as the outcome genotyped and imputed SNPs found 500 kb upstream and downstream of the sentinel marker in each region.
Note: Straight vertical lines inside each chromosomal region represent the sentinel AIM for which initial results were observed in all figures.
We note that these SNPs would not meet genome-wide significance in a GWAS setting under a strict Bonferroni correction threshold. However, considered in this context, they strongly support initial results.
Discussion
Nearly all published reports demonstrate that AAs have lower amounts of CAC than EAs1–4. CAC predicts risk of CVD death and myocardial infarction equally among members of all population groups37, 38. Furthermore, AAs manifest lower levels of CAC despite greater exposure to conventional CVD risk factors, supporting underlying inherited or biologic mechanisms. The present analyses were directed at identifying genetic regions and variants governing susceptibility to development and progression of CAC in diabetic AAs.
All AA participants with T2DM in the AA-DHS, MESA and FamHS cohorts with CAC were included. Autosomal AIMs on the Illumina African American admixture panel were genotyped and our RAM method applied to compute the probability of inheriting 0, 1 and 2 alleles from the ancestral European population. These probabilities were subsequently used to test for linkage with CAC, analyzed as a continuous [Log(CAC+1)] and a binary trait (cases had CAC ≥10). We note that the significant negative association between African ancestry and CAC, replicating Wassel et al.’s sentinel observation6. This reverses the longstanding concept that AAs are at higher CVD risk than EAs. In fact, AAs are at lower biologic risk for myocardial infarction based on less CAC and they have significantly lower rates of myocardial infarction than EAs provided equal access to healthcare39, 40. Lack of healthcare access likely contributes to higher CVD rates in the general AA population. We extend these results by pinpointing specific genomic regions where excess European ancestry appears to confer higher risk for initiation of CAC, progression, or both.
The RAM analysis suggested regions on chromosomes 1, 2, 4, 8, 11 and 13 may harbor genetic variants conferring higher level or odds of CAC. We also replicated the 9p region associated with CVD in several ethnic groups. Significant novel associations with CAC were observed on chromosomes 1, 4 and 11 with LOD scores between 3.0 and 3.7. Our effort to replicate these findings is limited by the fact that few studies outside of the AA-DHS, DHS and MESA have large scale genetic and computed tomography data on AAs with T2DM. We extended our results in non-diabetic AAs from MESA. A limitation of our validation approach is that, independently of the power of the test being conducted, the meaning of a negative result is unclear. Null results may indicate the initial finding is false positive or an interaction exists with diabetes that cannot be captured adequately in non-diabetic samples.
The chromosome 1p32.3 linkage peak was located in GLIS family zinc finger 1 gene. This SNP appeared to be monomorphic in the Centre d’Étude du Polymorphisme Humain (CEPH) population and its minor allele frequency (MAF) in Yorubans is 26%. The MAF in this sample is 42%. The low density lipoprotein receptor-related protein 8 gene (LRP8), located ~200 Kb from this linkage peak and nearby genes remain of interest. LRP8 encodes an apolipoprotein E receptor, a member of the low density lipoprotein receptor family. The apolipoprotein E receptor is involved in cellular recognition and internalization of lipoproteins. LRP8 is associated with coronary artery disease in European-derived populations. Admixture mapping peaks are generally not as well defined as GWAS signals. Therefore, the GLIS1 signal is likely tracking the effect of other nearby gene(s). The second chromosome 1 LOD peak is located at 1q32.1 near the chitotriosidase (CHIT1) gene. The allele frequency at the tested marker is 97% and 33% in the CEPH and Yoruban HapMap 3 samples, respectively, relative to 43% in the study sample. A positive correlation between chitotriosidase and atherosclerosis has been reported in European-derived samples41, 42 and serum chitotriosidase activity may predict CVD events43.
Two regions on chromosome 4 had LOD scores ≥2.7. The first identified with Log(CAC+1)with a LOD of 3.0 is 4p21.2 near the PRKG2 gene, a region including genes involved in bone metabolism. Relationships between bone disease and arterial calcification are well established, numerous studies report inverse relationships between bone mineral density (BMD) and atherosclerosis in EAs and AAs44–46. The 9p21 region was previously associated with coronary artery disease susceptibility in predominantly European-derived populations36, 47, 48. AAs with excess European ancestry in this region had higher prevalence and/or higher levels of CAC. The chromosome 11 and 13 peaks appear to be novel in regards to this phenotype; further replication and validation efforts are needed.
Admixture mapping has limitations. These AIMs are not 100% informative and the European ancestry at each marker is probabilistically determined. In addition, the power of RAM is maximized when the average ancestry proportion from the two ancestral populations is close to (0.50, 0.50); these proportions were estimated to be approximately (0.80, 0.20) in this sample. Nonetheless, admixture mapping remains a valuable and proven gene-mapping technique. In fact, combining admixture mapping and association tests can lead to non-negligible gain in power11.
In addition to fine mapping the genome-wide significant linkage peaks, attention should be paid to underlying candidate genes involved in vitamin D metabolism, calcium handling and bone health. We demonstrated inverse relationships between CAC and BMD in the AA-DH49. Thus, susceptibility to osteoporosis and development of CAC appear to be linked in EAs and AAs. CYP2R1, an enzyme important in activation of vitamin D, is located under the chromosome 11 MALD peak. BMP3 and PRKG2, involved in multiple aspects of cartilage and bone development, are located under the chromosome 4 MALD peak. Additional genes under these MALD peaks with involvement in calcium, bone and arterial metabolism include chromosomes 1 (ADORA1, BTG2, FMOD, and PRELP) and 8 (RNF19A). It is likely that population-specific susceptibility to CAC reflects, in part, the widely appreciated racial differences in calcium and vitamin D metabolism50.
In conclusion, genomic regions on chromosomes 1, 2, 4, 8, 9, 11 and 13 identified by admixture mapping appear to contribute to ethnic differences in susceptibility to CAC between AAs and EAs. Fine mapping under these peaks is likely to detect causative genes, potentially leading to improved understanding of the biologic causes of this phenomenon and development of novel anti-atherosclerotic therapies.
Supplementary Material
African Americans (AAs) have markedly lower levels of coronary artery calcified atherosclerotic plaque (CAC) than European Americans (EAs), despite the presence of more severe conventional cardiovascular disease risk factors. These findings suggest that inherited or biologic factors underlie susceptibility to CAC, a measure of subclinical coronary artery disease. In an effort to detect genes underlying susceptibility to CAC, we performed regional admixture mapping (RAM) in 1,040 unrelated AAs with type 2 diabetes who had computed tomography-derived measures of CAC. RAM is a gene mapping technique useful for detecting disease genes in admixed populations. RAM is particularly powerful when the disease prevalence or distribution of the trait of interest varies substantially between the ancestral populations. RAM revealed 11 genomic regions located on chromosomes 1, 2, 4, 8, 9, 11 and 13 that were significantly or suggestively linked with the presence or severity of CAC in AAs. Strikingly, all eleven regions displayed higher than expected European ancestry in individuals whose CAC score was 10 or higher. These results underscore that susceptibility to coronary artery disease in the admixed AA population relates to European ancestry. Fine mapping under these linkage peaks is likely to detect the genes that regulate the related processes of atherosclerotic coronary artery disease and vascular calcification.
Acknowledgments
The investigators acknowledge the cooperation of our DHS and AA-DHS participants and study recruiter Cassandra Bethea.
Funding Sources: This study was supported in part by the General Clinical Research Center of the Wake Forest University School of Medicine grant M01 RR07122; NIDDK grant RO1 DK071891 (BIF) and NHLBI grant R01 HL67348 (DWB).
MESA and the MESA SHARe project are conducted and supported by the National Heart, Lung, and Blood Institute (NHLBI) in collaboration with MESA investigators. Support is provided by grants and contracts N01 HC-95159, N01-HC-95160, N01-HC-95161, N01-HC-95162, N01-HC-95163, N01-HC-95164, N01-HC-95165, N01-HC-95166, N01-HC-95167, N01-HC-95168, N01-HC-95169 and RR-024156. Funding for SHARe genotyping was provided by NHLBI Contract N02-HL-6-4278. Genotyping was performed at the Broad Institute of Harvard and MIT (Boston, Massachusetts, USA) and at Affymetrix (Santa Clara, California, USA) using the Affymetrix Genome-Wide Human SNP Array 6.0.
FamHS are supported by contracts NO1-HC-25104, NO1-HC-25105, NO1-HC-25106, NO1-HC-25107, NO1-HC-25108, NO1-HC-25109, and 5R01HL088215 (MAP, PI) from the National Heart, Lung, and Blood Institute. This manuscript has been reviewed by FamHS investigators for scientific content and consistency of data interpretation with previous FamHS publications and significant comments have been incorporated prior to submission for publication.
Footnotes
Conflict of Interest Disclosures: None.
References
- 1.Bild DE, Detrano R, Peterson D, Guerci A, Liu K, Shahar E, et al. Ethnic Differences in Coronary Calcification: The Multi-Ethnic Study of Atherosclerosis (MESA) Circulation. 2005;111:1313–1320. doi: 10.1161/01.CIR.0000157730.94423.4B. [DOI] [PubMed] [Google Scholar]
- 2.Lee TC, O’Malley PG, Feuerstein I, Taylor AJ. The prevalence and severity of coronary artery calcification on coronary artery computed tomography in black and white subjects. J Am Coll Cardiol. 2003;41:39–44. doi: 10.1016/s0735-1097(02)02618-9. [DOI] [PubMed] [Google Scholar]
- 3.Freedman BI, Hsu FC, Langefeld CD, Rich SS, Herrington DM, Carr JJ, et al. The impact of ethnicity and sex on subclinical cardiovascular disease: the Diabetes Heart Study. Diabetologia. 2005;48:2511–2518. doi: 10.1007/s00125-005-0017-2. [DOI] [PubMed] [Google Scholar]
- 4.Wade AN, Fedyna S, Mehta NN, Clair C, Ginwala N, Krishna RK, et al. Type 2 diabetes does not attenuate racial differences in coronary calcification. Diabetes Res Clin Pract. 2011;91:101–107. doi: 10.1016/j.diabres.2010.07.004. [DOI] [PMC free article] [PubMed] [Google Scholar]
- 5.Wagenknecht LE, Divers J, Bertoni AG, Langefeld CD, Carr JJ, Bowden DW, et al. Correlates of Coronary Artery Calcified Plaque in Blacks and Whites with Type 2 Diabetes. Ann Epidemiol. 2011;21:34–41. doi: 10.1016/j.annepidem.2010.10.007. [DOI] [PMC free article] [PubMed] [Google Scholar]
- 6.Wassel CL, Pankow JS, Peralta CA, Choudhry S, Seldin MF, Arnett DK. Genetic Ancestry Is Associated With Subclinical Cardiovascular Disease in African-Americans and Hispanics From the Multi-Ethnic Study of Atherosclerosis. Circ Cardiovasc Genet. 2009;2:629–636. doi: 10.1161/CIRCGENETICS.109.876243. [DOI] [PMC free article] [PubMed] [Google Scholar]
- 7.McKeigue PM. Prospects for admixture mapping of complex traits. Am J Hum Genet. 2005;76:1–7. doi: 10.1086/426949. [DOI] [PMC free article] [PubMed] [Google Scholar]
- 8.Reich D, Patterson N, De Jager PL, McDonald GJ, Waliszewska A, Tandon A, et al. A whole-genome admixture scan finds a candidate locus for multiple sclerosis susceptibility. Nat Genet. 2005;37:1113–1118. doi: 10.1038/ng1646. [DOI] [PubMed] [Google Scholar]
- 9.Kao WHL, Klag MJ, Meoni LA, Reich D, Berthier-Schaad Y, Li M, et al. MYH9 is associated with nondiabetic end-stage renal disease in African Americans. Nat Genet. 2008;40:1185–1192. doi: 10.1038/ng.232. [DOI] [PMC free article] [PubMed] [Google Scholar]
- 10.Zhu XF, Luke A, Cooper RS, Quertermous T, Hanis C, Mosley T, et al. Admixture mapping for hypertension loci with genome-scan markers. Nat Genet. 2005;37:177–181. doi: 10.1038/ng1510. [DOI] [PubMed] [Google Scholar]
- 11.Pasaniuc B, Zaitlen N, Lettre G, Chen GK, Tandon A, Kao WH, et al. Enhanced statistical tests for GWAS in admixed populations: assessment using African Americans from CARe and a Breast Cancer Consortium. PLoS Genet. 2011;7:e1001371. doi: 10.1371/journal.pgen.1001371. [DOI] [PMC free article] [PubMed] [Google Scholar]
- 12.Brown ER, Kronmal RA, Bluemke DA, Guerci AD, Carr JJ, Goldin J, et al. Coronary calcium coverage score: determination, correlates, and predictive accuracy in the Multi-Ethnic Study of Atherosclerosis. Radiology. 2008;247:669–675. doi: 10.1148/radiol.2473071469. [DOI] [PMC free article] [PubMed] [Google Scholar]
- 13.Bowden DW, Cox AJ, Freedman BI, Hugenschimdt CE, Wagenknecht LE, Herrington D, et al. Review of the Diabetes Heart Study (DHS) family of studies: a comprehensively examined sample for genetic and epidemiological studies of type 2 diabetes and its complications. Rev Diabet Stud. 2010;7:188–201. doi: 10.1900/RDS.2010.7.188. [DOI] [PMC free article] [PubMed] [Google Scholar]
- 14.Divers J, Wagenknecht LE, Bowden DW, Carr JJ, Hightower RC, Ding J, et al. Regional adipose tissue associations with calcified atherosclerotic plaque: African American-diabetes heart study. Obesity. 2010;18:2004–2009. doi: 10.1038/oby.2010.30. [DOI] [PMC free article] [PubMed] [Google Scholar]
- 15.Bild DE, Bluemke DA, Burke GL, Detrano R, ez Roux AV, Folsom AR, et al. Multi-Ethnic Study of Atherosclerosis: Objectives and Design. Am J Epidemiol. 2002;156:871–881. doi: 10.1093/aje/kwf113. [DOI] [PubMed] [Google Scholar]
- 16.Hopkins PN, Ellison RC, Province MA, Pankow JS, Carr JJ, Arnett DK, et al. Association of coronary artery calcified plaque with clinical coronary heart disease in the National Heart, Lung, and Blood Institute’s Family Heart Study. Am J Cardiol. 2006;97:1564–1569. doi: 10.1016/j.amjcard.2005.12.043. [DOI] [PubMed] [Google Scholar]
- 17.Carr JJ, Nelson JC, Wong ND, Nitt-Gray M, Arad Y, Jacobs DR, Jr, et al. Calcified coronary artery plaque measurement with cardiac CT in population-based studies: standardized protocol of Multi-Ethnic Study of Atherosclerosis (MESA) and Coronary Artery Risk Development in Young Adults (CARDIA) study. Radiology. 2005;234:35–43. doi: 10.1148/radiol.2341040439. [DOI] [PubMed] [Google Scholar]
- 18.Redden D, Divers J, Vaughan L, Tiwari H, Beasley T, Fernandez J, et al. Regional admixture mapping and structured association testing: conceptual unification and an extensible general linear model. Plos Genetics. 2006;2:1254–1264. doi: 10.1371/journal.pgen.0020137. [DOI] [PMC free article] [PubMed] [Google Scholar]
- 19.Hoggart CJ, Shriver MD, Kittles RA, Clayton DG, McKeigue PM. Design and analysis of admixture mapping studies. Am J Hum Genet. 2004;74:965–978. doi: 10.1086/420855. [DOI] [PMC free article] [PubMed] [Google Scholar]
- 20.McKeigue PM. Mapping genes that underlie ethnic differences in disease risk: Methods for detecting linkage in admixed populations, by conditioning on parental admixture. Am J Hum Genet. 1998;63:241–251. doi: 10.1086/301908. [DOI] [PMC free article] [PubMed] [Google Scholar]
- 21.Zhu X, Cooper RS, Elston RC. Linkage analysis of a complex disease through use of admixed populations. Am J Hum Genet. 2004;74:1136–1153. doi: 10.1086/421329. [DOI] [PMC free article] [PubMed] [Google Scholar]
- 22.Reilly MP, Wolfe ML, Localio AR, Rader DJ. Coronary artery calcification and cardiovascular risk factors: impact of the analytic approach. Atherosclerosis. 2004;173:69–78. doi: 10.1016/j.atherosclerosis.2003.10.010. [DOI] [PubMed] [Google Scholar]
- 23.Reich D, Patterson N. Will admixture mapping work to find disease genes? Philos Trans R Soc Lond B Biol Sci. 2005;360:1605–1607. doi: 10.1098/rstb.2005.1691. [DOI] [PMC free article] [PubMed] [Google Scholar]
- 24.Patterson N, Hattangadi N, Lane B, Lohmueller KE, Hafler DA, Oksenberg JR, et al. Methods for high-density admixture mapping of disease genes. Am J Hum Genet. 2004;74:979–1000. doi: 10.1086/420871. [DOI] [PMC free article] [PubMed] [Google Scholar]
- 25.Barrett JC, Fry B, Maller J, Daly MJ. Haploview: analysis and visualization of LD and haplotype maps. Bioinformatics. 2005;21:263–265. doi: 10.1093/bioinformatics/bth457. [DOI] [PubMed] [Google Scholar]
- 26.Oeth P, del MG, Marnellos G, Shi T, van den BD. Qualitative and quantitative genotyping using single base primer extension coupled with matrix-assisted laser desorption/ionization time-of-flight mass spectrometry (MassARRAY) Methods Mol Biol. 2009;578:307–343. doi: 10.1007/978-1-60327-411-1_20. [DOI] [PubMed] [Google Scholar]
- 27.Marchini J, Howie B, Myers S, McVean G, Donnelly P. A new multipoint method for genome-wide association studies by imputation of genotypes. Nat Genet. 2007;39:906–913. doi: 10.1038/ng2088. [DOI] [PubMed] [Google Scholar]
- 28.Gao X, Starmer J, Martin ER. A multiple testing correction method for genetic association studies using correlated single nucleotide polymorphisms. Genet Epidemiol. 2008;32:361–369. doi: 10.1002/gepi.20310. [DOI] [PubMed] [Google Scholar]
- 29.Chen MH, Yang Q. GWAF: an R package for genome-wide association analyses with family data. Bioinformatics. 2010;26:580–581. doi: 10.1093/bioinformatics/btp710. [DOI] [PMC free article] [PubMed] [Google Scholar]
- 30.Reilly MP, Wolfe ML, Localio AR, Rader DJ. Coronary artery calcification and cardiovascular risk factors: impact of the analytic approach. Atherosclerosis. 2004;173:69–78. doi: 10.1016/j.atherosclerosis.2003.10.010. [DOI] [PubMed] [Google Scholar]
- 31.Kronmal RA, McClelland RL, Detrano R, Shea S, Lima JA, Cushman M, et al. Risk factors for the progression of coronary artery calcification in asymptomatic subjects: results from the Multi-Ethnic Study of Atherosclerosis (MESA) Circulation. 2007;115:2722–2730. doi: 10.1161/CIRCULATIONAHA.106.674143. [DOI] [PubMed] [Google Scholar]
- 32.Freidlin B, Zheng G, Li Z, Gastwirth JL. Trend tests for case-control studies of genetic markers: power, sample size and robustness. Hum Hered. 2002;53:146–152. doi: 10.1159/000064976. [DOI] [PubMed] [Google Scholar]
- 33.So HC, Sham PC. Robust association tests under different genetic models, allowing for binary or quantitative traits and covariates. Behav Genet. 2011;41:768–775. doi: 10.1007/s10519-011-9450-9. [DOI] [PMC free article] [PubMed] [Google Scholar]
- 34.Samani NJ, Raitakari OT, Sipila K, Tobin MD, Schunkert H, Juonala M, et al. Coronary artery disease-associated locus on chromosome 9p21 and early markers of atherosclerosis. Arterioscler Thromb Vasc Biol. 2008;28:1679–1683. doi: 10.1161/ATVBAHA.108.170332. [DOI] [PubMed] [Google Scholar]
- 35.McPherson R. Chromosome 9p21 and coronary artery disease. N Engl J Med. 2010;362:1736–1737. doi: 10.1056/NEJMcibr1002359. [DOI] [PubMed] [Google Scholar]
- 36.Chen S, Ballantyne C, Gotto A, Marian A. The 9p21 susceptibility locus for coronary artery disease and the severity of coronary atherosclerosis. BMC Cardiovasc Disord. 2009;9:3. doi: 10.1186/1471-2261-9-3. [DOI] [PMC free article] [PubMed] [Google Scholar]
- 37.Greenland P, Bonow RO, Brundage BH, Budoff MJ, Eisenberg MJ, Grundy SM, et al. ACCF/AHA 2007 clinical expert consensus document on coronary artery calcium scoring by computed tomography in global cardiovascular risk assessment and in evaluation of patients with chest pain: a report of the American College of Cardiology Foundation Clinical Expert Consensus Task Force (ACCF/AHA Writing Committee to Update the 2000 Expert Consensus Document on Electron Beam Computed Tomography) Circulation. 2007;115:402–426. doi: 10.1161/CIRCULATIONAHA..107.181425. [DOI] [PubMed] [Google Scholar]
- 38.Carr JJ. Coronary artery calcified plaque for cardiovascular disease risk assessment. Applied Radiology. 2005;(Supplement):14–21. [Google Scholar]
- 39.Karter AJ, Ferrara A, Liu JY, Moffet HH, Ackerson LM, Selby JV. Ethnic disparities in diabetic complications in an insured population. JAMA. 2002;287:2519–2527. doi: 10.1001/jama.287.19.2519. [DOI] [PubMed] [Google Scholar]
- 40.Young BA, Maynard C, Boyko EJ. Racial differences in diabetic nephropathy, cardiovascular disease, and mortality in a national population of veterans. Diabetes Care. 2003;26:2392–2399. doi: 10.2337/diacare.26.8.2392. [DOI] [PubMed] [Google Scholar]
- 41.Boot RG, van Achterberg TA, van Aken BE, Renkema GH, Jacobs MJ, Aerts JM, et al. Strong induction of members of the chitinase family of proteins in atherosclerosis: chitotriosidase and human cartilage gp-39 expressed in lesion macrophages. Arterioscler Thromb Vasc Biol. 1999;19:687–694. doi: 10.1161/01.atv.19.3.687. [DOI] [PubMed] [Google Scholar]
- 42.Artieda M, Cenarro A, Ganan A, Jerico I, Gonzalvo C, Casado JM, et al. Serum chitotriosidase activity is increased in subjects with atherosclerosis disease. Arterioscler Thromb Vasc Biol. 2003;23:1645–1652. doi: 10.1161/01.ATV.0000089329.09061.07. [DOI] [PubMed] [Google Scholar]
- 43.Artieda M, Cenarro A, Ganan A, Lukic A, Moreno E, Puzo J, et al. Serum chitotriosidase activity, a marker of activated macrophages, predicts new cardiovascular events independently of C-reactive protein. Cardiology. 2007;108:297–306. doi: 10.1159/000099099. [DOI] [PubMed] [Google Scholar]
- 44.Marcovitz PA, Tran HH, Franklin BA, O’Neill WW, Yerkey M, Boura J, et al. Usefulness of bone mineral density to predict significant coronary artery disease. Am J Cardiol. 2005;96:1059–1063. doi: 10.1016/j.amjcard.2005.06.034. [DOI] [PubMed] [Google Scholar]
- 45.Tanko LB, Christiansen C, Cox DA, Geiger MJ, McNabb MA, Cummings SR. Relationship between osteoporosis and cardiovascular disease in postmenopausal women. J Bone Miner Res. 2005;20:1912–1920. doi: 10.1359/JBMR.050711. [DOI] [PubMed] [Google Scholar]
- 46.Carr JJ, Register TC, Hsu FC, Lohman K, Lenchik L, Bowden DW, et al. Calcified atherosclerotic plaque and bone mineral density in type 2 diabetes: the diabetes heart study. Bone. 2008;42:43–52. doi: 10.1016/j.bone.2007.08.023. [DOI] [PMC free article] [PubMed] [Google Scholar]
- 47.McPherson R. Chromosome 9p21 and coronary artery disease. N Engl J Med. 2010;362:1736–1737. doi: 10.1056/NEJMcibr1002359. [DOI] [PubMed] [Google Scholar]
- 48.Beckie TM, Groer MW, Beckstead JW. The relationship between polymorphisms on chromosome 9p21 and age of onset of coronary heart disease in black and white women. Genet Test Mol Biomarkers. 2011;15:435–442. doi: 10.1089/gtmb.2010.0222. [DOI] [PMC free article] [PubMed] [Google Scholar]
- 49.Divers J, Register TC, Langefeld CD, Wagenknecht LE, Bowden DW, Carr JJ, et al. Relationships between calcified atherosclerotic plaque and bone mineral density in African Americans with type 2 diabetes. J Bone Miner Res. 2011;26:1554–1560. doi: 10.1002/jbmr.389. [DOI] [PMC free article] [PubMed] [Google Scholar]
- 50.Freedman BI, Wagenknecht LE, Hairston KG, Bowden DW, Carr JJ, Hightower RC, et al. Vitamin d, adiposity, and calcified atherosclerotic plaque in african-americans. J Clin Endocrinol Metab. 2010;95:1076–1083. doi: 10.1210/jc.2009-1797. [DOI] [PMC free article] [PubMed] [Google Scholar]
Associated Data
This section collects any data citations, data availability statements, or supplementary materials included in this article.