

Abstract
Background
Hirschsprung’s disease (HSCR) is a congenital condition in which enteric ganglia, formed from neural crest cells (NCC), are absent from the terminal bowel. Dysmotility and constipation are common features of HSCR that persist following surgical intervention. This persistence suggests that the portion of the colon that remains post-operatively is not able to support normal bowel function. To elucidate the defects that underlie this condition, we utilized a murine model of HSCR.
Methods
Mice with NCC specific deletion of Ednrb, were used to measure the neuronal density and neurotransmitter expression in ganglia.
Key Results
At the site located proximal to the aganglionic region of P21 Ednrb null mice, the neuronal density is significantly decreased and the expression of neurotransmitters is altered compared to het animals. The ganglia in this colonic region are smaller and more isolated while the size of neuronal cell bodies is increased. The percentage of neurons expressing neuronal nitric oxide synthase (nNOS) and vasoactive intestinal peptide (VIP) is significantly increased in Ednrb nulls. Conversely, the percentage of choline acetyltransferase (ChAT) expressing neurons is decreased, while Substance P is unchanged between the two genotypes. These changes are limited to the colon and are not detected in the ileum.
Conclusions & Inferences
We demonstrate changes in neuronal density and alterations in the balance of expression of neurotransmitters in the colon proximal to the aganglionic region in Ednrb null mice. The reduced neuronal density and complementary changes in nNOS and ChAT expression may account for the dysmotility seen in HSCR.
Keywords: Hirschprung’s Disease, Ednrb, nNOS, VIP, ChAT, neuronal density
Introduction
Enteric neural crest cells (ENCCs) coalesce into ganglia and form the enteric nervous system (ENS) that is present along the entire, normally developed gut. An absence of these ganglia in the distal bowel results in Hirschsprung’s Disease (HSCR), a condition that affects 1:5000 live births (1). Survival with HSCR often requires surgical intervention that entails removal of the aganglionic portion of the colon and rejoining the remaining colon to the anal canal. Unfortunately, following surgery, HSCR patients regularly experience recurrent lifelong problems, characterized by dysmotility and constipation (2). Therefore, while the “normal” portion of the colon may be ganglionated, its circuitry may be so altered that motility is compromised.
Genetic studies reveal that HSCR is associated with mutations in at least a dozen different genes. Mutations in Ret and Endothelin receptor B (EDNRB) are responsible for the majority of HSCR cases (3–7). Murine models of HSCR have proven useful in gaining understanding of the pathophysiology of the disease. The piebald lethal mouse has a naturally occurring mutation in endothelin receptor B (Ednrb) while the lethal spotted mouse has a gene defect in the Ednrb ligand, endothelin 3 (8–11). piebald lethal mice are characterized by a reduction in myenteric neuron number proximal to the aganglionic region and absence of colonic migrating motor complexes (CMMCs) (12). Examination of endothelin 3 mutants shows reductions in neuronal density and alterations in the proportion of nNOS neurons compared to wildtype mice (13, 14). While no consistent pattern of changes is observed in neuronal density or neurotransmitter expression within the different bowel regions in those studies, nNOS is the predominant neurotransmitter altered. Since enteric ganglia contain a variety of neurotransmitters that together regulate motility, we decided to undertake a systematic regional examination of different neurotransmitters known to be important in function of the neuronal circuitry using our conditional deletion of Ednrb (15, 16).
Our analysis of the ganglionated region of Ednrb het and null colons revealed an inverse relationship between the neuronal density and expression of nNOS and VIP. These changes increased from proximal to distal along the length of the gut, with no differences in the ileum, small changes in the proximal mid-colon (PMC), and the greatest alterations in the distal mid-colon (DMC). We show for the first time that the increase in nNOS expression is correlated with a reduction in ChAT expression, demonstrating that the balance between excitatory and inhibitory neurotransmitters is altered in the ganglionated portion of Ednrb null colons. These data provide new insight into the possible sensory and motor circuit disruptions that may contribute to the post-operative disorders seen in HSCR.
Materials and Methods
Animals
All procedures were approved by the University of Wisconsin Animal Care and Use Committee. We utilized a mouse model with neural-crest specific deletion of endothelin receptor B (Ednrbflex3/flex3) (15, 16). Mating the TgWnt1-Cre/+,Ednrbflex3/+ mice with Rosa26YFPStop,Ednrbflex3/flex3 or Rosa26tdTomatoStop,Ednrbflex3/flex3 mice resulted in deletion of exon 3, the absence of functional Ednrb and the presence of either yellow or red fluorescent proteins, YFP or tdTomato respectively, in neural crest cells. Ednrb null (Ednrbflex3/flex3) animals can be recognized by the absence of pigment in the trunk (as early as P3) and by the absence of ENCCs in their distal colon while Ednrb het (Ednrbflex3/+) animals display ENCCs throughout their entire colon. The mice were housed in a non-sterile environment.
Tissue Preparation
The gut of both Ednrb het and null mice was removed at postnatal ages (P) 3 and 21. For the study of VIP and Substance P, the distal small bowel and colon were opened longitudinally along the mesentary, rinsed three times in cold sterile PBS, and pinned to strips of sylgard, mucosa side down. The tissue was then placed in an organ bath with media containing colchicine to block axonal transport (Dulbecco’s MEM, sodium bicarbonate, penicillin/streptomycin, ampitercin, 0.1 mg·ml−1 colchicine, pH 7.4, 37°C) (17) and aerated with 5% CO2/95% O2 for 12–18 hours. Following this treatment, the tissue was washed in PBS and fixed in 4% paraformaldehyde (PFA) or 2% PFA with 15% picric acid at 4°C overnight. PFA-fixed tissue was washed in PBS twice and the PFA/picric acid-fixed tissue was washed in DMSO prior to rinsing in PBS. For the analysis of nNOS and ChAT, where colchicine treatment was not required, the tissue was opened, rinsed with PBS, pinned down in a sylgard dish with the mucosa side up, and fixed in 4% PFA for 4–6 hours at room temperature (RT) or overnight at 4°C. Prior to immunostaining, the mucosa was removed from the tissue to reduce autofluorescence.
Immunohistochemistry
Fixed whole-mount tissues consisting of intact bowel without mucosa were treated with 0.25–1.0% Triton X-100 for 4–6 hours at RT or overnight at 4°C, washed in PBS and then incubated with primary antibodies (Supplementary Table 1) for 4–6 hours at RT or overnight at 4°C. After rinsing with PBS they were then incubated in the corresponding secondary antibodies (Supplementary Table 1) for 4–6 hours at RT or overnight at 4°C. For neuronal density analysis, 3 fields of view per animal from 10x magnification images (300–1500 neurons/image) were randomly collected from the jejunum, ileum, proximal mid-colon (PMC), and distal mid-colon (DMC; which includes the transition zone in the Ednrb null). Hu immunoreactive cells in the image were then counted (n=3 animals/group). Neurotransmitter expression in Hu+ neurons in the myenteric plexus was determined by immunostaining for nitric oxide synthase (nNOS) and ChAT as described above. In order to visualize vasoactive intestinal peptide (VIP) and Substance P, tissues were treated with colchicine, as described, prior to immunostaining. For neurotransmitter analysis, three 20x images per animal (50–300 neurons/image) were collected randomly from the ileum, PMC, and DMC (n=3–6 animals/group). Co-localization studies were performed for both nNOS with Substance P and nNOS with ChAT. Three fields of view per animal from 20x magnification images (50–300 neurons/image) were collected randomly from the ileum and PMC (n=3–6 animals/group). Visualization of tdTomato expressing neurons in fixed tissue was performed without immunostaining since the fluorescence remains after fixation with PFA (see Figure 1). Submucosal neurons were imaged without removal of muscle layers or the mucosa using tdTomato tissue samples from the jejunum, ileum, proximal colon (PC), PMC, DMC, and distal colon (DC).
Figure 1.

Micrograph montage showing whole mount preparations of P21 Ednrb het (A) and null (B) distal ileum, cecum, and the entire colon. Circumferentially arranged ganglia are seen along the entire length of the bowel in the Ednrb het (A). Regions identified are ileum, cecum, proximal colon (PC), proximal mid-colon (PMC), distal mid-colon (DMC), and distal colon (DC). Ganglia appear as lines across the width of the colon. In the PC, the submucosal ganglia are arranged in a “V” shaped pattern, shown as dark lines, within the mucosal folds (see also, Supplementary Fig. 1). At the base of the “V”, the presence of ganglia is dramatically reduced (arrows). Note the Peyer’s Patch in the ileum and lymphoid follicles found in the colon (arrowheads). In the Ednrb null (B) ganglia are apparent in the PC and PMC, reduced in number in the DMC and almost completely absent in the DC which contains a significant number of sacral-derived nerve fascicles. The organization of ganglia in the proximal colon in the Ednrb null (B) is similar to the het (A). In the transition zone (TZ) ganglia are reduced in density and lack organization. Scale bar = 1 cm.
Cell Size
To measure the neuronal cell size eight-ten 40x z-series images per animal (~60 neurons/image) were collected from the ileum, PMC, and DMC of both Ednrb het and null preparations after Hu staining (n=3 animals/group). Using Nikon Elements (Nikon, USA), the area of each neuron was measured.
Image Analysis
The stained tissue was visualized using a Nikon inverted microscope equipped with a Photometric Cool-SNAP monochrome camera. Low magnification images were acquired using a Nikon SMZ1500 fluorescent stereoscope. High magnification images were taken on a Nikon A1 confocal microscope. The submucosal ganglia were visualized without removal of the muscle layers or the mucosa using a BioRad 1024 confocal microscope. Images were captured, processed, and analyzed with Metamorph (Molecular Devices, Palo Alto, CA, USA) or Nikon Elements. The images were processed and brightness and contrast may have been adjusted for clarity using the photo editing software Paint.NET (dotPDN LLC) and Photoshop (Adobe, USA).
Statistical Analysis
Data are expressed as mean +/− standard error of the mean (SEM). Statistical analysis was carried out using an unpaired Student’s t-test and P-values < 0.05 were considered significant.
Results
It is becoming increasingly clear that defects in HSCR are not limited to the aganglionic area (2). A detailed understanding of alterations that occur in the ENS is essential for elucidating the basis of the dysmotility and constipation seen in HSCR. These alterations may arise from changes in numbers of neurons and neurotransmitter expression, which together could alter the neuronal circuitry. To determine whether changes in the number and organization of ganglia occur in our mouse model of HSCR, we examined whole mount preparations of the jejunum, distal ileum, proximal mid-colon (PMC), and distal mid-colon (DMC). Our conditional knockout of Ednrb (Ednrbflex3/flex3; null) in ENCC recapitulates the phenotype of the conventional Ednrb mutants in terms of extent of colonization and longevity (11, 12, 18). Our Ednrb null mice die from enterocolitis at approximately postnatal day (P) 28 within the 4–8 week age range that has been described for endothelin ligand and receptor mutant animals (8–11, 13, 14, 18). Therefore, we examined Ednrb null and het animals at P21, before the nulls become moribund.
Organization and neuronal density in the ganglionated portion of Ednrb null colon
Representative whole mount images displaying the arrangement of ganglia in distal gut of P21 Ednrb het and null preparations are shown in Fig. 1 and 2. Ganglia are observed along the entire length of the gut in Ednrb het animals (Fig. 1A, 2A, C, E). However, they are absent from the distal third of the Ednrb null colon and are decreased in number and size in the proximal (PMC) and distal mid-colon (DMC) (Fig. 1B, 2B, D, F). The aganglionic region of Ednrb null animals contains a number of rostrally-directed fibers (Fig. 1B, 2F) (19). The myenteric ganglia in the entire Ednrb het colon and in the PMC of Ednrb nulls are generally arranged in rows perpendicular to the longitudinal axis of the gut. However, those in the Ednrb null DMC are smaller and the arrangement is less defined (Compare Fig. 2E and F).
Figure 2.

Micrographs made with a fluorescent dissecting microscope showing higher magnifications of portions of Figure 1. A, C, and E show P21 Ednrb het preparations and B, D, and F are Ednrb null. In the proximal colon (PC), (A and B), submucosal ganglia are arranged in a “V” shaped pattern (white arrowheads, see also Supplementary Fig. 1) while the myenteric ganglia appear as fine lines arranged horizontally across the width of the gut. Proximal mid-colon (PMC) of Ednrb het (C), and null (D) show similar patterns and density. Note that myenteric and submucosal ganglia cannot be distinguished from each other in these micrographs. Distal mid-colon (DMC) of Ednrb het (E) and null (F). Ganglia in the DMC are apparent in the Ednrb het but are reduced in number in the null. F shows the TZ and beginning of the aganglionic region in which sacral-derived nerve fascicles can be seen (black arrowheads). Scale bar = 2 mm.
The ganglia are organized in a distinctive pattern in the proximal colon of both Ednrb het and null animals and further investigation showed that this reflects a dense packing of the submucosal ganglia (arrowheads in Fig. 2A, B). Here, the submucosal ganglia appear in a distinct “V” shaped pattern that mirrors the shape of the mucosal folds (Supplementary Fig. 1), previously described by Payette et al. (20). At the base of a majority of the “V” shapes, myenteric and submucosal ganglia are significantly reduced in both genotypes (Fig. 1 arrow, 2A, B).
To provide a more detailed examination of the organization of the myenteric ganglia, whole mounts were stained with the neuronal marker Hu and imaged using confocal microscopy (Fig. 3). The myenteric ganglia in the ileum of Ednrb het and null preparations appear similar, while those in the Ednrb null PMC are smaller and contain more single cells compared to hets (Fig. 3C, D arrowheads). In the Ednrb null DMC, the size of myenteric ganglia are greatly reduced and are mostly 1–2 cells in width compared to hets which are 4–8 cells (Fig. E, F).
Figure 3.

Representative Z projection micrographs of Hu+ neurons in P21 myenteric ganglia in ileum, PMC, and DMC of Ednrb het (A, C, and E) and null (B, D, and F) animals. The size and number of ganglia in the ileum appears similar between the Ednrb het and null preparations (compare A and B). In the PMC (C and D), ganglia are reduced in size in the Ednrb null compared to the het. Also note the decrease in the width of the ganglia and the increase in number of single cells (arrowheads) distributed throughout the Ednrb null (D) in comparison to Ednrb het (C). The size of the ganglia in the Ednrb nullDMC (F) is substantially reduced with respect to the Ednrb het (E). Scale bar = 200 microns.
We measured the neuronal density in the myenteric and submucosal ganglia of P21 Ednrb het and null preparations. In the small intestine, the neuronal density of the myenteric ganglia in the jejunum and ileum is comparable between genotypes (472±63 versus 514±103 and 800±119 versus 862±158 neurons/mm2, respectively) (Fig 4); however, it is reduced slightly in the Ednrb null PMC (1070±65 versus 1310±24 neurons/mm2, p=0.03) and decreased by 70% in the DMC in comparison to Ednrb hets (425±108 versus 1419±105 neurons/mm2, p=0.003) (Fig. 4). In the submucosal ganglia, we found a significant difference in the neuronal density between Ednrb het and null animals in the ileum (243±13 versus 334±23 neurons/mm2, p=0.03) and distal colon (121±15 versus 14±14 neurons/mm2, p=0.007) (Fig. 4). A very small number of submucosal neurons are present in the Ednrb null distal colon that are derived from the sacral neural crest (Fig. 4) (19). Together these data show that the neuronal density in the myenteric ganglia decreases proximal to distal from the ileum to the colon in Ednrb null animals compared to hets.
Figure 4.
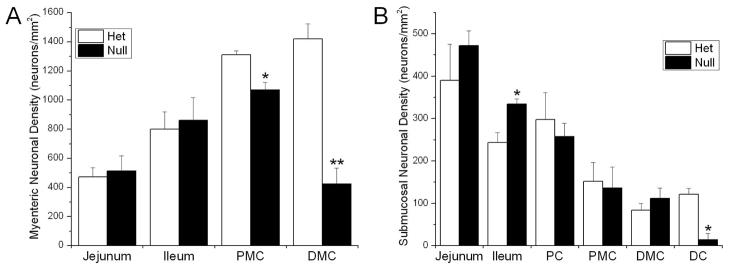
A. Density of P21 myenteric neurons in the jejunum, ileum, PMC, and DMC in Ednrb het and nullpreparations. The density is reduced to 80% in the Ednrb nullPMC and 30% in the DMC of that in the Ednrb het. B. Density of P21 submucosal neurons in the jejunum, ileum, PC, PMC, DMC, and DC in the Ednrb het and nullpreparations. The density is significantly reduced only in the ileum and DC of the Ednrb null. Note that cells found in the Ednrb null DC are of sacral origin. Only one out of nine samples showed the presence of neurons in the null DC. *p<0.05, **p<0.007.
Neuronal cell size is increased in Ednrb null colons
Close examination of the neurons in the ileum and colon of P21 Ednrb het, showed that the majority of Hu+ neurons ranged in size from 100–250μm2 with the area never exceeding 600μm2. The majority of neurons in the Ednrb het ileum have areas between 100–200μm2 while the majority in the null ileum show a decrease in area, with values between 50–150μm2 (Fig. 5). However, in the PMC of the Ednrb null animals, the size and distribution of Hu+ neurons is increased, with the majority between 150–300μm2, compared to the Ednrb het PMC with the majority between 100–200μm2 (Fig. 5). This shift in size is even greater in the Ednrb null DMC compared to het DMC. This is shown by the fact that 50% of the Ednrb null DMC neurons have areas larger then 300μm2 while 90% of the het DMC neurons have areas less then 300μm2 (Fig. 5 and 6). Therefore, we demonstrate that neuronal cell size increases in a proximal to distal gradient along the colon in Ednrb null animals compared to hets.
Figure 5.

Increased myenteric neuronal cell size in the colon of P21 Ednrb null animals. Bar graphs showing the percentage of Hu+ neurons ranging in size from 50–600μm2 in the ileum, 50–1050μm2 in the PMC, and 50–1200μm2 in the DMC of Ednrb het and null. In the ileum the majority of Ednrb null neurons show a reduction in size compared to hets. In contrast, in the PMC and DMC, Ednrb null animals contain a greater proportion of Hu+ neurons that are larger in size than those of the hets. Note the large increase of the proportion of neurons ≥ 400μm2. *p<0.05, **p<0.003.
Figure 6.
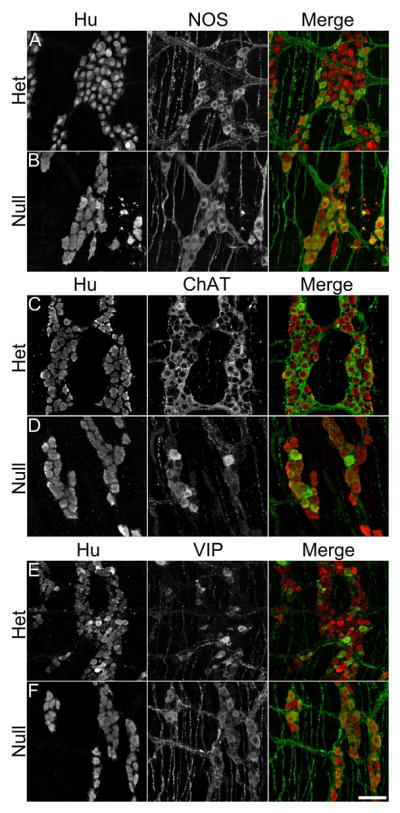
Representative Z projection micrographs of nNOS (A, B), ChAT (C, D) and VIP (E, F) expression in Hu+ neurons in myenteric ganglia of Ednrb het and null DMC. Fewer Hu+ cells are present in the ganglion of Ednrb nulls (B) but a larger percentage contain nNOS expression which is also of greater intensity compared to Ednrb hets (A). Expression of ChAT in Hu+ neurons (C, D). Fewer Hu+ neurons expressing ChAT are present in the ganglion of the Ednrb null (D) compared to het (C). VIP expression in Hu+ neurons, following colchicine treatment (E, F). A larger percentage of the Hu+ neurons express VIP in Ednrb null preparations (F) compared to the hets (E). Note, that the Hu+ neurons are increased in size in Ednrb nulls compared to the hets. Scale bar = 50 microns.
Neurotransmitter expression is altered in Ednrb null animals
The changes in the number and organization of ganglia led us to investigate the gut for possible alterations in neurotransmitter expression. We examined the expression of nNOS, VIP, ChAT, and Substance P in Hu+ neurons in the distal ileum, PMC, and DMC of P21 Ednrb het and null mice (Fig. 6 and Supplementary Fig. 2). The percentage of Hu+ neurons expressing either nNOS, VIP, or ChAT neurotransmitters was determined in P21 ileum, PMC, and DMC of Ednrb het and null animals (Fig. 6 and 7) (Substance P is shown in Supp. Fig. 2). In the ileum, the expression of neurotransmitters is similar in the Ednrb het and null animals, with the greatest proportion of neurons expressing ChAT (43±4% versus 48±8%) (Fig. 7). In the PMC, the percentage of neurons expressing nNOS is significantly increased (49±3% versus 33±1%, p=0.0003), the proportion expressing VIP is unchanged (28±2% versus 20±2%), and the fraction expressing ChAT is decreased in Ednrb nulls compared to hets (36±4% versus 47±2%, p=0.04) (Fig. 6 and 7). The largest differences were observed in the DMC, where nNOS (66±5% versus 34±2%, p=0.00002), VIP (48±5% versus 25±3%, p=0.02) and ChAT (28±3% versus 54±3%, p=0.001) were all significantly altered in the Ednrb nulls compared to hets (Fig. 7). In contrast, expression of Substance P is not different between Ednrb het and nulls in the regions examined (24–30% versus 25–33%) (Supplementary Fig. 3). In addition, we did not find any co-localization between Substance P and nNOS (data not shown). However, there is a small increase in the percentage of Hu+ neurons co-expressing nNOS and ChAT in the DMC of Ednrb nulls compared to hets (5±1% versus 2±1%), although not statistically significant (Fig. 7).
Figure 7.

Altered expression of nNOS, ChAT, and VIP in myenteric neurons of P21 Ednrb nulls compared to hets. Bar graphs showing the percentage of nNOS (A), ChAT (B), VIP (C) and nNOS/ChAT (D) in Hu+ neurons in the ileum, PMC, and DMC of P21 Ednrb het and null preparations. The percentage of nNOS expressing neurons is significantly increased in the PMC and DMC of Ednrb nulls in comparison to hets (A). These increases are correlated with decreased expression of ChAT (B). A significant increase in VIP expression was only detected in the DMC of Ednrb nulls when compared to hets (D). Only a very small proportion of Hu+ neurons co-express nNOS and ChAT which was increased in the DMC although this did not reach statistical significance (D). *p<0.05, **p<0.002, ***p<0.0001.
Examination of the aganglionic region of Ednrb null colons shows the presence of occasional Hu+ neurons located along nerve fibers. These fibers travel rostrally from the pelvic ganglion between the circular and longitudinal muscle of the colon. In the transition zone, Hu+ neurons are found in the serosa on sacral nerve fibers and most of these express nNOS (Supplementary Fig. 3). We have previously described the development and arrangement of these Hu+ neurons on sacral nerve fibers (19).
To determine whether these changes are present early in post-natal life or if they are a response to the functional distal obstruction that manifests by P21, we measured the neuronal density and percentage of Hu+ neurons expressing nNOS in P3 Ednrb het and null animals (Fig. 8). The neuronal density is reduced in all regions examined in the Ednrb null compared to hets, although the changes only reach statistical significance in the ileum and DMC (2718±317 versus 3975±118 neurons/mm2, p=0.03; and 1687±191 versus 3994±365 neurons/mm2, p=0.003; respectively) (Fig. 8). We observed a small increase in the percentage of nNOS neurons in the PMC (33±4% versus 25±3%) and a significant increase in the DMC (53±3% versus 25±1%, p=0.0008) (Fig. 8), although the magnitude is not as striking as that at P21. Therefore, it is clear that altered neuronal density and neurotransmitter expression is apparent early in post-natal life prior to the appearance of functional obstruction in the bowel of Ednrb null animals.
Figure 8.

A. Density of Hu+ myenteric neurons in the P3 ileum, PMC, and DMC in Ednrb het and null preparations. The density of neurons is significantly reduced in the Ednrb null ileum and DMC compared to hets. B. The percentage of nNOS+ neurons in the P3 Ednrb het and null gut. The proportion of nNOS+ neurons is slightly increased in the Ednrb null PMC and significantly greater in the DMC compared to Ednrb hets. *p<0.05, **p<0.005.
Together, we show a significant increase in nNOS expression and a parallel decrease in the proportion of ChAT expressing neurons in the ganglionated region of Ednrb null colons compared to hets. These changes are most apparent in the DMC and demonstrate that this portion of the colon proximal to the aganglionic region displays major alterations that might account for the dysmotility observed in HSCR patients.
Discussion
Although intestinal defects in HSCR are attributed to aganglionosis, post-surgical patients often continue to present with a variety of problems including motility disorders, constipation, and enterocolitis (2, 7). This suggests that the ganglionated portion of the colon that remains following surgery may not sustain normal bowel function and might explain observed clinical outcomes in HSCR patients. Examinations of the ganglionated portion of the colon in animal models of HSCR have previously shown variations in the number of enteric neurons as well as changes in the expression of neurotransmitters (12–14, 21). Studies in these models reveal a reduction in neuronal density and defects in the conduction of migrating motor complexes in the colon, suggesting neural circuitry is incomplete (12, 14). Building on those observations, we expanded our focus to the entire intestine and found that neuronal density declines while neuronal cell size increases in a proximal to distal gradient from the ileum to the colon in the Ednrb nulls compared to hets. In addition, the percentage of Hu+ neurons expressing nNOS and VIP increases while ChAT expression decreases along this same gradient. These data show that the balance of inhibitory and excitatory neurotransmitters is altered in the ganglionated portion of the Ednrb null colon.
Our results demonstrate that myenteric neuronal density differences are restricted to the colon is in agreement with previous reports examining Ednrb and endothelin 3 mutant animals (12–14). Roberts et al., (14) showed a 50% reduction in myenteric neuronal density in the post-cecal region of endothelin 3 mutant mice. These mice have a severe phenotype where 70–80% of the colon is aganglionic and a shorter life span compared to our Ednrb mutants (14). Ro et al., (12) reported large reductions in myenteric neuronal density in both the Ednrb mutant and heterozygous animals. Interestingly, these researchers also noted colonic aganglionosis in Ednrb heterozygous mice, a phenotype not observed in our animals.
In the submucosal plexus, we observed significant decreases in neuronal density in Ednrb null compared to het animals only in the ileum and aganglionic distal colon. Comparing our results with previously published data, no clear pattern of submucosal neuronal density changes emerges (13, 22). Sandgren and colleagues identified significant increases in submucosal ganglia in the ileum and proximal colon of endothelin 3 mutants compared to heterozygous animals (13). In contrast, in a different endothelin 3 mutant, a substantial decrease in the number of submucosal ganglia was detected along the entire colon (22). These disparities could result from different mouse genetic backgrounds, animal ages, or methods used to quantify the neuronal densities, such as cross section versus whole mount analysis. It is important to resolve these inconsistencies as the boundary of aganglionosis in HSCR patients is determined by the presence of the submucosal plexus (1). This variability suggests the number of submucosal neurons may not be predictive of the number of myenteric neurons.
We also noted that the neuronal cell size increases in a proximal to distal gradient from the ileum to the colon in the Ednrb nulls compared to hets, an observation consistent with the increases in cell size reported in the hypoganglionic region of the colon in endothelin 3 mutants (22). Cell hypertrophy is associated with a terminal phase in development and/or the presence of abundant growth factor. For example, Wang et al. (23) found an increase in enteric cell number and size after increasing the GDNF level in the gut. It is possible that the increase in size reported here could reflect an increase in the availability of local growth factors to the reduced numbers of neurons present in this hypoganglionic region of the colon. Increased neuronal size may also reflect a response to cell stress.
Changes in neurotransmitter expression are evident in the Ednrb nulls and correlated with neuronal density. In the Ednrb hets, the proportion of myenteric nNOS neurons (30%) is similar to the proportion of VIP (20–25%) neurons in the three intestinal regions studied. These values are comparable to those of Sang & Young (24) who found the percentage of nNOS and VIP myenteric neurons to be 35% in the colon and 26% in the small intestine. Interestingly, the decreased neuronal density at P21 in Ednrb nulls compared to hets is associated with an increase in the proportion of neurons expressing nNOS. Indeed, in the DMC we observed a 70% reduction in the neuronal density, an almost three-fold increase in the percentage of nNOS+ neurons and two fold increase in VIP expression. An elevation of both of these neurotransmitters was expected since nNOS and VIP are usually found together in inhibitory muscle motor neurons (24–26).
Decreases in neuronal density are not sufficient to produce changes in nNOS expression since in the colon of Gdnf heterozygous mice there is a 55–65% reduction in neuronal density, but no changes in the percentage of neurons expressing nNOS (14). Chalazonitis et al. (27) altered the neuronal density by modulating the levels of bone morphogenetic protein but observed no change in the proportion of nNOS+ neurons. To date, studies have failed to discern whether the density, region (ileum, colon), or nearby presence of aganglionosis is critical to the alterations in neurotransmitter expression.
In order to determine the developmental time course for these increases in nNOS, we examined the neuronal density and expression of nNOS at P3. Neuronal densities were reduced in Ednrb nulls to 57% in the PMC and 42% in the DMC of the values in Ednrb het mice, respectively. The proportion of nNOS+ neurons was increased in the Ednrb null PMC and DMC compared to hets. These results suggest that the changes observed here begin either during embryogenesis or early in post-natal life and then increase with age.
The large percentage of the neurons expressing nNOS in the Ednrb null mid-colon at both P3 and P21 suggested that changes in expression of other neurotransmitters may also occur. We hypothesized that neurons might either co-express nNOS and other transmitter(s) or express nNOS at the expense of another neurotransmitter. A large percentage of myenteric neurons are known to be cholinergic (50–60% in the mouse intestine) (24, 28). Therefore, it seemed reasonable to assume that the cholinergic population of cells could be affected in Ednrb null animals. Since we found only a very small percentage of neurons that co-express nNOS and ChAT and no co-expression of nNOS and Substance P (confirming the report of Sang and Young (24)), therefore co-expression of nNOS with other neurotransmitters cannot account for the changes we observed. Instead our results show that the increase in the percentage of nNOS+ neurons is equivalent to the decrease in the proportion of neurons expressing ChAT. This was shown by the fact that the sum of the percentages of nNOS+ and ChAT+ neurons is the same in Ednrb het and nulls. In the PMC of Ednrb hets, nNOS+ accounts for 33% and ChAT for 47% of the neurons while in the Ednrb nulls, these populations make up 48% and 35%, respectively. Thus, the increase in nNOS expression is directly correlated with the decrease in ChAT. This result is different from that reported by Wang et al. (23) who found that the percentage of ChAT+ neurons did not change although the proportion of nNOS increased after transgenic-mediated increases in GDNF. Our observations raise a number of questions. It is not clear which neuronal populations are changing and when these alterations occur. It is possible that cell fate could be affected. Cells fated to be ChAT+ neurons could instead become nNOS+/nitrigeric, or some post-mitotic precursors that have acquired a neural identity but not yet a transmitter phenotype could be directed to express nNOS. This proposed mechanism is in contrast to that suggested by Wang et al. (23) who advocate that the increase in the percentage of nNOS neurons is mediated by proliferation of committed precursors. Birth dating studies of nNOS and ChAT would be necessary to distinguish clearly these possibilities. Together, our results suggest that alterations in the hypoganglionic microenvironment mediate changes in cell density, size and neurotransmitter expression in Ednrb null animals.
In conclusion, we find that changes in neuronal density and the expression of the neurotransmitters, nNOS, VIP and ChAT in our Ednrb model of HSCR were restricted to the colon. Our data show an inverse relationship between neuronal density and the percentage of neurons expressing nNOS and VIP. The increase in proportion of nNOS+ neurons is complementary to the decrease in ChAT expression. This demonstrates that a change in the balance between excitatory and inhibitory neurotransmitters occurs in the ganglionated portion of Ednrb nulls, a finding which may explain the dysmotility observed in HSCR.
Supplementary Material
Supplementary Figure 1: A. Micrograph showing the distinctive mucosal folds (arrowheads) in the proximal colon of an Ednrb het animal. B. Nikon Elements was used to separate representative Z projections of myenteric (green) and submucosal (red) plexus from the Ednrb het proximal colon. Scale bar = A. 2mm, B. 100 microns.
Supplementary Figure 2: Representative Z projection micrographs of Hu and Substance P expression and proportion of Substance P expressing myenteric neurons in colchicine treated Ednrb het and null DMC. The density of neurons is reduced in the Ednrb nulls compared to hets (upper panel) although the relative percentage of Substance P neurons is similar (lower panel). Scale bar = 100 microns.
Supplementary Figure 3: Expression of nNOS in sacral derived cells in the DMC of the Ednrb null colon. A small, thin ganglion found at the edge of the transition zone superficial to the longitudinal muscle, probably derived from the sacral neural crest, contains a high percentage of nNOS expressing Hu+ neurons and fibers (yellow). Scale bar = 50 microns.
Supplementary Table 1. Table of antibodies used in this study.
Acknowledgments
We thank Keck Imaging and Lance Rodenkirch for the use of their confocal microscopes. We would also like to thank Peter Crump for his help with the statistical analysis.
Footnotes
Conflicts of Interest
No competing interests declared.
Author Contributions
IZ and CSE contributed equally. IZ, CSE, AJB, TK, JP, AH, AG, and MLE were responsible for experiments, data analysis, statistical analysis, and contributions to the manuscript. AJB, AG, and MLE wrote the manuscript, AG and MLE contributed equally to the direction of the project. This work was supported by a grant to MLE from the National Institutes of Health, USA (R01-DK081634) and a grant to AG from the Central Surgical Association Foundation.
References
- 1.Amiel J, Sproat-Emison E, Garcia-Barcelo M, et al. Hirschsprung disease, associated syndromes and genetics: a review. Journal Medical Genetics. 2008;45:1–14. doi: 10.1136/jmg.2007.053959. [DOI] [PubMed] [Google Scholar]
- 2.Kenny SE, Tam PK, Garcia-Barcelo M. Hirschsprung’s disease. Semin Pediatr Surg. 2010;19:194–200. doi: 10.1053/j.sempedsurg.2010.03.004. [DOI] [PubMed] [Google Scholar]
- 3.Parisi MA, Kapur RP. Genetics of Hirschsprung disease. Current Opinion In Pediatrics. 2000;12:610–7. doi: 10.1097/00008480-200012000-00017. [DOI] [PubMed] [Google Scholar]
- 4.McCallion AS, Chakravarti A. EDNRB/EDN3 and Hirschsprung disease type II. Pigment Cell Res. 2001;14:161–9. doi: 10.1034/j.1600-0749.2001.140305.x. [DOI] [PubMed] [Google Scholar]
- 5.Heanue T, Pachnis V. Enteric nervous system development and Hirschsprung’s disease: advances in genetic and stem cell studies. Nat Rev Neurosci. 2007;8:466–79. doi: 10.1038/nrn2137. [DOI] [PubMed] [Google Scholar]
- 6.Wallace AS, Anderson RB. Genetic interactions and modifier genes in Hirschsprung’s disease. World J Gastroenterol. 2011;17:4937–44. doi: 10.3748/wjg.v17.i45.4937. [DOI] [PMC free article] [PubMed] [Google Scholar]
- 7.Panza E, Knowles CH, Graziano C, et al. Genetics of human enteric neuropathies. Prog Neurobiol. 2012;96:176–189. doi: 10.1016/j.pneurobio.2012.01.001. [DOI] [PubMed] [Google Scholar]
- 8.Lane PW. Association of megacolon with two recessive spotting genes in the mouse. J Hered. 1966;57:29–31. doi: 10.1093/oxfordjournals.jhered.a107457. [DOI] [PubMed] [Google Scholar]
- 9.Webster W. Embryogenesis of the enteric ganglia in normal mice and in mice that develop congenital aganglionic megacolon. J Embryol Exp Morphol. 1973;30:573–85. [PubMed] [Google Scholar]
- 10.Baynash AG, Hosoda K, Giaid A, et al. Interaction of endothelin-3 with endothelin-B receptor is essential for development of epidermal melanocytes and enteric neurons. Cell. 1994;79:1277–85. doi: 10.1016/0092-8674(94)90018-3. [DOI] [PubMed] [Google Scholar]
- 11.Hosoda K, Hammer RE, Richardson JA, et al. Targeted and natural (piebald-lethal) mutations of endothelin-B receptor gene produce megacolon associated with spotted coat color in mice. Cell. 1994;79:1267–76. doi: 10.1016/0092-8674(94)90017-5. [DOI] [PubMed] [Google Scholar]
- 12.Ro S, Hwang SJ, Muto M, et al. Anatomic modifications in the enteric nervous system of piebald mice and physiological consequences to colonic motor activity. Am J Physiol Gastrointest Liver Physiol. 2006;290:G710–8. doi: 10.1152/ajpgi.00420.2005. [DOI] [PubMed] [Google Scholar]
- 13.Sandgren K, Larsson LT, Ekblad E. Widespread changes in neurotransmitter expression and number of enteric neurons and interstitial cells of Cajal in lethal spotted mice: an explanation for persisting dysmotility after operation for Hirschsprung’s disease? Dig Dis Sci. 2002;47:1049–64. doi: 10.1023/a:1015085923245. [DOI] [PubMed] [Google Scholar]
- 14.Roberts RR, Bornstein JC, Bergner AJ, Young HM. Disturbances of colonic motility in mouse models of Hirschsprung’s disease. Am J Physiol Gastrointest Liver Physiol. 2008;294:G996–G1008. doi: 10.1152/ajpgi.00558.2007. [DOI] [PubMed] [Google Scholar]
- 15.Druckenbrod NR, Powers PA, Bartley CR, et al. Targeting of endothelin receptor-B to the neural crest. Genesis. 2008;46:396–400. doi: 10.1002/dvg.20415. [DOI] [PMC free article] [PubMed] [Google Scholar]
- 16.Druckenbrod NR, Epstein ML. Age-dependent changes in the gut environment restrict the invasion of the hindgut by enteric neural progenitors. Development. 2009;136:3195–203. doi: 10.1242/dev.031302. [DOI] [PubMed] [Google Scholar]
- 17.Messenger JP, Furness JB. Projections of chemically-specified neurons in the guinea-pig colon. Arch Histol Cytol. 1990;53:467–95. doi: 10.1679/aohc.53.467. [DOI] [PubMed] [Google Scholar]
- 18.Stanchina L, Baral V, Robert F, Pingault V, Lemort N, Pachnis V, Goossens M, Bondurand N. Interactions between Sox10, Edn3 and Ednrb during enteric nervous system and melanocyte development. Dev Biol. 2006;295:232–49. doi: 10.1016/j.ydbio.2006.03.031. [DOI] [PubMed] [Google Scholar]
- 19.Erickson CS, Zaitoun I, Haberman KM, et al. Sacral neural crest-derived cells enter the aganglionic colon of Ednrb−/− mice along extrinsic nerve fibers. J Comp Neurol. 2012;520:620–32. doi: 10.1002/cne.22755. [DOI] [PMC free article] [PubMed] [Google Scholar]
- 20.Payette RF, Tennyson VM, Pomeranz HD, et al. Accumulation of components of basal laminae: association with the failure of neural crest cells to colonize the presumptive aganglionic bowel of ls/ls mutant mice. Dev Biol. 1988;125:341–60. doi: 10.1016/0012-1606(88)90217-5. [DOI] [PubMed] [Google Scholar]
- 21.von Boyen GB, Krammer HJ, Suss A, et al. Abnormalities of the enteric nervous system in heterozygous endothelin B receptor deficient (spotting lethal) rats resembling intestinal neuronal dysplasia. Gut. 2002;51:414–9. doi: 10.1136/gut.51.3.414. [DOI] [PMC free article] [PubMed] [Google Scholar]
- 22.Payette RF, Tennyson VM, Pham TD, et al. Origin and morphology of nerve fibers in the aganglionic colon of the lethal spotted (ls/ls) mutant mouse. J Comp Neurol. 1987;257:237–52. doi: 10.1002/cne.902570209. [DOI] [PubMed] [Google Scholar]
- 23.Wang H, Hughes I, Planer W, et al. The timing and location of glial cell line-derived neurotrophic factor expression determine enteric nervous system structure and function. J Neurosci. 2010;30:1523–38. doi: 10.1523/JNEUROSCI.3861-09.2010. [DOI] [PMC free article] [PubMed] [Google Scholar]
- 24.Sang Q, Young HM. Chemical coding of neurons in the myenteric plexus and external muscle of the small and large intestine of the mouse. Cell Tissue Res. 1996;284:39–53. doi: 10.1007/s004410050565. [DOI] [PubMed] [Google Scholar]
- 25.Qu ZD, Thacker M, Castelucci P, et al. Immunohistochemical analysis of neuron types in the mouse small intestine. Cell Tissue Res. 2008;334:147–61. doi: 10.1007/s00441-008-0684-7. [DOI] [PubMed] [Google Scholar]
- 26.Rivera LR, Poole DP, Thacker M, et al. The involvement of nitric oxide synthase neurons in enteric neuropathies. Neurogastroenterol Motil. 2011;23:980–8. doi: 10.1111/j.1365-2982.2011.01780.x. [DOI] [PubMed] [Google Scholar]
- 27.Chalazonitis A, Pham TD, Li Z, et al. Bone morphogenetic protein regulation of enteric neuronal phenotypic diversity: relationship to timing of cell cycle exit. J Comp Neurol. 2008;509:474–92. doi: 10.1002/cne.21770. [DOI] [PMC free article] [PubMed] [Google Scholar]
- 28.Sang Q, Young HM. The identification and chemical coding of cholinergic neurons in the small and large intestine of the mouse. Anat Rec. 1998;251:185–99. doi: 10.1002/(SICI)1097-0185(199806)251:2<185::AID-AR6>3.0.CO;2-Y. [DOI] [PubMed] [Google Scholar]
- 29.Hao MM, Young HM. Development of enteric neuron diversity. J Cell Mol Med. 2009;13:1193–210. doi: 10.1111/j.1582-4934.2009.00813.x. [DOI] [PMC free article] [PubMed] [Google Scholar]
- 30.Pham TD, Gershon MD, Rothman TP. Time of origin of neurons in the murine enteric nervous system: sequence in relation to phenotype. J Comp Neurol. 1991;314:789–98. doi: 10.1002/cne.903140411. [DOI] [PubMed] [Google Scholar]
Associated Data
This section collects any data citations, data availability statements, or supplementary materials included in this article.
Supplementary Materials
Supplementary Figure 1: A. Micrograph showing the distinctive mucosal folds (arrowheads) in the proximal colon of an Ednrb het animal. B. Nikon Elements was used to separate representative Z projections of myenteric (green) and submucosal (red) plexus from the Ednrb het proximal colon. Scale bar = A. 2mm, B. 100 microns.
Supplementary Figure 2: Representative Z projection micrographs of Hu and Substance P expression and proportion of Substance P expressing myenteric neurons in colchicine treated Ednrb het and null DMC. The density of neurons is reduced in the Ednrb nulls compared to hets (upper panel) although the relative percentage of Substance P neurons is similar (lower panel). Scale bar = 100 microns.
Supplementary Figure 3: Expression of nNOS in sacral derived cells in the DMC of the Ednrb null colon. A small, thin ganglion found at the edge of the transition zone superficial to the longitudinal muscle, probably derived from the sacral neural crest, contains a high percentage of nNOS expressing Hu+ neurons and fibers (yellow). Scale bar = 50 microns.
Supplementary Table 1. Table of antibodies used in this study.