

Abstract
Biocompatible nanomaterials and hydrogels have become an important tool for improving cell-based therapies by promoting cell survival and protecting cell transplants from immune rejection. Although their potential benefit has been widely evaluated, it is currently not possible to determine, in vivo, if and how long cells remain viable following their administration without the use of a reporter gene. We here report a pH nanosensor-based magnetic resonance imaging (MRI) technique that can monitor cell death in vivo non-invasively. We demonstrate that specific MRI parameters that change upon cell death of microencapsulated hepatocytes are associated with the measured bioluminescence imaging (BLI) radiance. Moreover, the readout from this pH-sensitive nanosensor can be directly co-registered with high-resolution anatomical images. All the components of these nanosensors are clinical-grade and hence this approach should be a translatable and universal modification of hydrogels.
Cellular therapies have emerged as a promising treatment for many otherwise untreatable diseases and disorders1–4. However, widespread clinical implementation5–8 has been hampered partially because of poor long-term functionality and survival of therapeutic cells. In particular, it is not well understood whether graft failure may be the simple result of cell death following transplantation and, if so, when this occurs. A non-invasive imaging method that can probe cell viability would, therefore, speed up human translation of cell therapies. As of today, radionuclear imaging with 111In-oxine-labeled cells is the only FDA-approved tracking method available in the clinic9, but it cannot assess cell survival. This latter problem is common for all imaging techniques employing exogenous labeling agents that continue to display contrast when cells are dying, including magnetic resonance imaging (MRI) of superparamagnetic iron oxide (SPIO)-labeled cells10. In contrast, reporter gene-based imaging relies on proteins that either accumulate or convert substrates, and ribosomal production occurs only in live cells. Reporter gene-based imaging is well established in the pre-clinical setting with luciferase-based bioluminescent imaging (BLI) being exceptionally robust11. However, this technique is limited to small animals because of the light absorption and scattering by the tissue. PET is a clinical imaging modality providing a reporter gene-based approach that has recently been introduced into the clinic using the herpes simplex virus 1 thymidine kinase12. However, even when humanized, such a xenogeneic (bacterial) protein raises clinical concerns of potential immunogenicity. Moreover, in order to achieve a stable, constitutive expression, lenti- or adenoviruses need to be used which also poses clinical concerns about overall safety.
Furthermore, the widespread use of clinical cell therapy has been hampered by graft immunorejection and the lack of cells that have the proper histocompatibility antigenic makeup. Microencapsulation has been proposed as a way to immunoprotect the graft by embedding them within a semi-permeable hydrogel (Supplementary Fig. S5). This approach allows free diffusion of small molecules such as insulin, therapeutic growth factors and cytokines, nutrients, and metabolites, while blocking invading host immune effector cells and immunoglobulins. Microencapsulation has been used for cell therapy of liver failure13,14, type I diabetes mellitus, and pancreatic carcinoma7. By embedding contrast agents during synthesis, the engraftment of encapsulated cells has been tracked using X-ray/CT15–18, US16–18, and MR imaging16–19. However, none of these techniques has been able to report on cell survival, and merely allow anatomical co-registration of engrafted cells together with real-time, image-guided delivery.
Chemical exchange saturation transfer (CEST) is an emerging MRI contrast mechanism20–23 based on the use of radiofrequency (RF) saturation pulses to detect agents containing protons that exchange rapidly with water. Importantly, the exchange rate, and thus the CEST contrast, can depend strongly on pH20,21,24 (Fig. 1). When the pH decreases from its normal cellular value (pH=7.3), the exchange rate (ksw) decreases for base-catalyzed exchangeable protons, such as the guanidyl NH protons in L-arginine, leading to a decrease in CEST contrast. Cell death and inflammation are also associated with concurrent acidification of extracellular pH25–27. We hypothesized that advanced biomaterials that can sense changes in pH may be used as nanosensors for probing cell viability.
Figure 1. Schematic showing the principles of in vivo detection of cell viability using LipoCEST microcapsules as pH nanosensors.

The CEST contrast is measured by the drop in the signal intensity (ΔS) of water after selective saturation (i.e. removal of capability to generate signal) of the NH protons in L-arginine at 2 ppm. The L-arginine protons (red) inside the LipoCEST capsules exchange (kSW) with the surrounding water protons. The kSW is reduced at lower pH causing a significant drop in CEST contrast.
Using L-arginine, a molecule with multiple exchangeable NH protons, as a pH-sensitive CEST contrast agent (Fig. 1), we present here an approach for non-invasive imaging of the viability of encapsulated cells. To this end, we synthesized arginine-rich “LipoCEST” microcapsules by incorporating L-arginine filled liposomes inside the capsule and protamine sulfate as an arginine-rich cross-linker in the alginate capsule coating. We demonstrate that apoptotic encapsulated human hepatocytes can be readily detected with CEST MRI in vivo, and validated this with conventional BLI using the luciferase reporter gene.
Two main criteria were used for the selection of marker molecules used as pH nanosensors: 1) the pH-dependent MRI CEST contrast should be sensitive to pH changes between 6.0–7.5, i.e. the physiological range; and 2) the nanosensor should be biocompatible for possible future clinical translation. Based on our previous studies28,29 L-arginine containing liposomes (Fig. 1) are ideal, as they possess a strong pH-dependent CEST contrast within this pH range and L-arginine is FDA-approved. As we have shown previously for arginine peptides28, their pH sensitivity is due to a reduction in the exchange rate (kSW) of the guanidyl protons of L-arginine with water protons when pH decreases. Fig. 2 shows the preparation and structure of microcapsules with the portions of the CEST probes containing exchangeable protons that generate CEST contrast labeled in red. In brief, alginate microcapsules loaded with L-arginine liposomes were prepared by mixing these liposomes with alginate and cells followed by gelation with Ba2+ ions, then crosslinking these beads with either clinical grade protamine sulfate (PS) or poly-L-lysine (PLL), and coating with a second layer of alginate30,31 (Fig. 2a). This composition is similar to the formulations tested clinically5,32. Light microscopy (Fig. 2b) showed a uniform distribution of cells within the microcapsules, which have a diameter of ~350 μm.
Figure 2. Cartoon outlining the procedure for preparation of LipoCEST microcapsules.
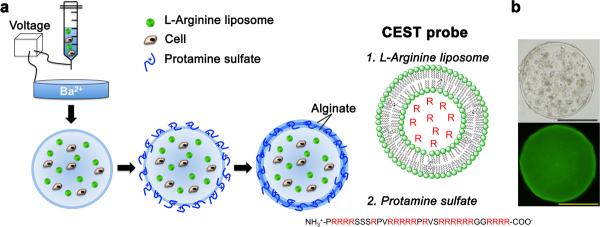
a, A mixture of cells, alginate and L-arginine liposomes is passed through a needle using a nanoinjector pump. The single-layered charged alginate droplets are collected, washed and resuspended in a crosslinker solution (protamine sulfate, PS), followed by a coating with a second layer of alginate. The L-arginine (R) moieties (red) entrapped in liposomes (1.) and in PS (2.) have exchangeable protons that provide CEST contrast. b, Phase contrast image (top) and fluorescent image (bottom; with NBD-PE labeled liposomes) shows a uniform distribution of cells and liposomes within the microcapsule. Scale bar = 200 μm.
To optimize the pH nanosensor, we compared six formulations (n=3) with the two crosslinkers (PLL and PS) to form alginate-PLL-alginate (APLLA) and alginate-PS-alginate (APSA) capsules, respectively. The CEST contrast was measured at pH=7.4 following RF saturation pulses at 2 ppm (arginine protons) from the water resonance frequency. Fig. 3 shows the measured CEST contrast, which is defined as MTRasym, i.e. MTRasym (S−Δω − S+Δω)/S−Δω, where S−Δω and S+Δω are the MRI signal intensities after saturation at −Δω and +Δω frequency offsets from the water proton frequency (set at 0 ppm). For both crosslinkers, the addition of liposomes to microcapsules enhanced the CEST contrast at 2 ppm (Fig. 3 and Supplementary Fig. S1). Furthermore, PS provided much higher CEST contrast than PLL. This is not surprising, as the contrast at 2 ppm is primarily produced by the guanidyl protons of the arginine side chain, which are present on both L-arginine and arginine-rich PS28 but not in PLL.
Figure 3. Experimental data determining the CEST MRI contrast and stability for LipoCEST microcapsules as a function of formulation.

a, CEST contrast (MTRasym) map at 2 ppm for six formulations of microcapsules (n=3) (top) with their respective MTRasym values (bottom). Shown are the LipoCEST data for 70 (Lipo70-APLLA and Lipo70-APSA), 50 (Lipo50-APSA), and 30 (Lipo30-APSA) mol% of cholesterol. Formulations without L-arginine liposomes include PS-crosslinked microcapsules (APSA, solid bar) and APLLA capsules (open bar). b, Stability profile as measured by MTRasym for Lipo70-APSA and Lipo50-APSA capsules after 0, 7, 14, and 30 days of incubation at 37 °C with daily replacement of saline. PLL: Poly-L-Lysine; PS: Protamine Sulfate; A = Alginate.
It has previously been reported that different concentrations of cholesterol may affect the release profile of cargo molecules from liposomes embedded in alginate33. We therefore evaluated different ratios of cholesterol used for preparing liposomes. APSA capsules with liposomes prepared with increased cholesterol content produced the highest CEST contrast (Fig. 3a).
We then measured the in vitro stability of the CEST contrast for the two best formulations, Lipo70-APSA and Lipo50-APSA, over a period of one month at 37°C with daily replacement of saline. Lipo70-APSA showed a relatively constant contrast, with an overall decrease in MTRasym of ~0.06 over one month (Fig. 3b). The rates of decrease (stabilities) for the two formulations were comparable and based on the magnitude of CEST contrast produced by Lipo70-APSA capsules, we selected this formulation for the remainder of the studies.
Next, we tested the sensitivity of Lipo70-APSA for probing pH values in the physiological range. The MTRasym decreased by 0.24 from pH 7.5 to 5.5. (Fig. 4a), demonstrating that the sensor is mainly sensitive over the pH range of 6.0–7.5. The spatial selectivity of CEST contrast with pH changes was examined through the addition of 10 μL aliquots of 1 M hydrochloric acid (Fig. 4b–d) to the top of a sample containing homogeneously distributed capsules. The CEST contrast at 2 ppm (Fig. 4c, pH 7.4) corresponded to individual capsules in Fig. 4b (pH 7.4) and was constant. After addition of a total of 100 μL acid, the MTRasym map showed a clear reduction in CEST contrast within the top layer but not the bottom layer (Fig. 4c, addition of acid). The top layer contrast was reduced proportionally to the total acid volume (Fig. 4d), with a 33% decrease in contrast upon reduction of the pH from 7.4 to 6.9. These results indicate that LipoCEST capsules are sufficiently sensitive to be used as imaging probes for detecting pH changes in the physiological range.
Figure 4. Experimental data displaying the sensitivity of the MRI contrast for the LipoCEST capsules prepared to local pH.
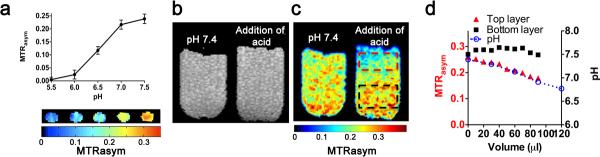
a, MTRasym at 2 ppm for Lipo70-APSA at pH 5.5–7.5, showing the sensitivity to pH changes. b, MT-weighted image showing individual LipoCEST capsules; c, MTRasym map at 2 ppm of capsules without (pH=7.4) and with addition of HCl. MTRasym values are lower at the top (red box) compared to bottom layer (black box) after addition of 100 μl of 1M HCl without mixing. d, MTRasym values at the top (red) change over the volume of the HCl solution added dropwise, blue curve shows the corresponding changes in pH. Note that no significant changes can be observed at the bottom of the tube (black).
Capsule permeability was assessed through measurement of lateral diffusion of 10–500 kDa dextrans labeled with FITC34 (Supplementary Methods). All of the tested capsule formulations were permeable to 10–150 kDa dextran-FITC, semi-permeable to 250 kDa dextran-FITC, and impermeable to 500 kDa dextran-FITC (Supplementary Fig. S2). Their mechanical strength was then tested by placing them under osmotic pressure and by agitating with glass beads35. The APSA capsules had a higher mechanical strength than APLLA capsules. In general, the Lipo70-APSA appeared to possess a similar size selective permeability and favorable mechanical strength compared to APLLA (formulation used in clinical trials).
To evaluate whether LipoCEST-based imaging can report on the viability of grafted cells, encapsulated hepatocytes were imaged before and after the induction of apoptosis using staurosporine (STS). Apoptosis is one of the main causes for early cell death in transplanted cells36. We observed a significant drop in the MTRasym at 2 ppm at 12 hrs after induction of apoptosis (Fig. 5a). The MTRasym of the STS-treated capsules containing apoptotic cells was significantly lower than that of the untreated capsules containing live cells (n=3, P<0.01, Fig. 5b), resulting from the drop in pH as cell death occurred. The MTRasym of the dead cells group did not decrease over time. In theory, this decrease in CEST contrast could also be due to the loss of L-arginine, however, this is highly unlikely based on our stability measurements (the MTRasym at day 0 was the same as that at day 7; Fig. 3b).
Figure 5. In vitro experimental data verifying that LipoCEST capsules can report on apoptosis through MRI contrast.

a, MR images of LipoCEST capsules containing hepatocytes. Shown are MTRasym maps at 2 ppm before (0 hr) and after (12 hrs) addition of staurosporine (apoptotic cells), without STS (live cells), or cells treated with STS before encapsulation (dead cells). b, MTRasym for the three groups at 0 hr (open bars) and 12 hrs (solid bars). c, Fluorescence overlay images of capsules from the STS and control phantoms shown in (a). Samples are stained for live cells (FDA, green), dead cells (PI, red), and apoptotic cells (Annexin V, blue). Scale bar = 200 μm.
Immunofluorescent staining (Fig. 5c) revealed that STS-treated capsules (top panel) contained mostly apoptotic cells while non-treated capsules (middle panel) contained predominantly live cells, and with STS-treated cells representing dead cells (bottom panel). Since we observed no significant decrease in contrast in capsules without the addition of STS, we conclude that the decrease in CEST must be derived from cells undergoing apoptosis. Moreover, STS-treated capsules containing a different numbers of cells (Supplementary Fig. S4) showed that the magnitude of the decrease in MTRasym is positively associated with the number of dead cells as quantified using BLI (transduction of cells with luciferase; Supplementary Fig. S3a). In response to a decrease in average radiance, the relative CEST contrast decreased, which corresponded to about 1×10⁵ apoptotic cells. To validate that co-encapsulation with LipoCEST agents did not affect cell survival, BL images were collected. As similar to APLLA, LipoCEST capsules were non-cytotoxic to encapsulated hepatocytes as observed in culture for 30 days (Supplementary Fig. S3), which showed these capsules were suitable to pursue in vivo studies.
2,500 LipoCEST capsules containing Luc-transfected hepatocytes were subcutaneously (s.c.) transplanted into the flank region of immunocompetent Balb/C mice. Multiple transplantation routes and sites37 have been considered for delivery of therapeutic cells, including the peritoneal cavity37, portal vein38 and s.c.37,39–41. We chose the s.c. delivery route because this site has several advantages, including a superficial location allowing collection of high quality bioluminescence data42,43, a well-defined anatomical region of interest for CEST imaging, and a relatively limited supply of nutrients and oxygen that will cause cell death over time.
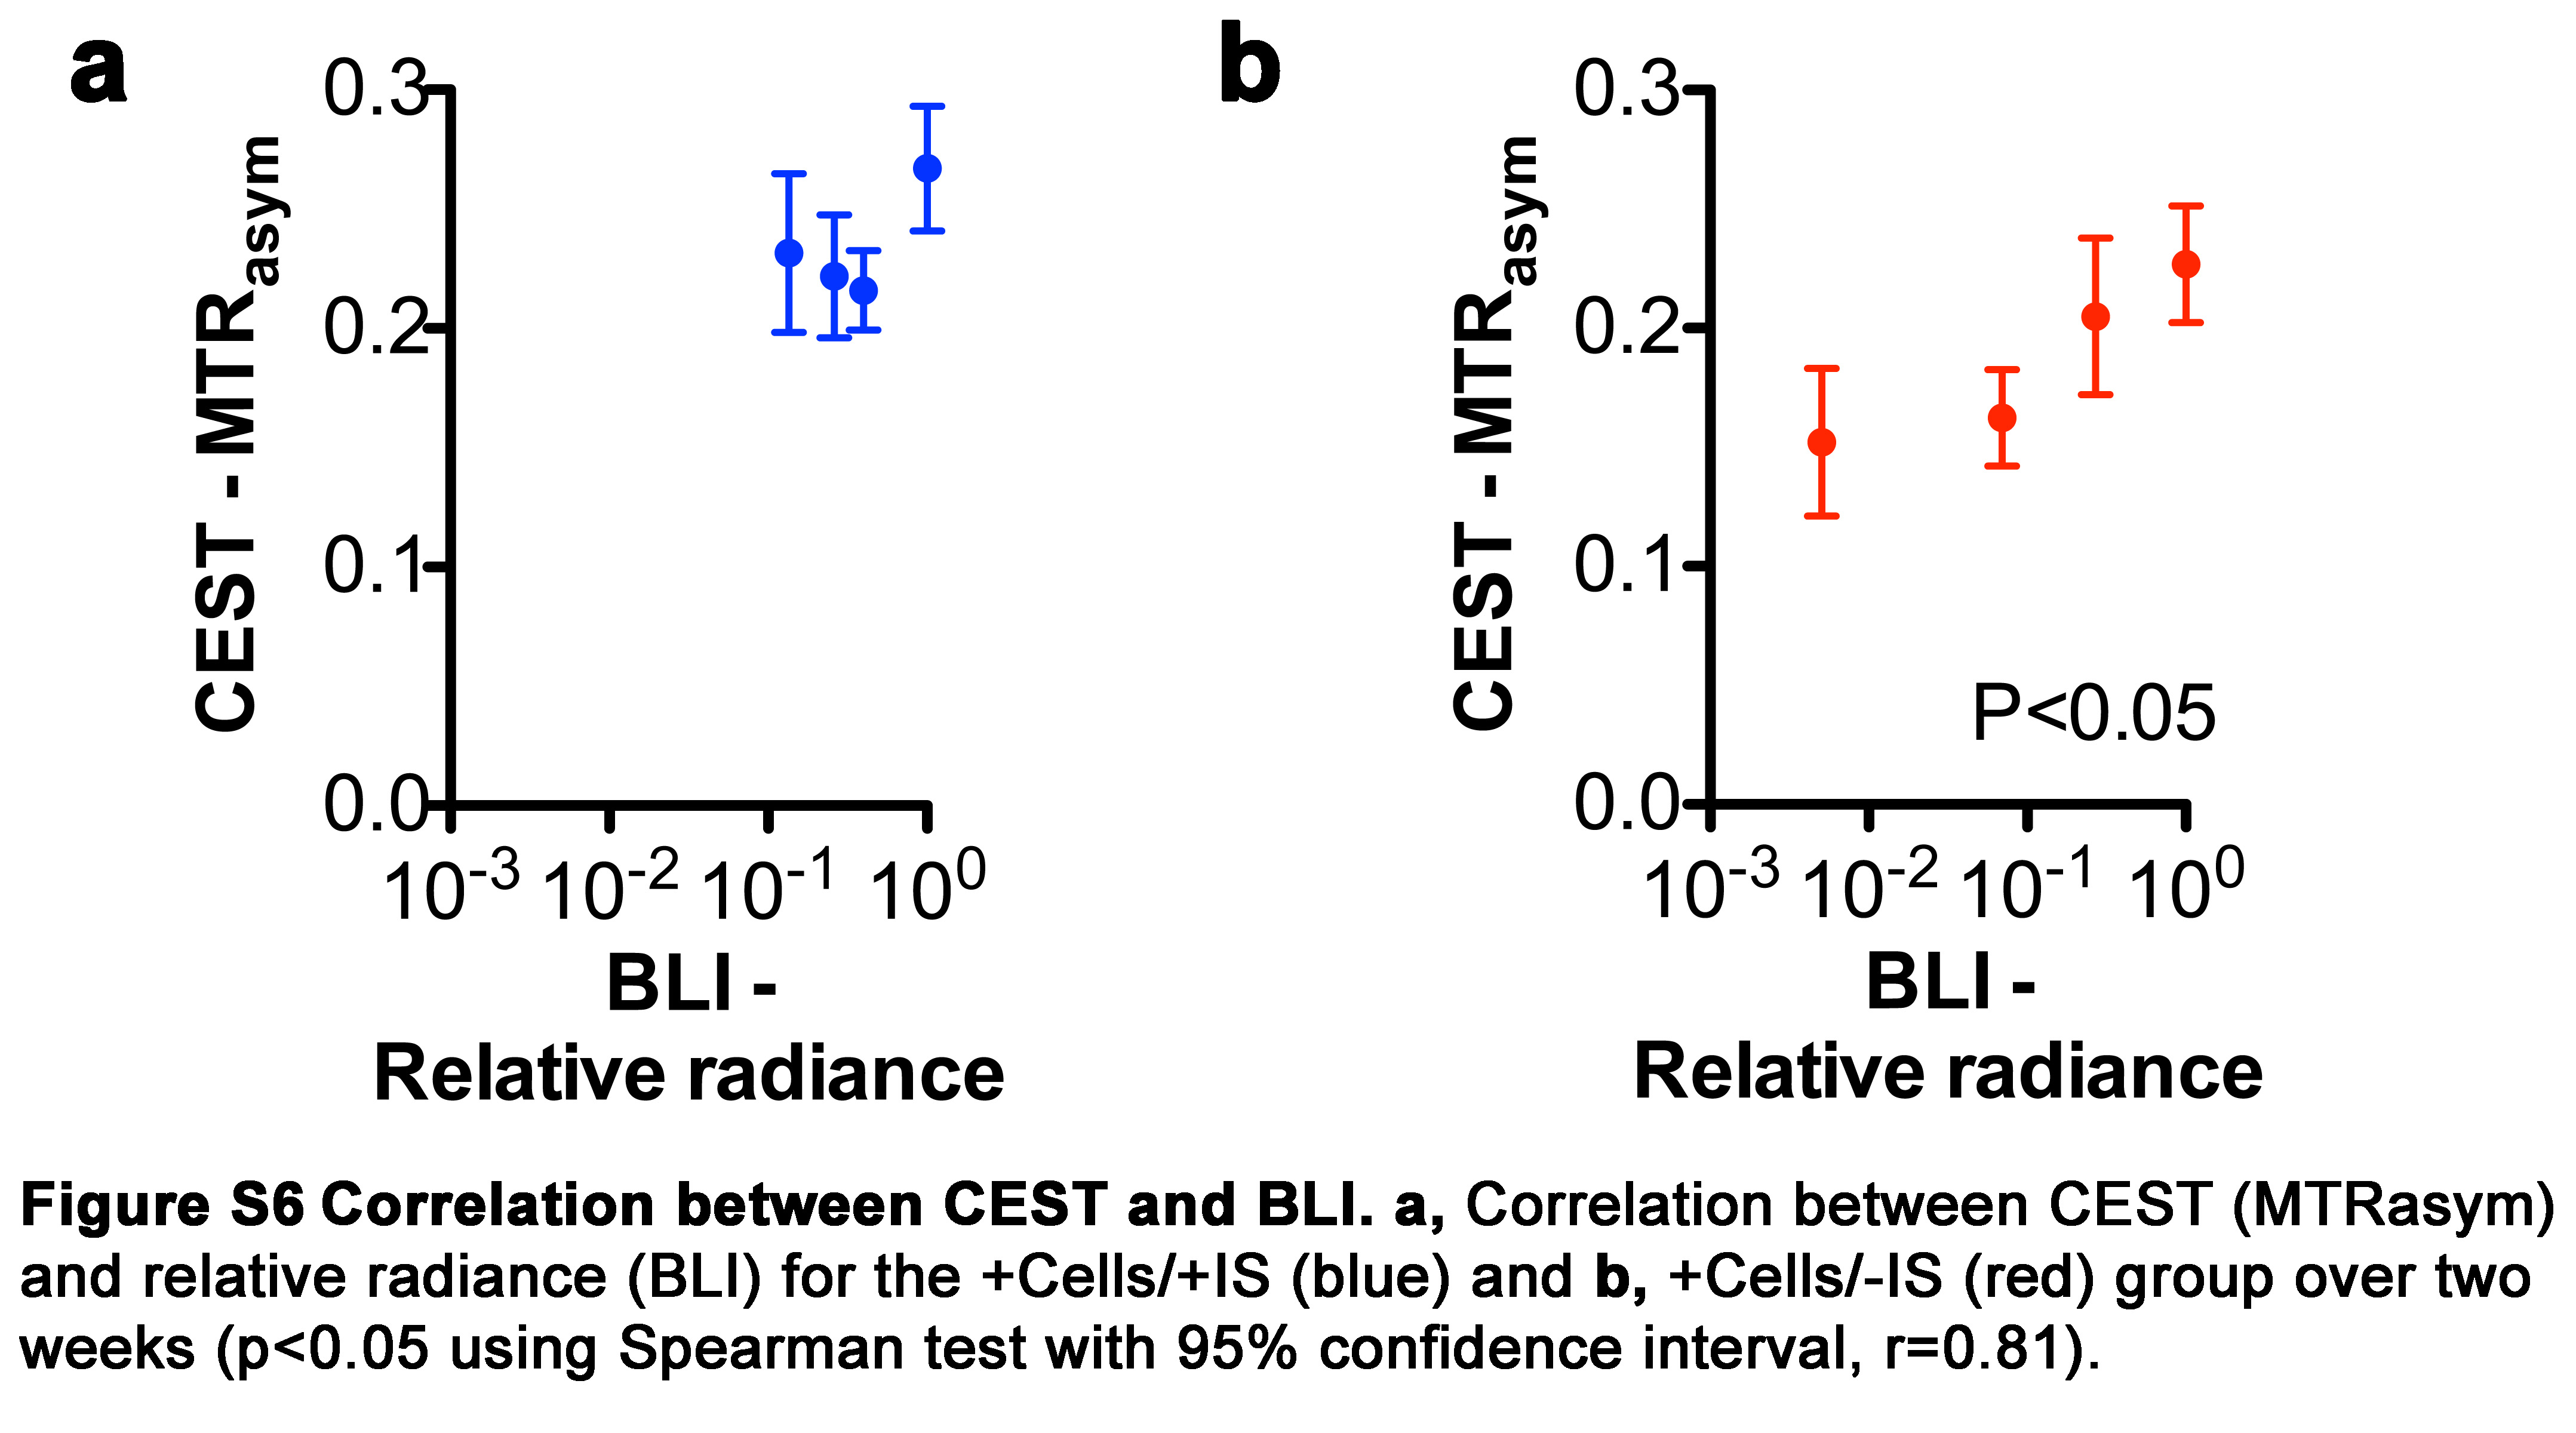
CEST and BL images were collected for three groups of mice at 6 hours (day 0), one day, one week and two weeks after transplantation (Fig. 6). These groups consisted of LipoCEST capsules (Fig. 6a) without cells (−Cells), LipoCEST capsules loaded with hepatocytes transplanted in mice receiving immunosuppression (+Cells/+IS), and LipoCEST capsules loaded with hepatocytes transplanted in non-immunosuppressed mice (+Cells/−IS). The group without cells displayed a stable CEST contrast (0.23±0.01; n=4), in good agreement with our in vitro data (0.28±0.02; Fig. 3b) over two weeks. The CEST contrast of the two groups containing encapsulated hepatocytes decreased on day 1. Importantly, the decrease in contrast of the +Cells/+IS group was less severe than the +Cells/−IS group (Fig. 6b), corresponding to a smaller decrease in BL signal (Fig. 6e,f). This pattern was consistently observed for all animals within these groups. The CEST contrast for both the +Cells/+IS and +Cells/−IS group decreased by about ~14% on day 1, confirmed by an order of magnitude decrease in BL signal (Fig. 6f). This initial drop in cell viability is commonly observed in cell transplantation studies44. In the +Cells/+IS group, the CEST contrast remained approximately constant during the remainder of the 14-day study, in agreement with the BL signal hovering around ~106 p/s/cm2/sr during this time period (Fig. 6f). A significant loss in contrast was observed in the +Cells/−IS group on days 7 and 14 (28% and 33%, respectively), which was associated with a significantly lower BL signal on days 7 and 14 as compared to day 0 (n=8; P<0.01), and as compared to the +Cells/+IS group (Fig. 6b,f). The CEST contrast the +Cells/−IS group correlated with the viability as measured by BLI, with P<0.05, r=0.81 (Fig. 6d,f and Supplementary Fig. S6). Based on our permeability measurements, the LipoCEST capsules possessed a cut-off pore size that would still allow small molecules to invade the encapsulated cells45, and hence less viable hepatocytes were found in the +Cells/−IS group (radiance ~104 p/s/cm2/sr). In the +Cells/+IS group, immunosuppression46,47 alleviated this and resulted in BL signal one order of magnitude larger than the +Cells/−IS group. These observations demonstrate that the CEST method is sensitive enough to observe the different rates of cell death in these two groups of animals, although the nature of the contrast mechanism between the BLI and CEST is different. According to the BLI data (Supplementary Fig. S3a,b), we estimate that the death of 3×10⁵ hepatocytes (out of 5×10⁵ transplanted) will result in a 33% drop in CEST contrast, indicating a significant sensitivity of this approach in vivo (Supplementary Methods). In addition, we studied the CEST contrast changes at 28 days after transplantation in three groups of animals: +Cells/+IS, +Cells/−IS, and +DeadCells/+IS groups (Supplementary Fig. S9). The +DeadCells/+IS group had capsules containing cells that were treated with STS before encapsulation, and exhibited no BLI signal. Similar to the in vitro studies, the CEST contrast of the +DeadCells/+IS group did not change over time. The CEST contrast of the +Cells/−IS group was significantly lower than that of the +Cells/+IS group at day 28 (P<0.05; Supplementary Fig. S9a). Moreover, in the +Cells/+IS group, we found that the CEST signal had a significant decrease at day 28 (P<0.01; Supplementary Fig. 9b,e) as compared to day 0, which corresponds to a significant decrease in BLI signal at day 28 as compared to day 0 (P<0.001; Supplementary Fig. S9d,e).
Figure 6. In vivo CEST and BL imaging of LipoCEST capsules containing hepatocytes.

Balb/c mice were s.c. transplanted with 2,500 empty LipoCEST capsules (−Cells), with LipoCEST capsules containing Luc-transfected hepatocytes while receiving immunosuppression (+Cells/+IS), and with capsules containing cells but no immunosuppression (+Cells/−IS). a, CEST/MTw overlays using a frequency offset of 2 ppm at day 0, 1, 7, and 14 after transplantation; b, average MTRasym values for the −Cells (n=4, black), +Cells/+IS (n=8, blue), and +Cells/−IS (n=8, red). c, H&E stain of the s.c. transplant site for −Cells (left), +Cells/+IS (middle), and +Cells/−IS (right). Arrows outline dense layers of surrounding host cells; animals without immunosuppression (right) show the strongest host immune response. d, BL images of the same animals in panel a. e, BLI relative radiance for the 2 groups of mice with encapsulated hepatocytes over a time course of 2 weeks. (*P<0.05, **P<0.01, ***P<0.001).
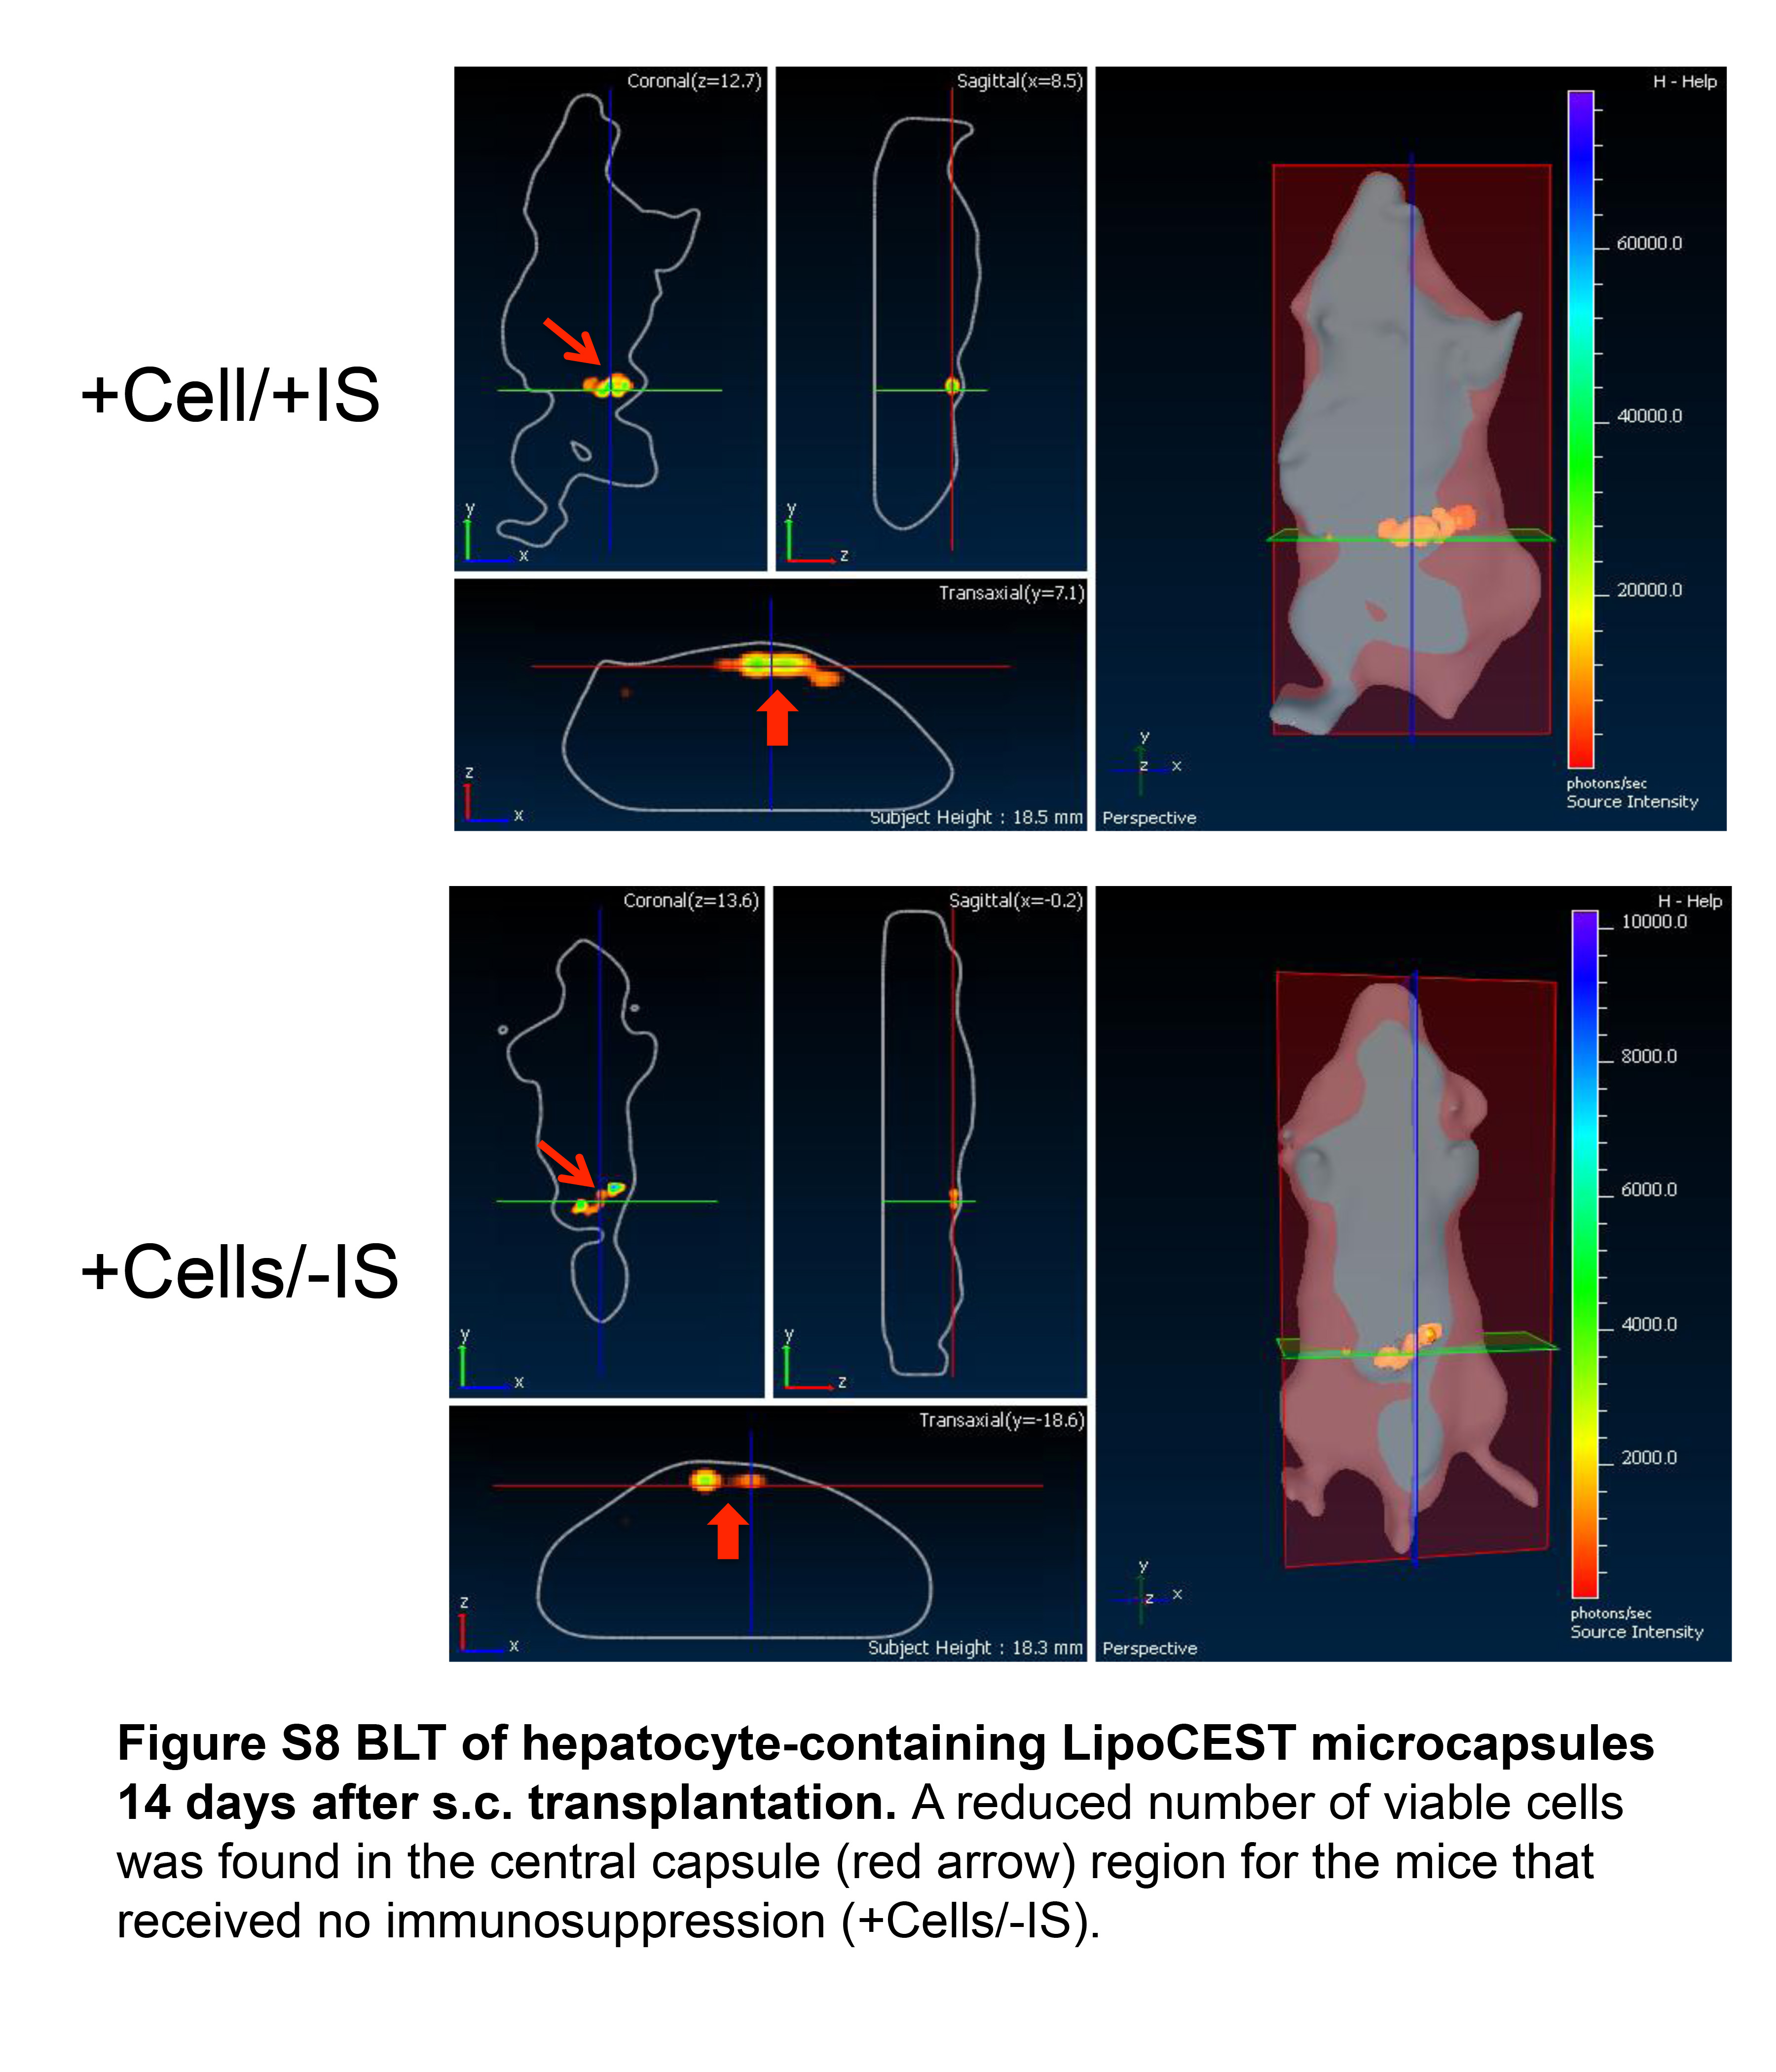
Co-registration of CEST images and conventional anatomical images allowed a further evaluation of the temporal-spatial differences that were observed between the groups. On day 14, CEST contrast at the center was 34% lower than that of the edge of the region containing LipoCEST capsules for mice in the +Cells/−IS group. The MT-weighted images (Supplementary Fig. S7) indicated that there were approximately the same numbers of capsules in these two regions. To investigate whether this local drop in contrast was associated with local changes in cell viability, we collected 3D bioluminescent tomographic (BLT) images (Supplementary Fig. S8). BLT detected a lower number of viable cells in the center of the capsule transplantation site for the +Cells/−IS mice, which was not observed in the +Cell/+IS mice. This corroborated with CEST results and a reduced availability of nutrients and oxygen in the center region is a likely cause.
Histology was performed to assess the inflammatory and immune responses of the host towards transplanted capsules. Haematoxylin and Eosin (H&E) staining showed distinctive differences among the three groups of mice for both the total number of infiltrating cells and cells surrounding each capsule (Fig. 6c), which shows the foreign body reaction (FBR). The FBR for the LipoCEST capsules without cells was negligible (Fig. 6c, left). The number of infiltrating cells was highest in the +Cells/−IS (Fig. 6c, right) group followed by the +Cells/+IS group (Fig. 6c, middle), and then the −Cells group. Cell infiltration could be enhanced by the extensive apoptosis in the +Cells/−IS group (Fig. 6a). Small proinflammatory molecules can pass through the capsule in both +Cells groups, and the immunosuppression in the +Cells/+IS group reduces inflammation and cell infiltration. There were about 5 times more remaining cells found in capsules of the +Cells/+IS group as compared to the +Cells/−IS group. The histological findings underscore the BLI findings with significant differences in the number of viable encapsulated cells between the groups.
Taken together, these results indicate that LipoCEST capsules have potential as an indirect local marker for sensing cell viability, with the CEST contrast decreasing upon cell death over time. S.c. transplanted xenogeneic hepatocytes survived for two weeks but eventually died due to the incomplete immunoprotection of alginate and the presence of infiltrated cells creating hostile microenvironments, therefore immunosuppression was effective in prolonging cell survival. Immunosuppression has been used to sustain the survival of cell grafts in patients46, and transient immunosuppression has been investigated as an auxiliary component of encapsulated cell therapy to improve cell survival47. We demonstrate that LipoCEST nanosensors are sensitive enough to detect cell death caused by incomplete immunoprotection of hydrogels in cell therapies.
We can envisage two main limitations when using these CEST pH-nanosensors: 1) A complex interpretation of signal changes due to the endogenous processes occurring in vivo that could influence the CEST signals and 2) the speed of the CEST imaging protocol we have tested. Based on our experiments, we have concluded that cell death is a major source of the decrease in the CEST contrast. However, other processes could potentially contribute to the change in CEST contrast. For example, the CEST contrast might also reduce over an extended period of time as a result of biodegradation of the LipoCEST capsules. Second, for these initial studies we chose to image only one slice with our protocol, which might not represent the whole capsule region. With the ongoing improvements in pulse sequences and MRI hardware, we expect that multi-slice CEST imaging could be achieved in the near future which would provide more complete information on the entire capsule region.
A new nanosensor-based imaging platform has been developed for local sensing of pH changes in the microenvironment associated with cell death. The CEST MRI approach allows non-invasive, real-time imaging of transplanted cells without the limits of signal penetration depth encountered in optical (BL) imaging studies. Moreover, cell viability patterns can be evaluated within their anatomical context. These alginate encapsulated cells are currently being tested in clinical trials. We expect that this technology is translatable to the clinic based on the addition of biodegradable CEST liposomes and the common availability of MRI scanners.
Methods
Preparation of LipoCEST microcapsules
Liposomes containing L-arginine were prepared with an average size of ~200 nm, based on methods reported previously48 (Supplementary Methods). Clinical grade protamine sulfate (PS) (APP Pharmaceuticals, Schaumburg, Ill) and ultrapure low-viscosity high-guluronate alginate (PRONOVA UP LVG; NovaMatrix, Sandvika, Norway) and ultrapure low-viscosity high-mannuronate alginate (PRONOVA UP LVM; NovaMatrix) were used for microcapsule preparation. Human hepatocytes (HepG2) were obtained from ATCC and cultured in Modified Eagle's Medium containing 10% fetal bovine serum, 10,000 U/ml penicillin G and 10 mg/ml streptomycin. HepG2 cells were transduced for luciferase expression (Supplementary Methods).
Liposomal microcapsule synthesis was based on a one-step modification of the Lim-Sun method30,31. Our preparation used an electrostatic droplet generator, which produces smaller, stronger and more uniform capsules15,31. We suspended the HepG2 cells in LVG alginate. A mixture of cell alginate and L-arginine liposomes (50% vol/vol) was passed through a needle at 100 μL/min using a nanoinjector pump and electrostatic droplet generator. Alginate beads were collected, representing cells surrounded by one layer of alginate, in a Petri dish containing 20 mM BaCl2 in 10 mM 4-(2-hydroxyethyl)-1-piperazineethanesulfonic acid (HEPES). We washed the gelled beads with 10 mM HEPES buffered 0.9% w:v NaCl and suspended in 0.1% PLL or PS for 5 min to crosslink the alginate. We then washed and resuspended the beads in 0.15% LVM alginate for 5 min, and washed again. Similarly, six different formulations without hepatocytes were prepared for CEST contrast measurement. The permeability and mechanical strength of capsules was measured as described in the Supplementary Methods.
Characterization of LipoCEST microcapsules
The CEST contrast of the various capsules was measured in 5 mm phantoms. To study their pH sensitivity, contrast was measured in PBS titrated to pH=5.5, 6.0, 6.5, 7.0, and 7.5. An additional titration experiment was performed in which 10 μL aliquots of 1 M hydrochloric acid was added via a syringe. The CEST contrast of the same slice of capsules was measured after each addition of acid, and the corresponding changes in pH were measured in a separate tube using a pH meter and the same setup (Fig. 4d). To study the stability of the contrast over time, LipoCEST capsules were placed in saline at 37 °C, and saline was changed daily. The CEST contrast of the capsules was measured on days 1, 7, 14, 21 and 30. In vitro MR images were acquired at 310 K using a 9.4T Bruker Avance system equipped with a 20-mm birdcage RF coil. The main field (B0) was manually shimmed and two sets of saturation images were collected for CEST imaging: a Water Saturation Shift Reference (WASSR) set for B0 mapping49 and a modified Rapid Acquisition with Relaxation Enhancement (RARE) set including a magnetization transfer (MT) module for CEST images as described previously50 (Supplementary Methods). The CEST contrast was quantified by calculating the asymmetry in the magnetization transfer ratio (MTRasym). All data were processed using custom-written Matlab scripts (Supplementary Methods).
Imaging of in vitro cell viability
Cell death of encapsulated hepatocytes was induced through addition of 50 μM staurosporine (STS, Sigma-Aldrich, St. Louis), and images were collected on capsules with (apoptotic cells) and without the addition of STS (live cells) using the same setup as described above for the acid titration experiments (n=3). For the dead cell group (n=3), cells were treated with the same concentration of STS for 2 hrs prior to encapsulation. Capsules with a varying number of cells were prepared by adjusting the number of cells per ml of alginate, i.e., 1, 3, and 10 ×107 cells per ml of alginate, corresponding to approximately 0.5×10³, 1.5×10³, and 5.0×10³ cells per capsule. The number of dead cells in Supplementary Fig. S4b was calculated by the difference of the estimated number of viable cells before and after MRI using BLI radiance values (Supplementary Methods). CEST images were collected before and 12 hrs after addition of STS. After imaging, the viability of encapsulated cells was determined by staining with fluorescein diacetate (FDA, green), Annexin V (blue), and propridium iodide (PI, red). Apoptotic/dead cells were Annexin V positive and/or PI positive, and live cells were FDA positive. Differences among the three groups of mice were compared using two-way ANOVA and were considered statistically significant for a P-value <0.05.
Imaging of in vivo cell viability
All experimental procedures were performed in accordance with guidelines provided by our Institutional Animal Care and Use Committee. Male Balb/C mice (8 wks, 23–25 g) were anesthetized with ketamine (100 mg/kg) and xylazine (10 mg/kg). LipoCEST capsules with and without Luc-transduced hepatocytes were transplanted s.c. into three groups of mice: −Cells (n=4), +Cells/+IS (n=8), +Cells/−IS (n=8) and +DeadCells/+IS (n=3). Mice in the +Cells/+IS group were injected intraperitoneally (i.p.) with FK-506 and rapamycin (1 mg/kg each, LC Laboratories) daily, starting 3 days before transplantation. In vivo MR images were acquired on day 0, 1, 7, 14 and 28 after transplantation, using a 9.4T Bruker scanner equipped with a 25 mm saw tooth resonator and similar imaging parameters with the addition of a fat suppression pulse (3.4 ms hermite pulse, offset=−4 ppm). The acquisition parameters for in vivo study: TR=5.0 sec, RARE factor=8, tsat=3 sec, B1=3.6 μT (150 Hz), slice thickness=1mm, acquisition matrix size=96×48, FOV=23×18 mm, NA=2. WASSR offset range =± 2 ppm (0.1 ppm steps) and z-spectra offset range = ± 4 ppm (0.2 ppm steps). All data were processed using custom-written Matlab scripts (Supplementary Methods). The MTRasym of the +Cells/−IS group was compared with that of the −Cells group and +Cells/+IS group using a Kruskal-Wallis test (Fig. 6b) at each time point and considered statistically significant for P<0.05. BLI was performed for all mice on days 0, 1, 7, 14 and 28 after transplantation using an IVIS 200 optical imaging system (Caliper Life Sciences, USA). Mice were injected i.p. with 150 mg/kg of luciferin (Caliper Life Sciences, Hopkinton, MA) and imaged 15 min after injection. BL images were processed using Xenogen Living Imaging software, and all the region of interests used for radiance (photons/sec/cm2/sr) measurements had the same area to allow comparison. The radiance in the +Cells/+IS group was compared with that of the +Cells/−IS group using a Mann-Whitney test (Fig. 6e) at each time point and considered significant when P-values were 0.05 or less. Mice were euthanized for histological studies immediately after imaging on day 14 post-transplantation (Supplementary Methods). CEST contrast is logarithmically related to pH for base-catalyzed exchange, as such we plotted the CEST contrast for the +Cells/+IS and +Cells/−IS group against the log of the BLI signal (Supplementary Fig. S6). A two-factor repeated measures ANOVA was performed on both the CEST and BLI data, with group and time factors and group×time interaction for the mice in −Cells, +Cells/+IS and +Cells/−IS groups, and considered statistically significant for P<0.05 (Supplementary Fig. S10).
Supplementary Material
Acknowledgements
The authors sincerely thank Segun Bernard and Sashi C. Galpoththawela for technical assistance, Anthony Kim for helping with the image processing of the permeability study, and Drs. Carol Thompson and Peter Murakami for assistance in the statistical analysis. The study was supported by NIH R01 EB012590, EB015031, EB015032 and EB007825.
Footnotes
Author contributions K.W.C., M.T.M., and J.W.B. were responsible for the study concepts, design of experiments and analysis and interpretation of data. K.W.C., D.R.A. and T.Y. were involved in the capsule preparation and characterization. K.W.C., G.L., X.S. and H.K. carried out the in vivo experiments and MRI studies. K.W.C. and G.L. processed the MRI data. A.A.G. designed the cell transduction. J.H. directed the permeability study which was performed on instruments in his laboratory. P.W. directed the histological and immunosuppression studies. P.C.M.V.Z. directed the CEST imaging protocols. K.W.C. and M.T.M drafted the manuscript, and all authors commented on and edited the manuscript.
The authors declare no competing financial interest. Supplementary information accompanies this paper on www.nature.com/naturematerials. Reprints and permission information is available online at http://npg.nature.com/reprintsandpermissions.
References
- 1.Murua A, et al. Cell microencapsulation technology: towards clinical application. J. Controlled Release. 2008;132:76–83. doi: 10.1016/j.jconrel.2008.08.010. [DOI] [PubMed] [Google Scholar]
- 2.Orive G, et al. Cell encapsulation: promise and progress. Nat. Med. 2003;9:104–107. doi: 10.1038/nm0103-104. [DOI] [PubMed] [Google Scholar]
- 3.Lanza RP, Hayes JL, Chick WL. Encapsulated cell technology. Nat. Biotechnol. 1996;14:1107–1111. doi: 10.1038/nbt0996-1107. [DOI] [PubMed] [Google Scholar]
- 4.Chang TM. Therapeutic applications of polymeric artificial cells. Nature reviews. Drug discovery. 2005;4:221–235. doi: 10.1038/nrd1659. [DOI] [PubMed] [Google Scholar]
- 5.Elliott RB, et al. Live encapsulated porcine islets from a type 1 diabetic patient 9.5 yr after xenotransplantation. Xenotransplantation. 2007;14:157–161. doi: 10.1111/j.1399-3089.2007.00384.x. [DOI] [PubMed] [Google Scholar]
- 6.Soon-Shiong P, et al. Insulin independence in a type 1 diabetic patient after encapsulated islet transplantation. Lancet. 1994;343:950–951. doi: 10.1016/s0140-6736(94)90067-1. [DOI] [PubMed] [Google Scholar]
- 7.Lohr M, et al. Microencapsulated cell-mediated treatment of inoperable pancreatic carcinoma. Lancet. 2001;357:1591–1592. doi: 10.1016/s0140-6736(00)04749-8. [DOI] [PubMed] [Google Scholar]
- 8.Bloch J, et al. Neuroprotective gene therapy for Huntington's disease, using polymer-encapsulated cells engineered to secrete human ciliary neurotrophic factor: results of a phase I study. Hum. Gene Ther. 2004;15:968–975. doi: 10.1089/hum.2004.15.968. [DOI] [PubMed] [Google Scholar]
- 9.Fisher B, et al. Tumor localization of adoptively transferred indium-111 labeled tumor infiltrating lymphocytes in patients with metastatic melanoma. J. Clin. Oncol. 1989;7:250–261. doi: 10.1200/JCO.1989.7.2.250. [DOI] [PubMed] [Google Scholar]
- 10.Bulte JW. In vivo MRI cell tracking: clinical studies. AJR. Am. J. Roentgenol. 2009;193:314–325. doi: 10.2214/AJR.09.3107. [DOI] [PMC free article] [PubMed] [Google Scholar]
- 11.Contag PR, Olomu IN, Stevenson DK, Contag CH. Bioluminescent indicators in living mammals. Nat. Med. 1998;4:245–247. doi: 10.1038/nm0298-245. [DOI] [PubMed] [Google Scholar]
- 12.Yaghoubi SS, et al. Noninvasive detection of therapeutic cytolytic T cells with 18F-FHBG PET in a patient with glioma. Nature clinical practice. Oncology. 2009;6:53–58. doi: 10.1038/ncponc1278. [DOI] [PMC free article] [PubMed] [Google Scholar]
- 13.Hughes RD, Mitry RR, Dhawan A. Current Status of Hepatocyte Transplantation. Transplantation. 2011 doi: 10.1097/TP.0b013e31823b72d6. [DOI] [PubMed] [Google Scholar]
- 14.Mai G, et al. Treatment of fulminant liver failure by transplantation of microencapsulated primary or immortalized xenogeneic hepatocytes. Transplant. Proc. 2005;37:527–529. doi: 10.1016/j.transproceed.2005.01.017. [DOI] [PubMed] [Google Scholar]
- 15.Barnett BP, et al. Radiopaque alginate microcapsules for X-ray visualization and immunoprotection of cellular therapeutics. Mol. Pharm. 2006;3:531–538. doi: 10.1021/mp060056l. [DOI] [PubMed] [Google Scholar]
- 16.Barnett BP, et al. Fluorocapsules for improved function, immunoprotection, and visualization of cellular therapeutics with MR, US, and CT imaging. Radiology. 2011;258:182–191. doi: 10.1148/radiol.10092339. [DOI] [PMC free article] [PubMed] [Google Scholar]
- 17.Arifin DR, et al. Trimodal gadolinium-gold microcapsules containing pancreatic islet cells restore normoglycemia in diabetic mice and can be tracked by using US, CT, and positive-contrast MR imaging. Radiology. 2011;260:790–798. doi: 10.1148/radiol.11101608. [DOI] [PMC free article] [PubMed] [Google Scholar]
- 18.Kim J, et al. Multifunctional capsule-in-capsules for immunoprotection and trimodal imaging. Angewandte Chemie. 2011;50:2317–2321. doi: 10.1002/anie.201007494. [DOI] [PMC free article] [PubMed] [Google Scholar]
- 19.Barnett BP, et al. Magnetic resonance-guided, real-time targeted delivery and imaging of magnetocapsules immunoprotecting pancreatic islet cells. Nat. Med. 2007;13:986–991. doi: 10.1038/nm1581. [DOI] [PubMed] [Google Scholar]
- 20.Ward KM, Aletras AH, Balaban RS. A new class of contrast agents for MRI based on proton chemical exchange dependent saturation transfer (CEST) J. Magn. Reson. 2000;143:79–87. doi: 10.1006/jmre.1999.1956. [DOI] [PubMed] [Google Scholar]
- 21.van Zijl PC, Yadav NN. Chemical exchange saturation transfer (CEST): what is in a name and what isn't? Magn. Reson. Med. 2011;65:927–948. doi: 10.1002/mrm.22761. [DOI] [PMC free article] [PubMed] [Google Scholar]
- 22.Sherry AD, Woods M. Chemical exchange saturation transfer contrast agents for magnetic resonance imaging. Annu. Rev. Biomed. Eng. 2008;10:391–411. doi: 10.1146/annurev.bioeng.9.060906.151929. [DOI] [PMC free article] [PubMed] [Google Scholar]
- 23.Terreno E, Castelli DD, Aime S. Encoding the frequency dependence in MRI contrast media: the emerging class of CEST agents. Contrast media & molecular imaging. 2010;5:78–98. doi: 10.1002/cmmi.369. [DOI] [PubMed] [Google Scholar]
- 24.Zhou J, Payen JF, Wilson DA, Traystman RJ, van Zijl PC. Using the amide proton signals of intracellular proteins and peptides to detect pH effects in MRI. Nat. Med. 2003;9:1085–1090. doi: 10.1038/nm907. [DOI] [PubMed] [Google Scholar]
- 25.Coakley RJ, Taggart C, McElvaney NG, O'Neill SJ. Cytosolic pH and the inflammatory microenvironment modulate cell death in human neutrophils after phagocytosis. Blood. 2002;100:3383–3391. doi: 10.1182/blood.V100.9.3383. [DOI] [PubMed] [Google Scholar]
- 26.De Leon-Rodriguez LM, et al. Responsive MRI agents for sensing metabolism in vivo. Acc Chem Res. 2009;42:948–957. doi: 10.1021/ar800237f. [DOI] [PMC free article] [PubMed] [Google Scholar]
- 27.Shrode LD, Tapper H, Grinstein S. Role of intracellular pH in proliferation, transformation, and apoptosis. J. Bioenerg. Biomembr. 1997;29:393–399. doi: 10.1023/a:1022407116339. [DOI] [PubMed] [Google Scholar]
- 28.McMahon MT, et al. New “multicolor” polypeptide diamagnetic chemical exchange saturation transfer (DIACEST) contrast agents for MRI. Magn. Reson. Med. 2008;60:803–812. doi: 10.1002/mrm.21683. [DOI] [PMC free article] [PubMed] [Google Scholar]
- 29.Liu G, et al. In vivo multicolor molecular MR imaging using diamagnetic chemical exchange saturation transfer liposomes. Magn. Reson. Med. 2011;N/A:N/A. doi: 10.1002/mrm.23100. [DOI] [PMC free article] [PubMed] [Google Scholar]
- 30.Lim F, Sun AM. Microencapsulated islets as bioartificial endocrine pancreas. Science. 1980;210:908–910. doi: 10.1126/science.6776628. [DOI] [PubMed] [Google Scholar]
- 31.Barnett BP, et al. Synthesis of magnetic resonance-, X-ray- and ultrasound-visible alginate microcapsules for immunoisolation and noninvasive imaging of cellular therapeutics. Nature protocols. 2011;6:1142–1151. doi: 10.1038/nprot.2011.352. [DOI] [PMC free article] [PubMed] [Google Scholar]
- 32.Tuch BE, et al. Safety and viability of microencapsulated human islets transplanted into diabetic humans. Diabetes Care. 2009;32:1887–1889. doi: 10.2337/dc09-0744. [DOI] [PMC free article] [PubMed] [Google Scholar]
- 33.Takagi I, Shimizu H, Yotsuyanagi T. Application of alginate gel as a vehicle for liposomes. I. Factors affecting the loading of drug-containing liposomes and drug release. Chem. Pharm. Bull. (Tokyo) 1996;44:1941–1947. doi: 10.1248/cpb.44.1941. [DOI] [PubMed] [Google Scholar]
- 34.Gardner CM, Burke NA, Stover HD. Cross-linked microcapsules formed from self-deactivating reactive polyelectrolytes. Langmuir. 2010;26:4916–4924. doi: 10.1021/la903540c. [DOI] [PubMed] [Google Scholar]
- 35.Darrabie MD, Kendall WF, Jr, Opara EC. Characteristics of Poly-L-Ornithine-coated alginate microcapsules. Biomaterials. 2005;26:6846–6852. doi: 10.1016/j.biomaterials.2005.05.009. [DOI] [PubMed] [Google Scholar]
- 36.Dupraz P, et al. Lentivirus-mediated Bcl-2 expression in betaTC-tet cells improves resistance to hypoxia and cytokine-induced apoptosis while preserving in vitro and in vivo control of insulin secretion. Gene Ther. 1999;6:1160–1169. doi: 10.1038/sj.gt.3300922. [DOI] [PubMed] [Google Scholar]
- 37.Dufrane D, et al. The influence of implantation site on the biocompatibility and survival of alginate encapsulated pig islets in rats. Biomaterials. 2006;27:3201–3208. doi: 10.1016/j.biomaterials.2006.01.028. [DOI] [PubMed] [Google Scholar]
- 38.Medarova Z, Evgenov NV, Dai G, Bonner-Weir S, Moore A. In vivo multimodal imaging of transplanted pancreatic islets. Nature protocols. 2006;1:429–435. doi: 10.1038/nprot.2006.63. [DOI] [PubMed] [Google Scholar]
- 39.Lacy PE, Hegre OD, Gerasimidi-Vazeou A, Gentile FT, Dionne KE. Maintenance of normoglycemia in diabetic mice by subcutaneous xenografts of encapsulated islets. Science. 1991;254:1782–1784. doi: 10.1126/science.1763328. [DOI] [PubMed] [Google Scholar]
- 40.Dufrane D, Goebbels RM, Gianello P. Alginate Macroencapsulation of Pig Islets Allows Correction of Streptozotocin-Induced Diabetes in Primates up to 6 Months Without Immunosuppression. Transplantation. 2010 doi: 10.1097/TP.0b013e3181f6e267. [DOI] [PubMed] [Google Scholar]
- 41.Scharp DW, et al. Protection of encapsulated human islets implanted without immunosuppression in patients with type I or type II diabetes and in nondiabetic control subjects. Diabetes. 1994;43:1167–1170. doi: 10.2337/diab.43.9.1167. [DOI] [PubMed] [Google Scholar]
- 42.Waerzeggers Y, et al. Multimodal imaging of neural progenitor cell fate in rodents. Molecular imaging. 2008;7:77–91. [PubMed] [Google Scholar]
- 43.Tarantal AF, Lee CC, Itkin-Ansari P. Real-time bioluminescence imaging of macroencapsulated fibroblasts reveals allograft protection in rhesus monkeys (Macaca mulatta) Transplantation. 2009;88:38–41. doi: 10.1097/TP.0b013e3181a9ee6c. [DOI] [PMC free article] [PubMed] [Google Scholar]
- 44.Sortwell CE, Camargo MD, Pitzer MR, Gyawali S, Collier TJ. Diminished survival of mesencephalic dopamine neurons grafted into aged hosts occurs during the immediate postgrafting interval. Exp. Neurol. 2001;169:23–29. doi: 10.1006/exnr.2001.7644. [DOI] [PubMed] [Google Scholar]
- 45.Kulseng B, Thu B, Espevik T, Skjak-Braek G. Alginate polylysine microcapsules as immune barrier: permeability of cytokines and immunoglobulins over the capsule membrane. Cell Transplant. 1997;6:387–394. doi: 10.1177/096368979700600405. [DOI] [PubMed] [Google Scholar]
- 46.Keymeulen B, et al. Correlation between beta cell mass and glycemic control in type 1 diabetic recipients of islet cell graft. Proc. Natl. Acad. Sci. U. S. A. 2006;103:17444–17449. doi: 10.1073/pnas.0608141103. [DOI] [PMC free article] [PubMed] [Google Scholar]
- 47.Murua A, Orive G, Hernandez RM, Pedraz JL. Xenogeneic transplantation of erythropoietin-secreting cells immobilized in microcapsules using transient immunosuppression. J. Controlled Release. 2009;137:174–178. doi: 10.1016/j.jconrel.2009.04.009. [DOI] [PubMed] [Google Scholar]
- 48.Zhao JM, et al. Size-induced enhancement of chemical exchange saturation transfer (CEST) contrast in liposomes. J. Am. Chem. Soc. 2008;130:5178–5184. doi: 10.1021/ja710159q. [DOI] [PMC free article] [PubMed] [Google Scholar]
- 49.Kim M, Gillen J, Landman BA, Zhou J, van Zijl PC. Water saturation shift referencing (WASSR) for chemical exchange saturation transfer (CEST) experiments. Magn. Reson. Med. 2009;61:1441–1450. doi: 10.1002/mrm.21873. [DOI] [PMC free article] [PubMed] [Google Scholar]
- 50.Liu G, Gilad AA, Bulte JW, van Zijl PC, McMahon MT. High-throughput screening of chemical exchange saturation transfer MR contrast agents. Contrast media & molecular imaging. 2010;5:162–170. doi: 10.1002/cmmi.383. [DOI] [PMC free article] [PubMed] [Google Scholar]
Associated Data
This section collects any data citations, data availability statements, or supplementary materials included in this article.