Abstract
Purpose
To demonstrate the feasibility of measuring the temporal dynamics of cerebral lactate concentration and examine these dynamics in human subjects using MRS during hypoxia.
Methods
A respiratory protocol consisting of 10 min baseline normoxia, 20 min inspiratory hypoxia and ending with 10 min normoxic recovery was used, throughout which lactate-edited MRS was performed. This was repeated four times in three subjects. A separate session was performed to measure blood lactate. Impulse response functions using end-tidal oxygen and blood lactate as system inputs and cerebral lactate as the system output were examined to describe the dynamics of the cerebral lactate response to a hypoxic challenge.
Results
The average lactate increase was 20%±15% during the last half of the hypoxic challenge. Significant changes in cerebral lactate concentration were observed after 400s. The average relative increase in blood lactate was 188%±95%. The temporal dynamics of cerebral lactate concentration was reproducibly demonstrated with 200s time bins of MRS data (coefficient of variation 0.063±0.035 between time bins in normoxia). The across subject coefficient of variation was 0.333.
Conclusions
The methods for measuring the dynamics of the cerebral lactate response developed here would be useful to further investigate the brain’s response to hypoxia.
Keywords: lactate, cerebral lactate, magnetic resonance spectroscopy, hypoxia, neuroimaging, impulse response function
Introduction
Lactate has a key role in brain energy metabolism. Lactate is produced and used by cells throughout the body, including healthy brain cells and the understanding of the role lactate for example as a fuel source and a signalling molecule has increased substantially in recent years (1). When blood lactate is elevated, the uptake of lactate into the brain increases and there appears to be a rise in the cerebral metabolism of lactate (2, 3). Studies have used systemic lactate injections (2, 4) or exercise (3, 4) to increase lactate circulating in the blood. Often, cerebral lactate uptake is calculated as the difference between arterial and venous lactate (4) so the metabolic path of cerebral lactate is not directly revealed. However, in a 13C labelling study, lactate from the blood plasma was incorporated into glutamate and glutamine as would be expected by catalysis and label scrambling in the Kreb’s cycle indicating that the lactate is metabolised (3). Similar results have been confirmed in animal models (1, 5).
The dynamics of cerebral lactate concentration changes during inspiratory hypoxia have not yet been described in humans. Inspiratory hypoxia is a potentially useful model for examining the brain’s metabolic response to reduced arterial oxygen concentration. In a previous study, it was shown that average cerebral lactate increases during a 15 min inspiratory hypoxic challenge were detectable using edited MRS at 3T (6). This previous study compared lactate concentration during separate MRS acquisitions, i.e., one acquisition was performed at rest and a second acquisition was performed after 5 min of hypoxia. However, an ability to examine the temporal dynamics of cerebral lactate concentration with the onset and offset of hypoxia should yield richer information and promote further experimentation aimed at quantifying uptake and metabolism in the human brain. To this end, we aim to develop a reliable method to dynamically quantify lactate during baseline normoxia, hypoxia and return to normoxia. We use blood-lactate measurements to investigate systemic compared to cerebral lactate levels. Additionally, we model the lactate response with impulse response functions to relate them to end-tidal oxygen and blood lactate to gain further insight into the temporal profile of lactate changes observed.
Materials and Methods
All protocols were approved by the local institutional ethics committee and the subjects gave informed consent prior to the studies. All subjects were healthy, non-smokers, with no history of neurological, respiratory, cardiac or vascular disease. Prior to experimental sessions, subjects were familiarised with the respiratory circuit and breathing a hypoxic gas mixture through a facemask. Three subjects (2 males, aged 26 and 37, 1 female aged 30) each underwent 4 MRS scanning sessions. Each subject participated in an additional session without MR scanning on a separate day with the same hypoxic protocol for the measurement of blood lactate.
Respiratory protocol
The protocol consisted of 10 min normoxia (baseline), followed by 20 min inspiratory hypoxia and ended with 10 min normoxia (recovery). Dynamic end-tidal forcing was used (7, 8) to control delivered gas concentrations. The partial pressure of end-tidal CO2 (PetCO2) was kept at the subject’s resting level throughout the protocol, while the partial pressure of end-tidal O2 (PetO2) was held at the resting level for normoxic periods and during hypoxia was reduced by 60 mmHg from resting values to a minimum of 50 mmHg PetO2. Resting values were determined after the subject had acclimatized to the experimental set-up but prior to the beginning of the MRS protocol. Dynamic end-tidal forcing was performed using custom software (BreatheDP, Oxford University, UK, written in LabView, National Instruments, Newbury, Berkshire, UK) that compares the measured end-tidal gases to the desired values and then controls the gas delivery to the subjects on a breath-by-breath basis to achieve and maintain the desired end-tidal partial pressure of each gas (7, 8).
Blood Sampling
In a session separate to the MR acquisitions, the same hypoxic protocol was run for each subject and blood samples were acquired from the earlobe, representing mixed arterialised-capillary blood, to examine blood lactate. The blood samples were analysed for lactate concentration using a metabolite analyzer (Analox, London, UK) at multiple times (between 19 and 23 times) during the 40 min protocol. To compensate for the variability in blood sampling times, blood lactate data were linearly interpolated to the same time-points for all subjects to allow for the calculation of average blood lactate and the impulse response function.
MRS acquisitions
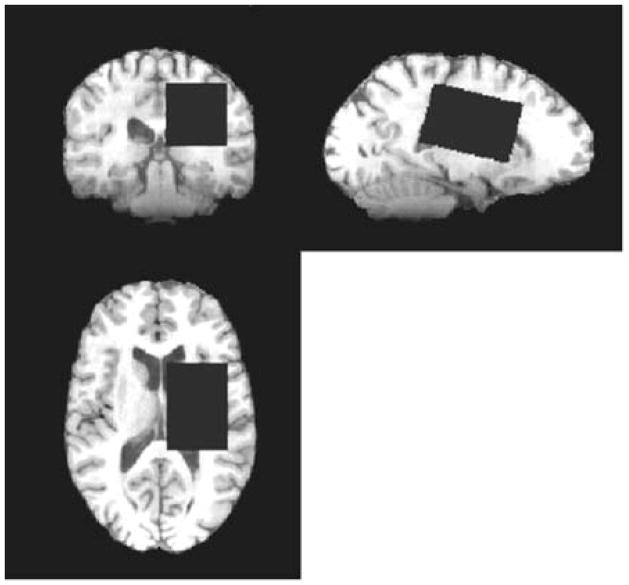
MRS was performed at 3T (HDx MRI system, General Electric, Waukeshwa, USA) using an 8-channel phased-array receive-only head coil. As described previously (6), a 4×4×6 cm3 voxel (Figure 1) was placed in the left hemisphere minimizing the volume of and cerebrospinal fluid (CSF). A MEGA-PRESS (9) acquisition was used to edit lactate signal from stronger signals in the MR spectrum by applying frequency-selective editing pulses at δ=4.1 ppm to manipulate the evolution of coupling to the methyl-spins at δ=1.33 ppm. Subtraction of scans without editing and with editing increases the spectral sensitivity to detect lactate in the presence of underlying macromolecular signals. Additional scanning parameters were: TR/TE=2000 ms/140 ms, spectral width=5 kHz, 40 min acquisition with 1200 transients. A T1-weighted fast spoiled gradient echo whole brain image (1 mm isotropic resolution) was acquired to determine the tissue segmentation of the voxel using FAST (FSL, FMRIB, http://www.fmrib.ox.ac.uk/fsl/).
Figure 1.
Example of voxel placement for an MRS acquisition
Data analysis
The 40min acquisition was separated into 12 time periods (each 200 s in length) to analyse the temporal dynamics of changes in lactate concentration. Lactate quantification was based on previous methods (6), with modification for dynamic quantification as follows. First, a lactate model was based on a Gaussian doublet fit to the difference of the temporally resolved lactate spectra during baseline normoxia (0–600 s) and hypoxia (800–1800 s, the time between 600 s and 800 s was considered transitional). Secondly, the macromolecular model was developed using the mean spectrum of all temporal data and the lactate doublet in combination with Gaussian peaks at 1.24 ppm and 1.43 ppm to account for co-edited macromolecules in the region of the lactate peak (10). Thirdly, it was assumed that the macromolecular content does not change over the course of an experiment and the macromolecular model was fitted to (scaled for) the baseline normoxic period for each session. Then a linear combination of the lactate and the macromolecular models was then used to quantify lactate in each time period for each subject. The unsuppressed water signal was modelled with a Gaussian-Lorentzian lineshape as the reference standard for quantification. The integral ratio of the fitted lactate signal to the fitted water signal was used to quantify lactate in institutional units (i.u.). Separate from the lactate analysis, the NAA peak was modelled with a Lorentzian and the linewidth analysed for any potential T2* effects.
Impulse Response Function Estimation
Calculation of the impulse response function is a method to fully quantify system dynamics, specifically, the way that previous inputs affect the present output, similar to the calculation of a transfer function or transporter kinetic modelling, but without the need to converting data to frequency space or constrain the type of system dynamics to compartmental or parametric models. The impulse response functions of cerebral lactate (output) to PetO2 and blood lactate (inputs) were calculated using the Laguerre function expansion technique, which is a system identification method that reduces the number of free parameters. The application of this approach to model dynamic biological systems has previously been described (11) and applied to human physiology (c.f., ref(12)). Briefly, the output of a linear system is given in terms of its input by the convolution sum: , where x(n) and y(n) are the system input and output, respectively for discrete time n, h(m) is the system impulse response and M is the system memory, or the length of time an impulse has an effect. The impulse response describes the system dynamics and may be expressed in terms of a set of discrete-time Laguerre functions (11); where cj are the expansion coefficients and bj(m) is the jth-order Laguerre function. The matrix combination of the above two equations results in: y=Vc+ε where V is a matrix that contains the convolution of the input signal with the Laguerre functions, c is the vector of the expansion coefficients and ε is the error vector. Here, average PetO2 or blood lactate was the input data and cerebral lactate was the output data. The expansion coefficients were obtained by least-squares estimation using the experimental measurements, and the impulse response was obtained from the above equation.
Statistics
Overall changes in lactate based on 10 min time blocks of averaged data: baseline normoxia, first 10 min hypoxia (“hypoxic transition”), last 10 min hypoxia (“hypoxic hypoxia”) and normoxic recovery, were compared using ANOVA with Bonferroni corrections for multiple comparisons. The temporal dynamics of lactate were examined using a general linear model with subjects, replication and repetition as factors to compare each hypoxic and normoxic post-hypoxia time point with the average baseline normoxic period. The chosen significance threshold was p<0.05 throughout. Data are presented as mean ± standard deviation.
Results
The average cerebral lactate during baseline normoxia for each of the 3 subjects was 0.87±0.06 i.u., 1.16±0.55 i.u. and 0.95±0.16 i.u., showing an overall average of 0.99±0.33 i.u.. The average lactate concentrations during subsequent time blocks were: 1.08±0.16 i.u. during hypoxic transition (experiment time 600s –1200s), 1.17±0.27 i.u during hypoxic hypoxia (experiment time 1200s – 1800s), and normoxic recovery 1.08±0.14 i.u. (experiment time 1800s – 2400s). Mean lactate concentration was significantly increased during the hypoxic (p<0.001) and recovery periods (p=0.001) compared to the baseline condition, as shown by the ANOVA (based on mean values within each time period), but there was not a significant difference between hypoxia and the normoxic recovery.
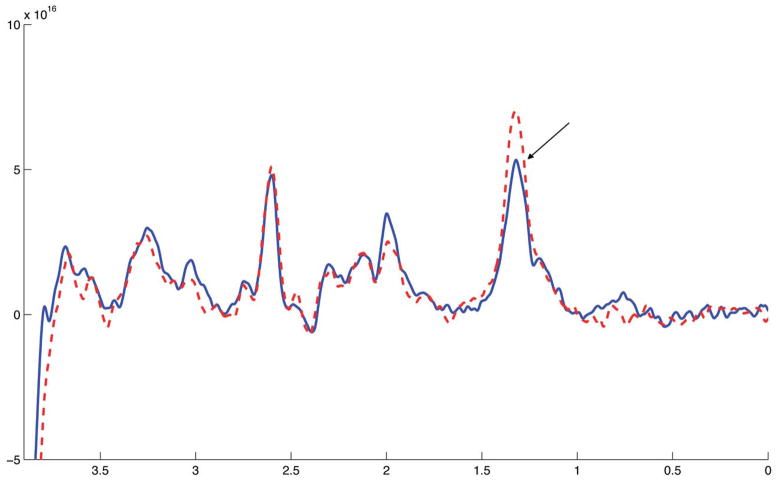
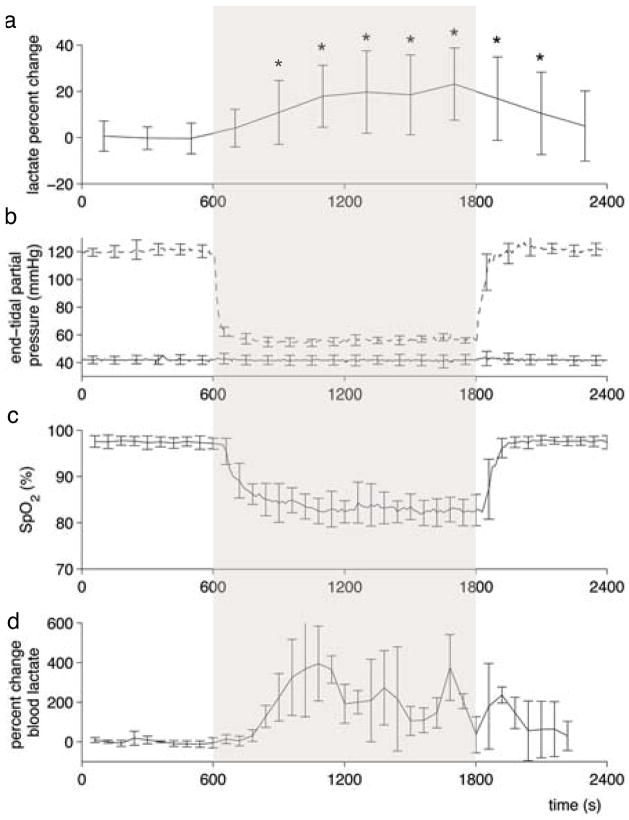
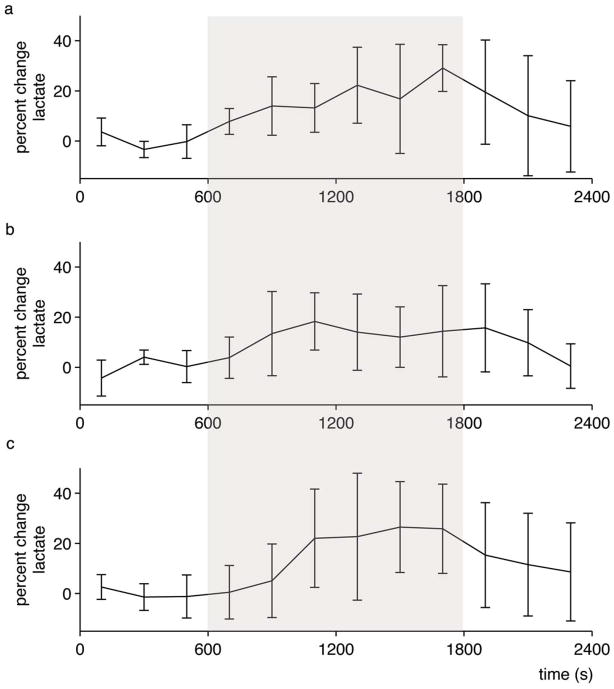
Time-resolved lactate data were acquired with sufficient signal-to-noise such that a spectrum lactate model could be formed on an individual basis and then used to quantify lactate in each 200 s time bin (example spectra shown in Figure 2). Figure 3a shows the time course of cerebral lactate evolution averaged over all subjects and each subject averaged over the 4 sessions (Figure 4a–c), all relative to the baseline normoxic lactate. The majority of the lactate changes occurred in the first 600 s of hypoxia. The median time of the maximum cerebral lactate change was at 800 s after the onset of hypoxia (range 600 s to 1400 s after start of the hypoxic challenge). The general linear model analysis indicated that the lactate concentration compared to the baseline normoxia period only became significantly different at 400 s after the onset of hypoxia. For 400 s after the return to normoxia, lactate remained significantly different from baseline. End-tidal forcing maintained target PetO2 and PetCO2 values effectively. During the hypoxic period, end-tidal CO2 was well controlled to the target baseline level (Figure 3b). As expected, the blood oxygen saturation fell during inspiratory hypoxia and rapidly recovered upon the return to normoxia (Figure 3c). The blood lactate increased by a greater percentage than the cerebral lactate (Figure 3d). During hypoxic hypoxia, cerebral lactate (across subjects) increased on average by 20%±15% as compared to a 188%±95% blood lactate increase. Across all 3 subjects, the baseline blood lactate concentration was measured as 0.55±0.23 mmol/L, which increased during hypoxia to an average of 1.55±0.90 mmol/L.
Figure 2.
Two edited-spectra obtained during one session in one volunteer, with the location of the lactate peak indicated (1.33 ppm). No apodization has been applied but the spectra have been realigned at the NAA peak to account for scanner drift. The different line styles indicate different phases of the protocol, the solid line was acquired from the baseline normoxia phase and the dashed line was acquired during hypoxia. Each spectrum arises from 200 s worth of data and consists of 100 transients.
Figure 3.
Average time-resolved physiological measurements. Lactate concentration change during the hypoxic challenge relative to the baseline mean, is averaged across all subjects in (a) where * indicates lactate concentration is significantly different from baseline according to the general linear model analysis. Plots of end-tidal CO2 (solid line) and O2 (dashed line) in (b) and oxygen saturation (c) averaged across all experiments. In a separate session, blood lactate was measured to assess systemic lactate during hypoxia (d).
Figure 4.
Time-resolved lactate concentration changes for each individual. Average lactate concentration across the four sessions for each subject. Error bars are standard deviation across the four sessions, shaded area indicates hypoxia.
For the cerebral lactate measurements, the mean within-session coefficient of variation (ratio of the within session-standard deviation across 200s time bins to the within-session mean of the quantified lactate) was 0.063±0.035 calculated from the baseline normoxic period. The average across-session, within subject coefficient of variation was 0.21±0.15 and the across-subject coefficient of variation of the baseline normoxia cerebral lactate measurements was 0.33. During hypoxic hypoxia, the within-session coefficient of variation was 0.065±0.040, the cross-session within subject coefficient of variation was 0.17±0.11 and the across-subject coefficient of variation was 0.24. The MRS voxel mostly consisted of white matter (65%±3%) with the remaining proportions being grey matter 26%±3% and CSF, 8.3%±2.4%. Once the linewidth of the NAA spectrum was detrended to account for scanner drift, no differences in linewidth were observed over time.
The impulse response functions characterised the relationship between blood lactate and cerebral lactate and between PetO2 and cerebral lactate (Figure 5). The impulse response characterises the memory of the system, such that the past input values that affect the present output are reflected. The Pet O2-cerebral lactate impulse response function has a negative, biphasic relationship with cerebral lactate with the maximum instantaneous effect at 165 s while the blood-cerebral lactate impulse response function was positive and monophasic.
Figure 5.
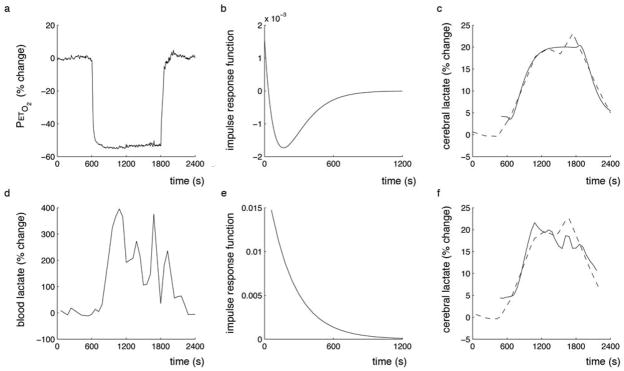
Hypoxia impulse response function for cerebral lactate. (a) End-tidal O2 was used as the system input and the impulse response function (b) was calculated. The impulse response is used to predict the lactate response (c, solid line) modelled from the experimental data (c, dashed line). Similarly, (d) blood lactate was used as the system input and the impulse response function (e) calculated. The blood lactate response function is also used to predict the cerebral lactate response (f, solid line) modelled from the experimental data (f, dashed line). The slight differences in appearance of the experimental lactate data is a result of different levels of interpolation required to generate the impulse response function as PetO2 and blood lactate sampling rates were different.
Discussion
We have demonstrated the successful measurement of dynamic changes in cerebral lactate concentration in response to an acute inspiratory hypoxic challenge using edited MRS at 3T (Figures 2, 3a and 4). The detection of lactate is challenging due to its low concentration and limited chemical shift resolution of the 1H spectrum. The increase in lactate sensitivity gained from higher field strength (3T), edited MRS and the lactate-specific analysis as applied here and previously (6) represents a development from other studies (13) that have not detected changes in lactate during a hypoxic challenge.
During hypoxic hypoxia, the average cerebral lactate was 1.17±0.27 i.u., the variability of which is comparable to the baseline normoxic measurements (0.99±0.33 i.u.). It is not clear whether subjects had reached an equilibrium plateau condition by the end of the 1200 s hypoxic period as a longer protocol may have shown lactate concentrations continuing to increase. In individual trials, the peak lactate concentration appears as early as 600 s after the beginning of hypoxia and as late as 1400 s, i.e., after the subject returned to breathing normal air. The within-session variability is small (coefficient of variation between 200 s time bins during normoxia and hypoxic hypoxia 0.063±0.035 and 0.065±0.040, respectively). Sources of experimental variability (i.e., head motion) as well as variability in the production and clearance of lactate are likely to contribute to the overall variability of lactate concentration estimates. The linewidth of the NAA peak did not change during the hypoxia protocol, suggesting that T2* effects which may be expected during hypoxia did not cause a bias in the estimation of the lactate concentration. Therefore, we assume that all the observed changes in lactate are true changes in lactate and not a result of T2* effects due to increased deoxyhemoglobin.
Normal arterial blood lactate levels are 0.5–1.0 mmol/L (1, 3, 14), consistent with our measurements during baseline normoxia. Blood lactate would need to increase by ~4mmol/L for the ~20% lactate increase observed in the MRS voxel to be entirely as a result of increased lactate in the blood compartment (i.e., no cerebral uptake or production). However, we observed only an approximate 1 mmol/L increase in blood lactate suggesting an increase of lactate concentration also occurred in the brain tissue compartment.
Lactate is taken up by cerebral tissue from the blood through passive monocarboxylate transporters (1, 3, 15). Assuming that the monocarboxylate transporters are not saturated, a new equilibrium may be reached between lactate transport into the brain from blood and cerebral lactate metabolism in brain parenchyma or the transporters may be upregulated (16), although it is not clear if the level of hypoxia employed in the present study would cause such upregulation. Lactate has been shown not to accumulate in CSF and has been showen to be metabolised (17), leading to the conclusion that an increased concentration in blood lactate is associated with an increase in lactate oxidation in the brain (3, 4). Passive lactate transport into brain tissue and lactate not accumulating in CSF is consistent with brain uptake of lactate (1, 2) and its use as an energy source in normoxic conditions. The present study is consistent with this also occurring during mild-moderate inspiratory hypoxia but from our data alone, the metabolic fate of lactate cannot be explicitly concluded.
Local lactate concentration and the ratio of lactate/pyruvate are both correlated with CBF (18). During mild to moderate inspiratory hypoxia, cerebral blood flow increases to compensate for the reduced blood oxygenation, maintaining cerebral oxygen delivery and metabolic function (19). There has been some evidence of regional differences in the CBF response to hypoxia (20–22) which may indicate there are also different lactate responses regionally. Similarly, grey matter is considered more metabolically active and has greater CBF compared to white matter (19). As such, the lactate increases may not be uniform across the voxel.
Impulse response functions were used (Figure 5) to quantify the dynamic relationship between changes in PetO2 or blood lactate and cerebral lactate. The positive impulse values and monophasic relationship between blood lactate and cerebral lactate supports the proposition that the increase in cerebral lactate is a result of increased blood lactate. The decrease in magnitude of the cerebral lactate response over time is consistent with a smaller diffusion gradient between the blood and cerebral lactate. Caution must be taken when considering the blood and cerebral lactate measurements, as we did not measure them simultaneously in the present experiment and the blood lactate measurements show a high level of variability, likely a function of blood sampling from the ear lobe and natural variability between subjects. The biphasic nature of the impulse response for PetO2 and brain lactate is characterised by a maximum effect at ~165 s. This system characteristic may indicate the effect of intermediate blood lactate or the oxidation of the increased lactate concentrations. It appears that a new lactate equilibrium concentration is developed (as opposed to a continuous increase in lactate) during a hypoxic challenge (Figure 5).
The use of dynamic end-tidal forcing permitted the close control of end-tidal gases (CO2 and O2), thus limiting variability in end-tidal values, associated with variability in the ventilatory response to hypoxia. The observed hypoxia-induced increases in lactate of ~20% in this study compared to ~30% in the previous study, that used a simple inspired hypoxia challenge without CO2 control (6), suggests that CO2 and blood flow may have a substantial effect on brain lactate uptake. Controlling CO2 prevents hypoxia-induced hypocapnia and thus is likely to maintain higher blood flow to tissues. Therefore, systemic tissues may have become less hypoxic and the production of systemic lactate may have been correspondingly less in the present study compared to the previous study. Controlling CO2 also limits changes in pH that would occur with changing CO2, thereby limiting confounds of lactate uptake being altered by pH changes.
Methodological differences between lactate-edited MRS and other non-edited acquisitions described in the literature (14) complicate comparisons. J-difference editing (employed here) separates the lactate signal from signals not coupled to spins at 4.1 ppm and yields a visible lactate signal. However, editing requires a relatively long TE (140 ms was used here), particularly in comparison to studies using stimulated echo attenuation mode (14). This will likely result in differences between the lactate compartments that are being interrogated, as our acquisition is more heavily T2-weighted, favouring signals from extracellular space, whereas a shorter TE will interrogate the intracellular space better. The relatively long echo time also means that the contribution of the macromolecular signal is relatively small. As documented previously (6), we include macromolecular peaks at 1.24 ppm and 1.43 ppm and then assume the macromolecular content does not change in the course of this experiment in an effort to more accurately quantify lactate. This approach has been applied previously, and it can be seen in e.g. Figure 2 of Edden et al. 2010 that the underlying macromolecular signal is largely unchanged in hypoxic conditions.
In conclusion, this is the first study to measure lactate concentration in a time- resolved fashion in the human brain using edited MR spectroscopy at 3T during a hypoxic challenge. We modelled the impulse response functions relating PetO2 and blood lactate to cerebral lactate during this hypoxic challenge. Cerebral lactate increases with hypoxia and appears to lag the increase of blood lactate. Our data, while not conclusive, are consistent with the notion that much of the increase in brain lactate results from transfer of lactate from blood into the brain where it may be oxidised.
Acknowledgments
Funding: ADH was funded by the Natural Sciences and Engineering Research Council of Canada and Banting Post-doctoral Fellowship Programme (NSERC of Canada); RAEE held an RCUK fellowship and is supported by NIH P41 RR15241; KM was supported by the Wellcome Trust. RGW was supported by the Higher Education Funding Council for Wales and the UK Medical Research Council.
We thank Dr Silvia Mangia for the informative discussions.
References
- 1.Dienel GA. Brain Lactate Metabolism: The Discoveries and the Controversies. J Cereb Blood Flow Metab. 2011 doi: 10.1038/jcbfm.2011.175. [Epub ahead of print] [DOI] [PMC free article] [PubMed] [Google Scholar]
- 2.Smith D, Pernet A, Hallett WA, Bingham E, Marsden PK, Amiel SA. Lactate: A Preferred Fuel for Human Brain Metabolism in Vivo. J Cereb Blood Flow Metab. 2003;23:658–664. doi: 10.1097/01.WCB.0000063991.19746.11. [DOI] [PubMed] [Google Scholar]
- 3.Boumezbeur F, Petersen KF, Cline GW, et al. The Contribution of Blood Lactate to Brain Energy Metabolism in Humans Measured by Dynamic 13c Nuclear Magnetic Resonance Spectroscopy. J Neurosci. 2010;30:13983–13991. doi: 10.1523/JNEUROSCI.2040-10.2010. [DOI] [PMC free article] [PubMed] [Google Scholar]
- 4.van Hall G, Stromstad M, Rasmussen P, et al. Blood Lactate Is an Important Energy Source for the Human Brain. J Cereb Blood Flow Metab. 2009;29:1121–1129. doi: 10.1038/jcbfm.2009.35. [DOI] [PubMed] [Google Scholar]
- 5.Bouzier AK, Thiaudiere E, Biran M, Rouland R, Canioni P, Merle M. The Metabolism of [3-(13)C]Lactate in the Rat Brain Is Specific of a Pyruvate Carboxylase-Deprived Compartment. J Neurochem. 2000;75:480–486. doi: 10.1046/j.1471-4159.2000.0750480.x. [DOI] [PubMed] [Google Scholar]
- 6.Edden RA, Harris AD, Murphy K, et al. Edited Mrs Is Sensitive to Changes in Lactate Concentration During Inspiratory Hypoxia. J Magn Reson Imaging. 2010;32:320–325. doi: 10.1002/jmri.22233. [DOI] [PubMed] [Google Scholar]
- 7.Robbins PA, Swanson GD, Micco AJ, Schubert WP. A Fast Gas-Mixing System for Breath-to-Breath Respiratory Control Studies. J Appl Physiol. 1982;52:1358–1362. doi: 10.1152/jappl.1982.52.5.1358. [DOI] [PubMed] [Google Scholar]
- 8.Wise RG, Pattinson KT, Bulte DP, et al. Dynamic Forcing of End-Tidal Carbon Dioxide and Oxygen Applied to Functional Magnetic Resonance Imaging. J Cereb Blood Flow Metab. 2007;27:1521–1532. doi: 10.1038/sj.jcbfm.9600465. [DOI] [PubMed] [Google Scholar]
- 9.Mescher M, Merkle H, Kirsch J, Garwood M, Gruetter R. Simultaneous in Vivo Spectral Editing and Water Suppression. NMR Biomed. 1998;11:266–272. doi: 10.1002/(sici)1099-1492(199810)11:6<266::aid-nbm530>3.0.co;2-j. [DOI] [PubMed] [Google Scholar]
- 10.Behar KL, Rothman DL, Spencer DD, Petroff OA. Analysis of Macromolecule Resonances in 1h Nmr Spectra of Human Brain. Magn Reson Med. 1994;32:294–302. doi: 10.1002/mrm.1910320304. [DOI] [PubMed] [Google Scholar]
- 11.Marmarelis VZ. Identification of Nonlinear Biological Systems Using Laguerre Expansions of Kernels. Ann Biomed Eng. 1993;21:573–589. doi: 10.1007/BF02368639. [DOI] [PubMed] [Google Scholar]
- 12.Mitsis GD, Governo RJ, Rogers R, Pattinson KT. The Effect of Remifentanil on Respiratory Variability, Evaluated with Dynamic Modeling. J Appl Physiol. 2009;106:1038–1049. doi: 10.1152/japplphysiol.90769.2008. [DOI] [PubMed] [Google Scholar]
- 13.Tuunanen PI, Murray IJ, Parry NR, Kauppinen RA. Heterogeneous Oxygen Extraction in the Visual Cortex During Activation in Mild Hypoxic Hypoxia Revealed by Quantitative Functional Magnetic Resonance Imaging. J Cereb Blood Flow Metab. 2006;26:263–273. doi: 10.1038/sj.jcbfm.9600186. [DOI] [PubMed] [Google Scholar]
- 14.Mangia S, Tkac I, Gruetter R, Van de Moortele PF, Maraviglia B, Ugurbil K. Sustained Neuronal Activation Raises Oxidative Metabolism to a New Steady-State Level: Evidence from 1h Nmr Spectroscopy in the Human Visual Cortex. J Cereb Blood Flow Metab. 2007;27:1055–1063. doi: 10.1038/sj.jcbfm.9600401. [DOI] [PubMed] [Google Scholar]
- 15.Simpson IA, Carruthers A, Vannucci SJ. Supply and Demand in Cerebral Energy Metabolism: The Role of Nutrient Transporters. J Cereb Blood Flow Metab. 2007;27:1766–1791. doi: 10.1038/sj.jcbfm.9600521. [DOI] [PMC free article] [PubMed] [Google Scholar]
- 16.Ullah MS, Davies AJ, Halestrap AP. The Plasma Membrane Lactate Transporter Mct4, but Not Mct1, Is up-Regulated by Hypoxia through a Hif-1alpha-Dependent Mechanism. J Biol Chem. 2006;281:9030–9037. doi: 10.1074/jbc.M511397200. [DOI] [PubMed] [Google Scholar]
- 17.Dalsgaard MK, Quistorff B, Danielsen ER, Selmer C, Vogelsang T, Secher NH. A Reduced Cerebral Metabolic Ratio in Exercise Reflects Metabolism and Not Accumulation of Lactate within the Human Brain. J Physiol. 2004;554:571–578. doi: 10.1113/jphysiol.2003.055053. [DOI] [PMC free article] [PubMed] [Google Scholar]
- 18.Mintun MA, Vlassenko AG, Rundle MM, Raichle ME. Increased Lactate/Pyruvate Ratio Augments Blood Flow in Physiologically Activated Human Brain. Proc Natl Acad Sci U S A. 2004;101:659–664. doi: 10.1073/pnas.0307457100. [DOI] [PMC free article] [PubMed] [Google Scholar]
- 19.Mintun MA, Lundstrom BN, Snyder AZ, Vlassenko AG, Shulman GL, Raichle ME. Blood Flow and Oxygen Delivery to Human Brain During Functional Activity: Theoretical Modeling and Experimental Data. Proc Natl Acad Sci U S A. 2001;98:6859–6864. doi: 10.1073/pnas.111164398. [DOI] [PMC free article] [PubMed] [Google Scholar]
- 20.Binks AP, Cunningham VJ, Adams L, Banzett RB. Gray Matter Blood Flow Change Is Unevenly Distributed During Moderate Isocapnic Hypoxia in Humans. J Appl Physiol. 2008;104:212–217. doi: 10.1152/japplphysiol.00069.2007. [DOI] [PubMed] [Google Scholar]
- 21.Buck A, Schirlo C, Jasinksy V, et al. Changes of Cerebral Blood Flow During Short-Term Exposure to Normobaric Hypoxia. J Cereb Blood Flow Metab. 1998;18:906–910. doi: 10.1097/00004647-199808000-00011. [DOI] [PubMed] [Google Scholar]
- 22.Pagani M, Salmaso D, Sidiras GG, et al. Impact of Acute Hypobaric Hypoxia on Blood Flow Distribution in Brain. Acta Physiol (Oxf) 2011;202:203–209. doi: 10.1111/j.1748-1716.2011.02264.x. [DOI] [PubMed] [Google Scholar]


