Abstract
A low cost, microfluidic paper electrochemical device (μPED) was fabricated using screen printing of electrodes and heat transfer of patterned wax paper onto filter paper. The μPED features films of a light-emitting ruthenium metallopolymer, microsomal metabolic enzymes, and DNA to detect potential genotoxic pollutant activity in environmental samples. Unlike conventional analytical methods that detect specific pollutant compounds, the μPED was designed to rapidly measure the presence of genotoxic equivalents in environmental samples with the signal related to benzo[a]pyrene (B[a]P) as a reference standard. The analytical endpoint is the detection of DNA damage from metabolites produced in the device using an electrochemiluminescence output measured with a charge-coupled device (CCD) camera. Proof-of-concept of this measurement was established for smoke, water and food samples. The μPED provides a rapid screening tool for on-site environmental monitoring that specifically monitors the genotoxic reactivity of metabolites of toxic compounds present in the samples.
INTRODUCTION
Low cost, easy to use, disposable bioanalytical devices promise to provide point-of-sampling monitors for food and water quality, pollutant toxicity detection, and medical diagnostics.1 – 3 Pioneering reports from Whitesides’ lab have described microfluidic paper analytical devices (μPADs) addressing multiplexed detection of analytes in urine and blood for disease diagnostics.4–7 In this paper, we report for the first time a simple, low tech fabrication of microfluidic paper electrochemical devices (μPEDs) made by heat transfer of wax paper templates, and applications to genotoxicity screening of environmental samples.
The device we describe represents a general paper electrochemical platform, but we focus here on detecting genotoxic activity of pollutants in environmental samples such as smoke, water and food. Genotoxicity here refers to the damage of DNA by chemicals and their metabolites. There is considerable recent research on new methodologies for genotoxicity assessment, but few approaches are applicable to assess genotoxic potential of environmental samples in the field.8 In this paper, we evaluate responses of a genotoxicity screening μPED for two compounds whose metabolites react with DNA, and by testing water sources, tobacco smoke, and grilled food.
Our μPEDs feature printed Ag/AgCl and carbon electrodes, and thin films fabricated from (bis-2,2′-bipyridyl) ruthenium polyvinylpyridine ([Ru(bpy)2(PVP)10]2+ or RuPVP), DNA and metabolic enzyme sources. Microsomal enzymes convert chemicals in the sample to metabolites that react with DNA in the film if they are able. Then, RuPVP in the film is activated by electrochemical oxidation to emit electrochemiluminescence (ECL) light by a catalytic reaction with DNA to monitor relative DNA damage.9–11 We previously elaborated this approach on more conventional, non-microfluidic arrays using thin film spots of RuPVP, DNA and metabolic enzymes on a pyrolytic graphite chip.9–11
PADs provide simple devices for biodiagnostic applications, and paper porosity facilitates fluid flow without pumps.12 Early approaches used colorimetry to detect glucose, uric acid and other analytes with reasonable sensitivities.6 Detection was extended to electrochemical, ECL, fluorescent and chemiluminescent methods.13 – 21 Origami-folded patterned paper was used with fluorescence to detect bovine serum albumin (BSA) upon unfolding the device.17 Printing electrodes on paper to make μPEDs or placing screen printed electrodes beneath a hydrophilic paper channel enabled measurement of PbII with a detection limit of 1 ppb14, and detection of glucose, lactate, cholesterol and ethanol using a commercial glucose sensor.16 Recently a battery-integrated PED was designed for electrochemical detection of glucose with electrochromic readout.18 PEDs were also used for ECL detection of several small molecules and proteins. For example, a mobile phone camera captured ECL to measure nicotinamide adenine dinucleotide (NADH).15 A 3D-PED enabled multiplexed protein detection using ECL from ruthenium bipyridyl-labeled antibodies.19
Patterning hydrophilic channels using hydrophobic boundaries on paper enables controlled microfluidic flow of reagents. Patterning has been achieved by wax printing, photolithography, plasma treatment, poly(dimethylsiloxane) (PDMS) printing, molten wax dipping, and lasers.22,23 These methods require about 10–15 min, but include several fabrication steps, and sophisticated equipment in most cases.
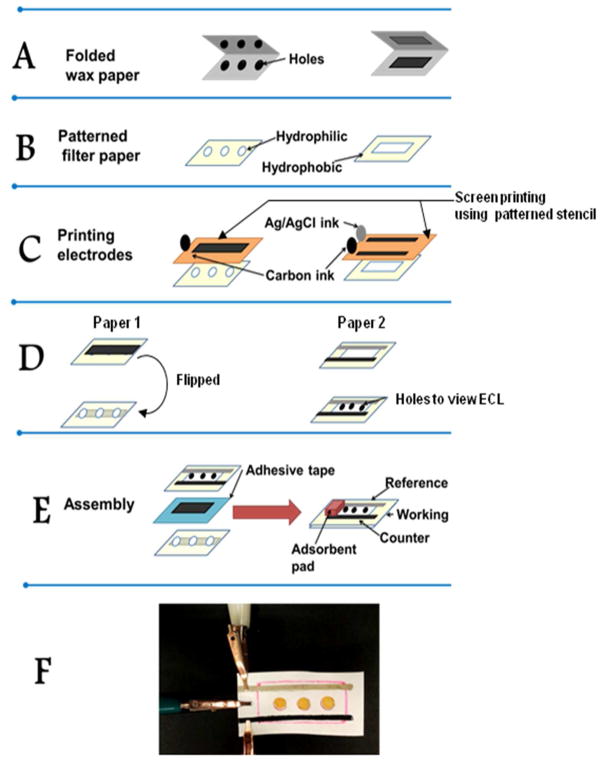
Fabrication of the μPED we report here involves cutting a pattern on commercial wax paper and transferring it with a small heat press (MAXX press, Stahls) onto filter paper to make hydrophilic channels or spots surrounded by hydrophobic boundaries defined by the transferred wax pattern (Figure 1B). Heat transfer of wax to the filter paper takes <5 s. The wax patterned filter paper is then hand screen printed with carbon working and counter electrodes, and a Ag/AgCl reference electrode using a stencil cut out of plastic transparency paper.
Figure 1.
Fabrication steps used in the assembly of paper electrochemical device: (A) Patterns are cut into two pieces of folded wax paper using a puncher and a sharp blade; (B) Two Whatman 1 filter papers are patterned by heat pressing between these folded wax paper templates at 350 °C for 60 s; (C) Working (left), counter and reference electrodes (right) are manually screen printed onto the two patterned filter papers using a stencil (orange) cut from plastic transparency paper, followed by curing at 60 °C for 7–10 min; (D) The paper with working electrode is flipped over and each hydrophilic spot is coated with (RuPVP/DNA)2RLM films. Holes are punched into the second filter paper containing the hydrophilic channel to visualize ECL light generated from DNA damage in the spots below after enzyme activation of test solutions; (E) Assembly of final device involves attaching the two processed paper pieces together with double sided tape so that the top paper with reference and counter electrodes has its holes aligned directly above (RuPVP/DNA)2RLM spots on the working electrode underneath; (F) Photograph of assembled μPED connected to potentiostat with alligator clips. Spots are (RuPVP/DNA)2RLM.
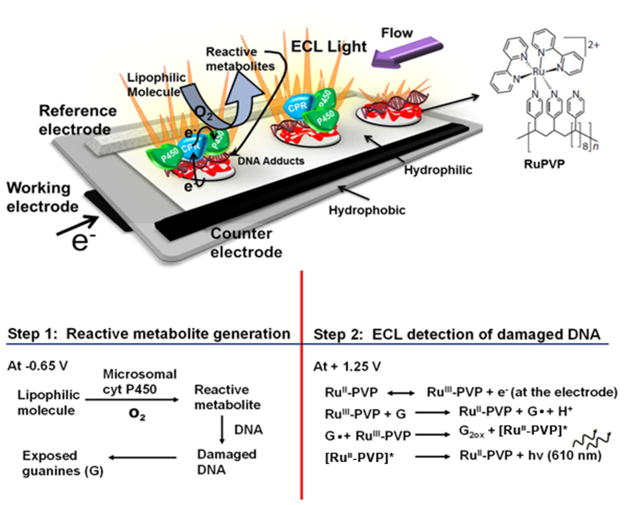
Fabrication of the device costs US $0.80 in materials, takes about 10 min, and uses commercially available materials. No specialized technical expertise or equipment is required. Scale up should be possible by using automated pattern cutting, a larger heat press, and a screen printer for electrodes. Another advantage of this approach is rapid prototyping for novel applications of paper-based devices since the materials are commonly available in most research laboratories. We equipped the μPED for ECL monitoring of DNA damage from metabolites generated by metabolic enzymes in the device. The first step in genotoxicity screening involves conversion of test compounds into metabolites by enzymes in the film. Cytochrome (cyt) P450s, the major oxidative metabolic enzymes, can be activated in these devices by H2O224, NADPH9 or electrodes.25–27 Using electrochemical activation, electrons can be delivered to cyt P450 reductase (CPR) in microsomal enzyme sources which then transfers them to cyt P450s for conversion of reactant molecules to metabolites in a pathway that mimics the natural process.25 Activated enzymes in the film convert the test chemical to its metabolites in a virtual sea of DNA, so that if the metabolite can react with DNA it will do so (Figure 2). Most often, reactive metabolites form covalent adducts with DNA bases that disrupt the double helix, but there is also the possibility of strand breakage and guanine oxidation.10,11
Figure 2.
Schematic representation of μPED with the working electrode printed on filter paper underneath the paper channel and spots in holes in this channel that are coated with DNA-enzyme-RuPVP and DNA films. The top paper has printed reference and counter electrodes, and the channel enables flow of oxygenated reactant solutions over the films for enzyme reactions. The μPED was placed in a darkbox and connected to potentiostat with applied potentials of −0.65 V vs. Ag/AgCl for metabolite generation (Step 1) and +1.25 V vs. Ag/AgCl for ECL detection (Step 2, G = guanines in DNA). A charge-coupled device camera detects the light.
The second step in the assay is DNA damage detection, which involves applying positive voltage to the working electrode to convert RuIIPVP to RuIIIPVP (Figure 2). The RuIIIPVP polymer oxidizes intact guanines in DNA to form excited state *RuIIPVP that decays to give ECL light at 610 nm.9,10,28 DNA damage by the reactive metabolites disrupts the double helix, and guanines in damaged DNA are more accessible to the RuIII centers in the polymer. The rate of catalytic oxidation of these guanines is thus faster for damaged DNA than in intact ds-DNA, and consequently the ECL light output is increased. Guanines are the only major reactants in the ECL process.28 A reactive metabolite that damages DNA produces more ECL light compared to intact ds-DNA. The rate of increase of ECL light with enzyme reaction time correlates directly with the rate of DNA adduct formation in similar films on colloidal reactor particles as measured by LC-MS/MS.9,10,24 ECL arrays are selective for compounds or their metabolites that damage DNA, and provide relative DNA damage rates that correlate well with the in vivo rodent tumorigenicity metric TD50.29
MATERIALS AND METHODS
Ruthenium metallopolymer [Ru(byp)2(PVP)10](ClO4)2 was prepared as previously described.30,31 Other chemicals were from commercial sources (See Supporting Information (SI) for full details.) Rat liver microsomes (RLM-F344) were from BD Gentest (Woburn, MA). Carbon graphite ink (C2050106D7) and silver/silver chloride ink (C2051014P10) were from Gwent Electronic Materials. DNA was calf thymus (type 1) from Sigma, 41.9 mole % G-C and 58.1 mole % A-T.
Paper analytical devices (μPADs) featuring hydrophilic channels with hydrophobic wax boundaries were made by heat pressing commercially available wax paper (Reynolds Cut-Rite) onto Whatman 1 filter paper. Briefly, the wax paper was first folded, then required patterns were made by cutting with a sharp blade and hole puncher (Figure 1A). These patterns cut from wax paper were marked with a permanent pen to enable visualization of the hydrophilic patterns over white paper. The filter paper was then placed between the folded wax paper template and pressed in a small thermal press for 60 s at 350 °C. The heat press transferred the wax pattern onto the filter paper from both sides (Figure 1B).
The full μPAD consists of two patterned filter papers fixed together using double sided tape. The first paper contained three analytical hydrophilic spots of 5 mm diameter separated by 1 cm from the center of each spot. Carbon ink was screen printed over these spots by spreading the ink over a cut patterned stencil (3 M transparency film, 5 mm × 40 mm) using a thin hard plastic applier (similar to a credit card) to spread ink over the stencil (Figure 1C), followed by curing 7–10 min at 60 °C. The resulting printed electrode was then flipped over (Figure 1D, left), and thin films containing RuPVP, DNA and rat liver microsomes (RLM, as source of metabolic enzymes) were assembled on the paper spots using layer-by-layer film fabrication.9 Briefly, 5 μL drops of each solution were deposited successively on the spots and allowed to stand for an appropriate optimized time.9 The deposition sequence was first 2.0 mg/mL RuPVP in 50% ethanol for 10 min, then 2.0 mg/mL calf thymus DNA in 10 mM pH 7 Tris buffer for 25 min, with steps repeated to form (RuPVP/DNA)2 films. Washing with water, followed by drying under nitrogen for a minute was done between each deposition step. Next, a dispersion of 10 mg/mL rat liver microsomes (RLM) in pH 7 Tris buffer was deposited for 30 min to form (RuPVP/DNA)2/RLM films. As a control, PDDA was used instead of RLM to form (RuPVP/DNA)2/PDDA. All steps were performed at room temperature (22 °C) in a humidifying chamber consisting of a wet towel at the bottom of a closed plastic container in order to avoid drying of solutions.
The second filter paper was patterned with a 35 × 17 mm hydrophilic channel. Inside the channel, 50 × 2 mm Ag/AgCl reference and carbon ink counter electrodes were printed parallel to each other and 13 mm apart (Figure 1C, right). After this step, 4 mm diameter holes were punched to fit above the DNA/RLM spots to view ECL. This second paper with the holed (Figure 1D, right) hydrophilic channel containing reference and counter electrode was aligned over the first paper electrode containing the spots with the working electrode underneath The two patterned screen printed papers were combined using a 35 × 20 mm double-sided tape border (Figure 1E). This assembly resulted in a device with working electrode on the bottom paper with spots containing analytical films, and a top paper containing reference and counter electrodes to complete an electrochemical cell. The hydrophilic channel enabled flow of buffer electrolytes and test samples required for enzyme reactions and ECL measurement with electrode connections to a potentiostat enabling the application of potential.
Benzo[a]pyrene (B[a]P) and 4-(methylnitrosamino)-1-(3-pyridyl)-1-butanone (NNK) were used as test compounds because of known reactions of their metabolites with DNA and their strong responses in our conventional ECL toxicity screen assays.9,24,29 (B[a]P an NKK are suspected human carcinogens and exposure should be avoided.) Assays were done in closed hoods in the dark while wearing safety gloves. Test solutions were 12.5 μM B[a]P and 25 μM NNK in phosphate buffer pH 7.4. As a control, DNA in (RuPVP/DNA)2 films was replaced with poly(acrylic acid) = PAA step by a 20 min incubation with 1 mg mL−1 of PAA in D. I. water. And ssDNA step by incubating with 2 mg mL−1 ssDNA in pH 7.0 Tris buffer. Cigarette smoke extracts were obtained by pulling smoke from a lit cigarette through a cotton plug in a syringe, with subsequent DMSO extraction of the cotton plug. Water samples were from Swan and Mirror lakes, Storrs, CT, USA. A chicken breast was grilled, and black material on its surface was dissolved in DMSO. Treated and untreated sewage water was from the Univ. of Connecticut Water Pollution Control Facility. Standard B[a]P was dissolved in 10 mM pH 7 Tris buffer.
Test solutions (200 μL) were pipetted onto one end of the microfluidic channel of the μPED, with the other end equipped with an adsorbent pad (a folded Kimwipe) (Figure 1E, right). For metabolite generation, −0.65 V vs. Ag/AgCl was applied, which reduces cyt P450 reductase (CPR) in the microsomes to initiate the catalytic cycle.27 Cyclic voltammograms of CPR in microsomal films on pyrolytic graphite electrodes were reversible and gave oxidation-reduction midpoint potential of −0.48 V.25 The more negative potential of −0.65 V was chosen to facilitate fast electron injection from electrode to microsomal CPR. CPR then transfers electrons to the cyt P450s in the presence of oxygen to activate the catalytic cycle.25,27 After this procedure generates metabolites, the channel was washed with pH 7.4 buffer. DNA damage detection then involves oxidation of RuPVP in thin films at +1.25 V, which in turn oxidizes DNA to produce excited RuIIPVP* that emits ECL light.28 Thus, +1.25 V vs. Ag/AgCl was applied for 240 s, at which time the catalytic current for the process was saturated, to generate 610 nm light that was captured by a CCD camera in a dark box.9 The effect of oxygen quenching of ECL in these films is negligible.32 Raw ECL images from μPEDs were processed by using Gene Snap software and converted to a color scale using Adobe Photoshop. Contrast levels were first adjusted using the Auto levels option, then this image was converted to color. The 3-spot images for individual devices were reconstructed for display by assembling all desired images into a single panel.
RESULTS AND DISCUSSION
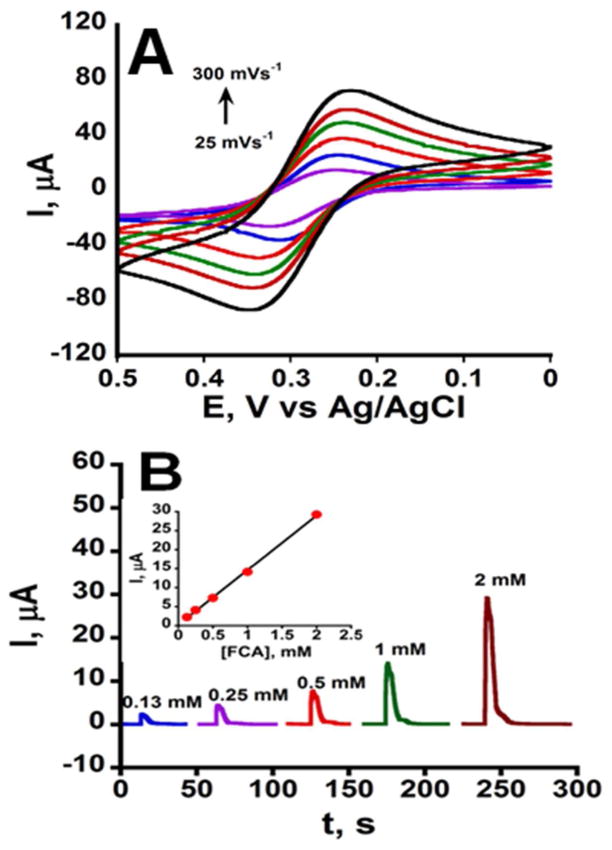
Electrochemical response and flow in the μPED were first characterized using ferrocene carboxylic acid (FCA) as a redox probe. Cyclic voltammograms (CV) of FCA/FCA+ (Figure 3A) showed the expected one electron oxidation-reduction peak pair separated by ~65 mV, only slightly larger than the theoretical value of 59 mV for a reversible CV reaction at 25 °C.33 Cell resistance was 33 Ω, capacitance 2 μF, and ohmic drop was 50% compensated. Peak current (ip) versus square root of scan rate (v1/2) was linear demonstrating diffusion control of the voltammetric peaks (Figure S1). These data were used with the Randles-Sêvcîk equation33 and the geometric area of the working electrode to estimate a diffusion coefficient (D) of 0.10 × 10⁻⁵ cm2 s−1, compared to 0.57 × 10⁻⁵ cm2 s−1 for FCA in aqueous solutions.34 This difference is attributed to paper forming a porous barrier on the electrode that the FCA must percolate through, and that partially blocks the electrode.14 To demonstrate flow, we injected FCA solutions into one end of the hydrophilic channel with an adsorbent wick made from a folded Kimwipe at the opposite end. A constant potential of 0.36 V vs. Ag/AgCl was used to monitor amperometric current from oxidation of FCA to FCA+. Figure 3B shows the amperometric oxidation current of FCA flowing past the working electrode. A linear plot demonstrating peak current proportional to concentration of FCA was obtained (Figure 3B inset). Adsorbent pads quickly wick the solution, drawing the electroactive probes over the working electrode enabling its oxidation, and results suggest a relatively constant flow rate. Repeated injections of FCA followed by washing show reproducible amperometric current response (n=5) demonstrating reproducible flow rates in the paper channels.
Figure 3.
Electrochemical characterization of the basic μPED: (A) Cyclic voltammograms of 2 mM ferrocene carboxylic acid (FCA) in 0.5 M KCl at pH 7.0 (oxidation current is downward); (B) Amperometric oxidation currents after injecting 0.13 to 2 mM FCA into the fluidic channel at a right angle to the electrode at a potential of 0.36 V vs. Ag/AgCl. Inset is calibration (n=5). Error bars are not visible due to very small standard deviations.
The μPED was outfitted for genotoxicity screening by including the three wax patterned hydrophilic paper spots (Figure 1) with a carbon working electrode underneath. The paper contains cellulose fibers with low concentrations of carboxyl groups imparting a negative surface charge.12 The hydrophilic paper spots can then be utilized to construct thin film assemblies using layer-by-layer (LbL) alternate electrostatic adsorption.9–10,11 LbL fabrication was used to make composite films of RuPVP (cationic polyion), DNA (anionic polyion) and rat liver microsomes (RLM, anionic enzyme source) on these spots. The principle here is that the charge of each new adsorbed material is reversed from that of the underlayer at every step to utilize strong electrostatic forces to hold the film together.35 In previous studies on pyrolytic graphite surfaces, these films showed excellent stability and maintained activity for several weeks.11 The top paper in the μPED features a wax-patterned channel printed with reference and counter electrodes. Holes were punched into this top channel to view ECL from analytical spots on the bottom paper, which also has the working electrode strip. To run the enzyme reactions, oxygenated test solutions were made to flow across the RuPVP/DNA/enzyme film spots using a wick at the end of the microfluidic channel. Then, the channel is washed with buffer, and ECL is measured by a CCD camera during application of voltage.
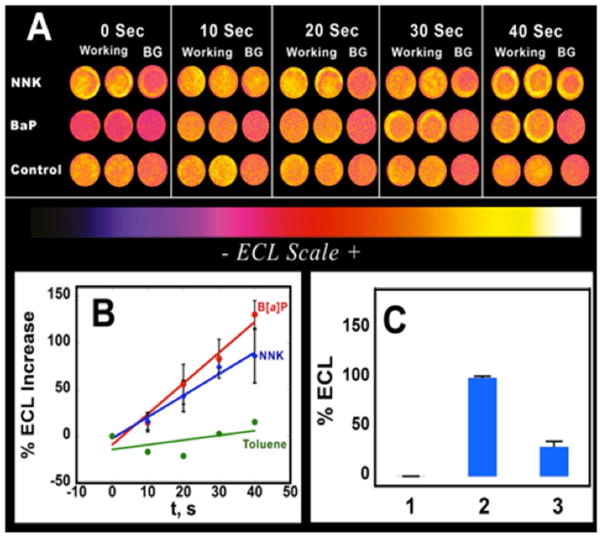
Figure 4A, B shows results from μPEDs featuring RuPVP/DNA/RLM spots exposed to 12.5 μM B[a]P, 25 μM NNK and 20 mM toluene for different enzyme reaction times (0–40s). As described above, the two steps (Figure 2) are: (a) first, enzyme reactions are driven by electron injection from the cathode to microsomal cyt P450 reductase, which donates them to cyt P450s;25 then (b) a potential of +1.25 V vs. Ag/AgCl is applied to generate RuIIIPVP that reacts with DNA to produce ECL light that is measured with a CCD camera.9,10 Control spots at 0 s represent experiments with no reactant. Background spots (BG) are (RuPVP/DNA)2PDDA [PDDA=polydimethyldiallylamine] without enzymes but exposed to the reactants. ECL of spots with (RuPVP/DNA)2/RLM exposed to test chemical reactants increased with increase in enzyme reaction time. Spots with no enzymes in the films, with enzymes but no test chemicals, or with
Figure 4.
Genotoxicity screening responses using the μPED to develop 3 spots simultaneously: (A) Reconstructed ECL array images for a series of enzyme reaction times for (RuPVP/DNA)2/RLM spots in duplicate and a background (RuPVP/DNA)2/PDDA spot (BG). B[a]P and NNK are reactants and toluene is a low reactive control. (B) Influence of enzyme reaction time on % ECL increase for 12.5 μM B[a]P, 25 μM NNK and toluene (negative control), n=4. (C) % ECL above control for 1) poly(acrylic acid) control, 2) ssDNA and 3) ds DNA in (RuPVP/DNA)2 films at applied potential of +1.25 V for 240 sec (n=3). The poorly reactive control toluene showed much lower ECL intensities compared to spots exposed to B[a]P or NNK.
Figure 4A shows increases in ECL light intensity over 0–40 s for B[a]P and NNK. ECL light from the 0 sec and BG controls varied significantly from device-to-device. The spatial distribution of ECL intensity of the paper spots shows a non-uniform distribution of films similar to conventional PG arrays29, and in protein detection arrays. Non-uniform ECL intensities in the spots are likely to be the result of non-uniform distribution of film materials.
To account for device-to-device variability, intensity data from two devices (i.e. 4 working spots, 2 background) were averaged, followed by subtracting the average background intensity (BG) from the analytical spot intensity. Then, the percentage increase in ECL was calculated relative to the 0 s controls. For example, % ECL increase at time t = 100% × [average BG-subtracted ECL at time t – average BG-subtracted ECL at time 0 divided by average ECL at time 0). This approach minimized signal variability from device to device, which is represented for % ECL estimated in this way by error bars in Figure 4B. Data are expressed (Figure 4B) as the percentage ECL increase versus enzyme reaction time for spots exposed to B[a]P and NNK, which produce known DNA reactive metabolites that also give genotoxicity responses on our conventional ECL arrays.10,24,29
The initial slope of % ECL increase vs. enzyme reaction time represents relative DNA damage, as shown previously by correlations of conventional ECL genotoxicity arrays with nucleobase adduct formation measured by LC-MS/MS.10,11 Slopes for B[a]P and NNK are not significantly different according to t-tests at 90 and 95% confidence intervals. This slope divided by enzyme and substrate concentrations represents a relative DNA damage rate due to the apparent enzyme turnover rate for production of DNA-reactive metabolites.29 The amount of enzyme in the spots was estimated by making spots on a quartz crystal microbalance (QCM) and weighing each dried layer (Figure S2, Table S1). Using these data, B[a]P showed a relative DNA-damage turnover rate of 43 min−1*μg of protein−1 *μM of substrate−1 compared to 15 min−1*μg of protein−1 *μM of substrate−1 for NNK. Turnover rates on the μPED were similar to those found on our conventional genotoxicity arrays, where turnover ratio B[a]P/NNK of 2.6 was obtained compared to the 2.9 found here for the μPED’s. The toluene control gave a very low turnover rate consistent with its much lower genotoxicity.29
ECL is generated in the μPED by electrochemically oxidizing RuPVP in the presence of DNA as the co-reactant. Intact guanines in the DNA are the species that react with RuIIIPVP (Figure 2, Step 2).28 When guanines are present in damaged DNA or in ss-DNA, they are more accessible for reactions with the RuIII centers in RuPVP, and the reaction rate increases, increasing the ECL output. To confirm this chemistry on the μPED, we assembled thin films of (RuPVP/DNA)2 containing single-strand (ss) and double stranded DNA on the μPED and observed their relative ECL in the absence of metabolic reactions. The ss-DNA has guanine bases that are much more exposed than ds-DNA, and so should give more ECL light. Control ECL from (RuPVP/poly(acrylic acid))2 films without DNA was subtracted from films containing oligonucleotides. Films containing ss-DNA gave 70% more ECL light compared to ds-DNA (Figure 4C), consistent for RuPVP ECL with these two polynucleotides as co-reactants.
Next, we used the μPED to screen several common environmental samples for chemical content with DNA-reactive metabolites. Large ECL intensities above the control were obtained for untreated sewage water compared to treated water (Figure 5A). As above, these increases are displayed relative to the BG controls. Water samples from campus lakes showed insignificant changes in ECL intensities (Figure 5A) compared to control purified water.
Figure 5.
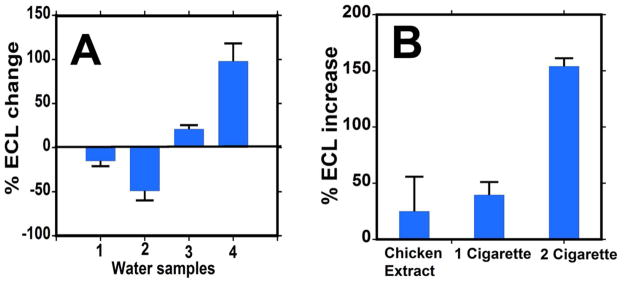
Tests of environmental samples with the μPED: (A) %ECL change relative to pure water for water samples 1) Swan lake, 2) Mirror lake, 3) treated sewage sample and 4) untreated sewage samples. (B) % ECL increase for 1 and 2 cigarette extracts and grilled chicken skin extracts.
Figure 5A shows quantitative representation of % ECL change over control pure water for each water sample. The decreased response for lake waters suggests insignificant levels of genotoxic compounds in the lakes, or possibly decreased selectivity due to the presence of ECL inhibiting materials that require further investigation. Untreated sewage water gave the most dramatic response, showing a large increase in % ECL indicating the significant presence of genotoxic compounds. This is consistent with studies reporting genotoxic chemicals, mainly polycyclic aromatic hydrocarbons (PAHs), in domestic sewage water using in vitro bioassays.36,37
We also tested cigarette smoke since it contains genotoxic chemicals including polyaromatic hydrocarbons (PAHs) such as B[a]P, nitrosamines and aromatic amines.38 We trapped cigarette smoke on cotton filters using an artificial inhalation device, then extracted the filters into 1 mL of dimethyl sulfoxide. Figure 5B shows % ECL increase for 100-fold diluted smoke extracts obtained from 1 and 2 cigarettes. An ECL increase of 40% for 1 cigarette and 150% for 2 cigarettes were found compared to control (1% DMSO) for enzyme reaction time 30 s. This in vitro μPED test suggests significant DNA-reactive chemicals in the smoke even at 100-fold dilution. The result is in agreement with a recent in vivo study reporting DNA damage by cigarette smoking in minutes, confirmed by monitoring isotope-labeled phenanthrene metabolites in plasma samples of smokers.39
We then extracted chemicals from the charred skin of a grilled chicken into DMSO. Figure 5B shows an ECL increase of 25% for the 100-fold diluted extract compared to control (1% DMSO) for enzyme reaction time of 30 s. Though questionably significant due to the large standard deviation, an increase is consistent with a recent study revealing genotoxic chemicals such as heterocyclic amines in grilled chicken entrees from US food giants.40
To place results in a genotoxicity context, we correlated μPED data from the environmental samples to the % ECL increase over control for standard B[a]P (Figure 6), a known genotoxic chemical. In conventional analytical terms, a detection limit of ~150 nM and a linear dynamic range of 0.15 to 12.5 μM was obtained for B[a]P. The linear dynamic range is controlled by the amount of DNA and enzymes in the films, resulting in a saturated ECL response at very large B[a]P concentration. We expressed % ECL increase from the samples to obtain the equivalent amount of B[a]P as summarized in Table 1, using extrapolations for estimates > 10 mM. Cigarette samples and untreated sewage samples showed much higher equivalent levels of B[a]P compared to the other samples.
Figure 6.
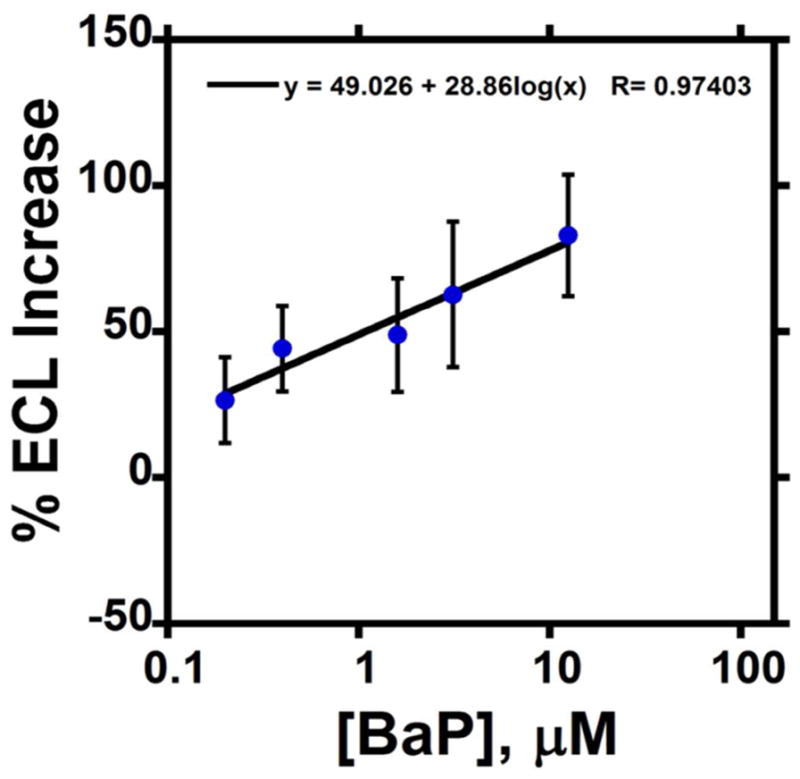
% ECL increase over control (Tris pH 7.0) for different concentrations of B[a]P in 10 mM Tris buffer pH 7.0 for a 30s enzyme reaction. This calibration plot was utilized to estimate the B[a]P equivalents from μPED assays of the environmental samples.
Table 1.
Equivalent relative concentrations of B[a]P for environmental samples
| Sample | B[a]P equivalents, μM |
|---|---|
| Chicken extract | 0.15 ± 0.23 |
| 1 Cigarette | 0.50 ± 0.05 |
| 2 Cigarettes | >50 |
| Treated sewage water | 0.10 ± 0.02 |
| Untreated sewage water | ~50 |
Overall, the μPED described here produces metabolites of chemicals in the sample and measures their reactivity with DNA. Unlike conventional analytical devices that measure concentrations of individual compounds, the μPED monitors the relative potential for genotoxicity resulting from the combined pool of toxic chemicals present in the samples. The device is intended as a rapid, low cost field screening tool to rapidly determine if samples contain potentially genotoxic chemicals. If the test is positive, additional tools such as LC-MS can be used to identify and quantify individual chemicals that give rise to the DNA damage. The device can be used to rapidly screen out samples that have a low toxic potential, and indicate more extensive studies only on samples that present potential genotoxicity. In the future, we could envision integration of separation techniques or selective detection of toxic chemicals into a μPED for selective quantification of genotoxic chemicals, e.g. with an lab-based LC-MS endpoint.
In summary, we have presented herein a new, simple, fast, low cost fabrication method for microfluidic paper electrochemical devices using wax paper, filter paper and carbon and metal inks. The materials cost is US$0.80 per μPED, and assays are completed in several min. The μPEDs equipped with RuPVP/DNA/enzyme spots were used to demonstrate proof-of-concept in screening for genotoxic compounds in water, food and smoke. With further improvements in device-to-device reproducibility, these easily fabricated devices promises to provide wide access to inexpensive on-site environmental toxicity screening.
Supplementary Material
Acknowledgments
This work was financially supported by grants ES03154 from National Institutes of Environmental Health Sciences (NIEHS), EB014586 from the National Institute of Biomedical Imaging and Bioengineering (NIBIB), NIH, USA
References
- 1.Gubala V, Harris LF, Ricco AJ, Tan MX, Williams DE. Point of care diagnostics: status and future. Anal Chem. 2012;84:487–515. doi: 10.1021/ac2030199. [DOI] [PubMed] [Google Scholar]
- 2.Mao X, Huang TJ. Microfluidics diagnostics for the developing world. Lab Chip. 2012;12:1412–1416. doi: 10.1039/c2lc90022j. [DOI] [PMC free article] [PubMed] [Google Scholar]
- 3.Rogers KR. Recent advances in biosensor techniques for environmental monitoring. Anal Chim Acta. 2006;568:222–231. doi: 10.1016/j.aca.2005.12.067. [DOI] [PubMed] [Google Scholar]
- 4.Martinez AW, Phillips ST, Butte MJ, Whitesides GM. Patterned paper as a platform for inexpensive low-volume portable assays. Angew Chem Int Ed. 2007;119:1340–1342. doi: 10.1002/anie.200603817. [DOI] [PMC free article] [PubMed] [Google Scholar]
- 5.Martinez AW, Phillips ST, Whitesides GM. Three-dimentional microfluidic devices fabricated in layered paper and tape. Proc Natl Acad Sci U S A. 2008;105:19606–19611. doi: 10.1073/pnas.0810903105. [DOI] [PMC free article] [PubMed] [Google Scholar]
- 6.Martinez AW, Phillips ST, Carrilho E, Thomas SW, Sindhi H, Whitesides GM. Simple telemedicine for developing regions: camera phones and paper-based microfluidic devices. Anal Chem. 2008;80:3699–3707. doi: 10.1021/ac800112r. [DOI] [PMC free article] [PubMed] [Google Scholar]
- 7.Martinez AW, Phillips ST, Whitesides GM. Diagnostics for the developing world: microfluidic paper-based analytical devices. Anal Chem. 2010;82:3–10. doi: 10.1021/ac9013989. [DOI] [PubMed] [Google Scholar]
- 8.Lynch AM, Sasaki JC, Elespuru R, Jacobson-Kram D, Thybaud V, De Boeck M, et al. New and emerging technologies for genetic toxicity testing. Environ Mol Mutagen. 2011;52:205–223. doi: 10.1002/em.20614. [DOI] [PubMed] [Google Scholar]
- 9.Krishnan S, Bajarami B, Hvastkovs EG, Choudhary D, Schenkman JB, Rusling JF. Synergistic metabolic toxicity screening using microsome/DNA electrochemiluminescent arrays and nanoreactors. Anal Chem. 2008;80:5279–5285. doi: 10.1021/ac800763r. [DOI] [PMC free article] [PubMed] [Google Scholar]
- 10.Rusling JF, Hvastkovs EG, Schenkman JB. In: Drug Metabolism Handbook. Nassar A, Hollenburg PF, Scatina J, editors. Wiley; Hoboken, NJ: 2009. pp. 307–340. [Google Scholar]
- 11.Hvastkovs EG, Schenkman JB, Rusling JF. Metabolic toxicity screening using electrochemiluminescence arrays coupled with enzyme-DNA biocolloid reactors and liquid chromatography-mass spectrometry. Annu Rev Anal Chem. 2012;5:79–105. doi: 10.1146/annurev.anchem.111808.073659. [DOI] [PMC free article] [PubMed] [Google Scholar]
- 12.Pelton R. Bioactive paper provides a low-cost platform for diagnostics. Trends Anal Chem. 2009;28:925–942. doi: 10.1016/j.trac.2009.05.005. [DOI] [PMC free article] [PubMed] [Google Scholar]
- 13.Dungchai W, Chailapakul O, Henry CS. Electrochemical detection for paper-based microfluidic devices. Anal Chem. 2009;81:5821–5826. doi: 10.1021/ac9007573. [DOI] [PubMed] [Google Scholar]
- 14.Nie Z, Nijhuis CA, Gong J, Chen X, Kumachev A, Martinez AW, Narovlyansky M, Whitesides GM. Electrochemical sensing in paper-microfluidic devices. Lab Chip. 2010;10:477–483. doi: 10.1039/b917150a. [DOI] [PMC free article] [PubMed] [Google Scholar]
- 15.Delaney JL, Hogan CF, Tian J, Shen W. Electrogenerated chemiluminescence detection in paper-based microfluidic sensors. Anal Chem. 2011;83:1300–1306. doi: 10.1021/ac102392t. [DOI] [PubMed] [Google Scholar]
- 16.Nie Z, Deiss F, Liu X, Akbulut O, Whitesides GM. Integration of paper-based microfluidic devices with commercial electrochemical readers. Lab Chip. 2010;10:3163–3169. doi: 10.1039/c0lc00237b. [DOI] [PMC free article] [PubMed] [Google Scholar]
- 17.Liu H, Crooks RM. Three-dimentional paper microfluidic devices assembled using the principles of origami. J Am Chem Soc. 2011;133:17564–17566. doi: 10.1021/ja2071779. [DOI] [PubMed] [Google Scholar]
- 18.Liu H, Crooks RM. Paper-based electrochemical sensing platform with integral battery and electrochromic read-out. Anal Chem. 2012;84:2528–2532. doi: 10.1021/ac203457h. [DOI] [PubMed] [Google Scholar]
- 19.Ge L, Yan J, Song X, Yan M, Ge S, Yu J. Three-dimensional paper-based electrochemiluminescence immunodevice for multiplexed measurement of biomarkers and point-of-care testing. Biomaterials. 2012;33:1024–1031. doi: 10.1016/j.biomaterials.2011.10.065. [DOI] [PubMed] [Google Scholar]
- 20.Yu J, Ge L, Huang J, Wang S, Ge S. Microfluidic paper-based chemiluminescence biosensor for simultaneous determination of glucose and uric acid. Lab Chip. 2011;11:1286–1291. doi: 10.1039/c0lc00524j. [DOI] [PubMed] [Google Scholar]
- 21.Thom NK, Yeung K, Pillion MB, Phillips ST. “Fluidic batteries” as low-cost sources of power in paper-based microfluidic devices. Lab Chip. 2012;12:1768–1770. doi: 10.1039/c2lc40126f. [DOI] [PubMed] [Google Scholar]
- 22.Li X, Ballerini DR, Shen W. A perspective on paper-based microfluidics: current status and future trends. Biomicrofluidics. 2012;6:011301-1–13. doi: 10.1063/1.3687398. [DOI] [PMC free article] [PubMed] [Google Scholar]
- 23.Ballerini DR, Li X, Shen W. Patterned paper and alternative materials as substrates for low-cost microfluidic diagnostics. Microfluid Nanofluid. 2012 doi: 10.1007/s10404-012-0999-2. [DOI] [Google Scholar]
- 24.Hvastkovs EG, So M, Krishnan S, Bajrami B, Tarun M, Jansson I, Schenkman JB, Rusling JF. Electrochemiluminescent arrays for cytochrome P450-activated genotoxicity screening. DNA damage from benzo[a]pyrene metabolites. Anal Chem. 2007;79:1897–1906. doi: 10.1021/ac061975q. [DOI] [PMC free article] [PubMed] [Google Scholar]
- 25.Krishnan S, Wasalathanthri D, Zhao L, Schenkman JB, Rusling JF. Efficient bioelectronic actuation of the natural catalytic pathway of human metabolic cytochrome P450s. J Am Chem Soc. 2011;133:1459–1465. doi: 10.1021/ja108637s. [DOI] [PMC free article] [PubMed] [Google Scholar]
- 26.Wasalathanthri DP, Mani V, Tang CK, Rusling JF. Microfluidics electrochemical array for detection of reactive metabolites formed by cytochrome P450 enzymes. Anal Chem. 2011;83:9499–9506. doi: 10.1021/ac202269t. [DOI] [PMC free article] [PubMed] [Google Scholar]
- 27.Krishnan S, Schenkman JB, Rusling JF. Bioelectronic delivery of electrons to cytochrome P450 enzymes. J Phys Chem B. 2011;115:8371–8380. doi: 10.1021/jp201235m. [DOI] [PMC free article] [PubMed] [Google Scholar]
- 28.Dennany L, Forster RJ, Rusling JF. Simultaneous direct electrochemiluminescence and catalytic voltammetry detection of DNA in ultrathin films. J Am Chem Soc. 2003;125:5213–5218. doi: 10.1021/ja0296529. [DOI] [PubMed] [Google Scholar]
- 29.Pan S, Zhao L, Schenkman JB, Rusling JF. Evaluation of electrochemiluminescence metabolic toxicity screening arrays using a multiple compound set. Anal Chem. 2011;83:2754–2760. doi: 10.1021/ac200050n. [DOI] [PMC free article] [PubMed] [Google Scholar]
- 30.Hogan CF, Forster RJ. Mediated electron transfer for electroanalysis: transport and kinetics in thin films of [Ru(bpy)2PVP10](ClO4)2. Anal Chim Acta. 1999;396:13–21.3. [Google Scholar]
- 31.Forster RJ, Hogan CF. Electrochemiluminescent metallopolymer coatings: combined light and current detection in flow injection analysis. Anal Chem. 2000;72:5576–5582. doi: 10.1021/ac000605d. [DOI] [PubMed] [Google Scholar]
- 32.Dennany L, Keyes TE, Forster RJ. Surface confinement and its effects on the luminescence quenching of a ruthenium-containing metallopolymer. Analyst. 2008;133:753–759. doi: 10.1039/b718505g. [DOI] [PubMed] [Google Scholar]
- 33.Bard AJ, Faulkner LR. Electrochemical Methods. 2. Wiley; N. Y: 2001. pp. 241–243. [Google Scholar]
- 34.Bartlett PN, Pratt KFE. A study of the kinetics of the reaction between ferrocene monocarboxylic acid and glucose oxidase using the rotating disc electrode. J Electroanal Chem. 1995;397:53–60. [Google Scholar]
- 35.Lvov Y. In: Handbook of Surfaces and Interfaces of Materials. Nalwa RW, editor. Vol. 3. Academic Press; San Diego: 2001. pp. 170–189. [Google Scholar]
- 36.White PA, Rasmussen JB. The genotoxic hazards of domestic wastes in surface waters. Mutat Res. 1998;410:223–236. doi: 10.1016/s1383-5742(98)00002-7. [DOI] [PubMed] [Google Scholar]
- 37.Thewes MR, Junior DE, Droste A. Genotoxicity biomonitoring of sewage in two municipal wastewater treatment plants using the Tradescantia pallida var. purpurea bioassay. Genet Mol Biol. 2011;34:689–693. doi: 10.1590/S1415-47572011005000055. [DOI] [PMC free article] [PubMed] [Google Scholar]
- 38.Hecht SS. Tobacco carcinogens, their biomarkers and tobacco-induced cancer. Nat Rev Cancer. 2003;3:733–744. doi: 10.1038/nrc1190. [DOI] [PubMed] [Google Scholar]
- 39.Zhong Y, Carmella SG, Upadhyaya P, Hochalter JB, Rauch D, Oliver A, Jensen J, Hatsukami D, Wang J, Zimmerman C, Hecht SS. Immediate consequences of cigarette smoking: rapid formation of polycyclic aromatic hydrocarbon diol epoxides. Chem Res Toxicol. 2011;24:245–252. doi: 10.1021/tx100345x. [DOI] [PMC free article] [PubMed] [Google Scholar]
- 40.Sullivan KM, Erickson MA, Sanusky CB, Barnard ND. Detection of PhIP in grilled chicken entrees at popular chain restaurants throughout California. Nutr Cancer. 2008;60:592–602. doi: 10.1080/01635580801956519. [DOI] [PubMed] [Google Scholar]
Associated Data
This section collects any data citations, data availability statements, or supplementary materials included in this article.


