

Abstract
Purpose
Measurement variance affects the clinical effectiveness of PET-based measurement as a semi-quantitative imaging biomarker for cancer response in individual patients and for planning clinical trials. In this study, we measured test-retest reproducibility of SUV measurements under clinical practice conditions, and recorded recognized deviations from protocol compliance.
Methods
Instrument performance calibration, display and analyses conformed to manufacture recommendations. Baseline clinical 2-deoxy-2-[F-18]fluoro-D-glucose (FDG)-PET/CT examinations were performed and then repeated at 1 – 7 days. Intended scan initiation uptake period was to repeat the examinations at the same time for each study after injection of 12 mCi FDG tracer. Avidity of uptake was measured in 62 tumors in 21 patients as standardized uptake value for maximum voxel (SUVmax) and for a mean of sampled tumor voxels (SUVmean).
Results
The range of SUVmax and SUVmean was 1.07–21.47 and 0.91–14.69, respectively. Intraclass correlation coefficient (ICC) between log of SUVmax and log of SUVmean was 0.93 (95% CI: 0.88–0.95) and 0.92 (95% CI: 0.87–0.95), respectively. Correlation analysis failed to show an effect on uptake period variation on SUV measurements between the two examinations, suggesting additional sources of noise. The threshold criteria for relative difference from baseline for the 95% confidence interval were ±49% or ±44% for SUVmax or SUVmean, respectively.
Conclusion
Variance of SUV for FDG-PET/CT in current clinical practice in a single institution was greater than expected when compared to benchmarks reported under stringent efficacy study settings. Under comparable clinical practice conditions, interpretation of changes in tumor avidity in individuals, and assumptions in planning clinical trials may be affected.
Keywords: FDG, PET, standardized uptake value, clinical effectiveness, test-retest reproducibility, external validity
Introduction
Positron emission tomography (PET) using a glucose analog, 2-deoxy-2-[F-18]fluoro-D-glucose (FDG)1,2, integrated with computed tomography (FDG-PET/CT)3,4, is useful5 for metabolic6 imaging in cancer. A Quantitative avidity measurement for serial activity measurements7–11 of many cancer deposits potentially contributes a semi-quantitative predictive or surrogate endpoint biomarker12–14 for cancer care.
The standardized uptake value (SUV), a semi-quantitative measurement for tracer avidity on PET/CT, is widely available using commercial software available from manufacturers of imaging instrumentation. Although efficacy studies to measure variance of baseline SUV measurements are relatively few, with limited spectrum of cancers, preliminary recommendations for interpretive criteria have been published. In landmark publication, Wahl and expert collaborators have proposed the PERCIST 1.014 system as a working foundation to refine and validate quantitative approaches to monitoring FDG-PET tumor avidity response, integrated with anatomic measurements. They proposed preliminary interpretive criteria based upon benchmark variance estimates derived from stringent study settings15–19, and upon expert judgment derived from clinical experience. The proposed 30% threshold for a change for the FDG avidity index is subject to modification as future research may dictate. The authors emphasize the need for strictly reproduced technique. The European Organization for Research and Treatment of Cancer (EORTC) PET Study Group has recommended a 25% threshold.19
A report on FDG-PET test-retest variance in cancer measurements in a multicenter study20, showed thresholds for difference in baseline ranging from 32% to 52%. Limited analysis suggested that variance depended partly on compliance with protocols. Another report in non-small cell lung cancer suggested a threshold of 37%21. The variance of SUV measurements not only affects individual patient management but determines power in clinical trials.22,23
The present report extends work from one center contributing to the multicenter study20, including additional cases, more detailed analyses of sources of variance, discussion of the importance of the findings, and suggestions for process improvements.
Methods
The Institutional Review Board of the University of South Florida reviewed and approved the study protocol for retrospective review. Patients had received with two PET/CT examinations performed 1 – 7 days apart (median, 2 days; range 1–7 days), just before phase I trials for therapy of resistant solid tumors: CA1820021 (4 patients) and CA182003 (17 patients); 11, women; 10, men (median age, 58 yrs; range, 42 – 74 yrs) (Table 1).
Table 1.
Age, sex and description of lesion in patients.
| S. No. | Age | Sex | No. of lesions | Localization of lesions | Primary tumor description |
|---|---|---|---|---|---|
| 1 | 58 | F | 1 | Axilla | Ovarian cancer |
| 1 | Mediastinum | ||||
| 1 | Pelvis | ||||
| 2 | 74 | F | 3 | Liver | Carcinoid |
| 3 | 49 | M | 2 | Axillae | Breast cancer |
| 2 | Supra-clavicle | ||||
| 1 | Chest wall | ||||
| 4 | 63 | M | 5 | Liver | Melanoma |
| 5 | 64 | M | 3 | Liver | Colon cancer |
| 6 | 59 | M | 3 | Liver | Colon cancer |
| 1 | Retro-canal | ||||
| 1 | Para-aortic | ||||
| 7 | 54 | F | 1 | Liver | Colon cancer |
| 1 | Pelvis | ||||
| 1 | Lung | ||||
| 8 | 51 | M | 2 | Liver | Colon cancer |
| 9 | 49 | M | 2 | Lung | Gastric cancer |
| 3 | Liver | ||||
| 10 | 69 | M | 1 | Liver | Colon cancer |
| 11 | 58 | F | 1 | Liver | Rectal cancer |
| 1 | Lung | ||||
| 1 | Adrenal | ||||
| 12 | 42 | F | 2 | Lung | Colon cancer |
| 1 | Adrenal | ||||
| 13 | 54 | F | 1 | Spleen | Colon cancer |
| 1 | Liver | ||||
| 1 | Lung | ||||
| 14 | 53 | F | 1 | Lung | Colon cancer |
| 1 | Liver | ||||
| 15 | 72 | M | 2 | Liver | Colon cancer |
| 16 | 45 | F | 3 | Liver | Colon cancer |
| 17 | 66 | F | 1 | Kidney | Colon cancer |
| 18 | 50 | M | 1 | Liver | Colon cancer |
| 1 | Para-aortic | ||||
| 1 | Periportal | ||||
| 19 | 63 | M | 2 | Liver | Rectal cancer |
| 1 | Lung | ||||
| 20 | 51 | M | 2 | Liver | Colorectal cancer |
| 21 | 49 | F | 1 | Liver | Colon cancer |
| 1 | Para-aortic |
Imaging
Routine equipment performance verification steps complied with manufacturer instructions for calibration, attenuation correction, coincidences correction and detector variation correction, image reconstruction including smoothing, decay correction, manual clock synchronization, and dose calibration. Quarterly procedures included multidimensional phantom image stability verification and well check, 12 hour normalization stability verification and internal coincidence timing verification. Weekly automated checks include detector dead time, energy calibration and amplifier gain. Daily automated checks include normalization, coincidence timing correction, tube warm up and CT calibration.
Examination protocols incorporated recommended standards.24 Patients received oral and written instructions to follow a low carbohydrate diet during three days before examinations, avoid strenuous exercise within a day of examination, and to fast for 6 hrs before imaging. Patient compliance was not explicitly assessed. Blood glucose (BG) levels were measured before each tracer injection using reagent strips (Life Scan, Johnson & Johnson Company, USA), with manufacturer’s recommended controls.
Average net dose injected was 12.2mCi FDG (SD, 1.3, range 9.6 to 14.8), (451 MBq; SD 46, range 355 to 548). Dose remaining in syringe was subtracted; no adjustment was made for any extravasation. No gross extravasation was visually evident on images. During the uptake period, patients were semi-recumbent, and provided with warmed blankets if desired; Oral hydration was encouraged. Initiation of scanning although targeted for a 90 minutes uptake period after injection was initiated when the instrument became available in a busy clinical schedule, regardless of any delays.
Patients were scanned on the same Biograph PET system (Siemens Medical Solutions USA) or on a Discovery VCT PET/CT system (GE Medical Systems), except once when the original instrument was not available. Manual clock synchronization was used to correct for physical decay for uptake calculations. Each patient was scanned according to weight, for 2–5 min in each of 6–7 bed positions, from the base of skull through mid-thighs.
Acquisition conditions of the PET scanners were similar: field of view, 70 cm; matrix size, 128×128; slice thickness, 3.3 mm; acquisition time, 21–24 min; reconstruction method, iterative HD view point 20/2 iteration/subset), with # 7 Gaussian smoothing filter. Display and analysis was on manufacturers’ dedicated workstations. The Discovery VCT included a 64-slice CT scanner using; row -0-vertex, rotation time (s/rot) 0.5, slice thickness (mm) 3.75, field of view 50–70 mm, tube voltage 120KV and tube electric current 110–120 mA, with 64-slice acquisition technology. The Biograph acquisition technology was similar except using single slice CT technology. No enteric or intravenous contrast material was administered. Image acquisition was during quiet normal breathing. PET images were reconstructed using manufacturer’s compensation for random coincidences, scattered radiation and with CT-based attenuation correction.
Image Interpretation and Measurements
Images complied with Digital Imaging and Communication in Medicine (DICOM) format.25 Transverse images with a slice thickness of 3.3 mm were reconstructed in multiple tomoplane projections with variable window, level, PET-CT fusion control and with 3D maximum intensity projection (MIP) PET renditions. All images for each patient were analyzed at a single sitting by a single nuclear medicine physician (CGB). Image processing software was ADW 4.2 for the Discovery VCT and Leonardo for the Biograph. For selection of tumor volume, either three adjacent high activity planes (17 patients) or a loosely fitting volume of interest (VOI) was manually positioned after examination in multiple projections. SUVs were calculated using the maximum voxel (SUVmax) and the average voxel (SUVmean) within the ROI drawn around each tumor using 42% or more of the maximum voxel as the sampled volume with visual exclusion of non-tumor structures (For SUV formulas, see Appendix E – I online). Additional analyses included effect of normalization for body surface area (BSA)26, lean body mass (LBM)26 and for cerebellum and liver reference tissue. For cerebellum, SUVs were measured centered on an axial plane with highest radioactivity; for the normal liver parenchyma; SUVs were measured in the right lobe at the level of the right portal vein. All available original data entries were included in analyses.
Statistical Analyses
The difference for a continuous variable measured at two separate examinations was evaluated by the Wilcoxon signed-rank test. The correlation between two measurements was calculated by Spearman correlation coefficient. SUV data did not meet the normality assumption; log-transformation was taken.27 Intraclass correlation coefficient (ICC) was used to assess test-retest reproducibility. Analysis-of-variance estimator was used for estimating ICC and its 95% confidence interval was calculated by F-statistics with correlation characterized as poor, 0 ≤ ICC < 0.4; fair to good, 0.4 ≤ ICC < 0.75; excellent, 0.75 ≤ ICC ≤ 1.28
The percentage of relative difference between the repeated SUV measurements (defined by RDi = 100 × (Yi2 − Yi1)/Yi1) was plotted where Yi1 is baseline measurement andYi2 is second measurement. The limits of agreement were calculated by and these were used for threshold for relative difference of SUV measurements, where is average of RD and SE(RD) is standard error of RD.29 Statistical analysis was carried out using SAS 9.2 (SAS Inc., Cary, NC) and MATLAB® (MathWorks, Natick, MA).
Results
Table 1 summarizes patient characteristics. Table 2 shows weight and BG; the median difference in patient weight between the scans was 0 kg (range, −2 to 2.5 kg; p-value = 0.87). The median difference in BG concentrations was 3 mg/dL (range, −16 to 72 mg/dL; p-value = 0.08).
Table 2.
Weight, blood glucose level and uptake period for baseline and follow up scans.
| S. No. | Scan 1 | Scan 2 | ||||
|---|---|---|---|---|---|---|
|
| ||||||
| Weight (Kg) | BG | Time1 | Weight (Kg) | BG | Time1 | |
| 1 | 107.7 | 100 | 145 | 107.3 | 101 | 116 |
| 2 | 69.1 | 91 | 116 | 68.2 | 94 | 142 |
| 3 | 70.2 | 91 | 74 | 70.5 | 99 | 123 |
| 4 | 57 | 90 | 85 | 57 | 89 | 123 |
| 5 | 81.1 | 100 | 140 | 79.1 | 110 | 87 |
| 6 | 105.9 | 104 | 85 | 108.4 | 103 | 93 |
| 7 | 82.1 | 90 | 190 | 82.5 | 122 | 110 |
| 8 | 53.4 | 95 | 131 | 53.4 | 124 | 75 |
| 9 | 96.4 | 86 | 88 | 97.3 | 101 | 136 |
| 10 | 46.4 | 74 | 101 | 46.8 | 106 | 127 |
| 11 | 78.1 | 117 | 63 | 79.6 | 109 | 94 |
| 12 | 63.2 | 80 | 96 | 63.6 | 88 | 154 |
| 13 | 85.7 | 89 | 105 | 85.2 | 73 | 134 |
| 14 | 73.7 | 98 | 153 | 73.7 | 100 | 157 |
| 15 | 58.2 | 111 | 127 | 57 | 99 | 108 |
| 16 | 75.2 | 81 | 79 | 74 | 88 | 92 |
| 17 | 51.9 | 109 | 84 | 51 | 108 | 115 |
| 18 | 71.5 | 99 | 75 | 72.5 | 171 | 72 |
| 19 | 67.9 | 75 | 111 | 67 | 78 | 72 |
| 20 | 74 | 94 | 102 | 73.3 | 78 | 90 |
| 21 | 69.5 | 81 | 93 | 70.9 | 85 | 137 |
Time in minutes between injection and initiation of scan. BG, Blood glucose in mg/dL.
The tracer uptake period was 106 ± 30 min for the baseline examination and 113 ± 26 min for the follow up (Table 2), with a distribution of uptake periods corresponding to SUVmax as shown in Figure 1.
Figure 1.

Effect of uptake period on SUVmax
Correlation analyses, shown in Figure 2 disclosed no dependence of log SUVmax or log SUVmean upon the difference in uptake period: The absolute difference in SUVs (raw data and after taking log-transformation) was independent of the absolute difference in uptake period (raw data; r = 0.034 with p-value = 0.794 and −0.136 with p-value = 0.292; after log-transformation; r = −0.01 with p-value = 0.936 and −0.126 with p-value = 0.329 for SUVmax and SUVmean, respectively). Among all patients, the range of SUVmax and SUVmean were 1.07–21.47 and 0.91–14.69, respectively.
Figure 2.
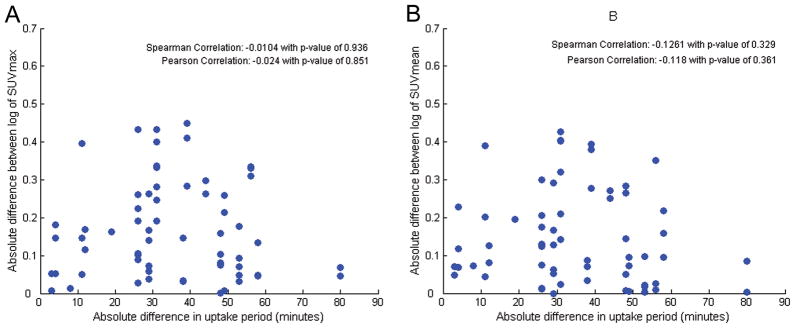
Correlation of uptake period with (A) Log SUVmax and (B) log SUVmean
The difference in each of SUV measure was not normally distributed (both p-values are less than 0.005) and the difference in SUV values increased with their average on a Bland-Altman plot (Figure 3A and 3B). However, the difference between log of the values was normally distributed for both of SUVs (p-value > 0.25 for SUVmax and p-value = 0.10 for SUVmean). The Spearman correlation coefficient (r) between SUVmax and SUVmean determined on the two separate occasions was 0.933 (p-value < 0.001) and 0.925 (p-value < 0.001), respectively. ICC between log of SUVmax and log of SUVmean was 0.926 (95% CI, 0.880 – 0.954) and 0.920 (95% CI, 0.871 – 0.951), respectively (Figure 3C and 3D). Thus, both log measures showed “excellent” test-retest reproducibility according to a statistical benchmark definition applied to ICC.30 The median of difference for SUVmax and SUVmean were −0.22 (range, −4.40 – 7.77; p-value = 0.69) and −0.08 (range, −2.45 – 4.79; p-value = 0.09).
Figure 3.

Bland-Altman plots for (A) SUVmax and (B) SUVmean and reproducibility between two scans for (C) SUVmax and (D) SUVmean
To address the question of threshold criteria for a difference from baseline SUV measurement, Bland-Altman plots on which the relative difference between two SUVmax and SUVmean are plotted against average of two measurements. The threshold criteria for a difference from baseline for the 95% confidence interval were ± 49% or ± 44% for SUVmax or SUVmean respectively (Figure 4).
Figure 4.

The relative difference between two scans; (A) SUVmax, (B) SUVmean, (C) SUVmax, normalized to cerebellum, and (D) SUVmean, normalized to cerebellum against their average
The possibility to reduce noise of avidity measurements by normalization to normal liver or cerebellum was evaluated. Correlations of tumor SUV’s with cerebellar and liver SUVs are depicted in Figure 4. SUVs normalized to cerebellar SUV were highly correlated (r = 0.903 with p < 0.001 and 0.922 with p < 0.001 for SUVmax and SUVmean, respectively). For log of SUVs normalized to cerebellar SUV (ICC, 0.924 with 95% CI, 0.877 – 0.953 and 0.927 with 95% CI, 0.882 – 0.955 for SUVmax and SUVmean, respectively) the reproducibility was excellent. The Bland-Altman plot showed agreement for log of SUVmax (median difference, −0.01; range, −0.48 – 0.40; p-value = 0.186) and for SUVmean (median difference, −0.01; range, −0.52 – 0.35; p-value = 0.134). SUV values normalized to liver SUV showed excellent correlation (r = 0.913 and 0.910 for SUVmax and SUVmean, respectively; all p-values < 0.001), and correlation of log of SUVmax normalized to liver SUV showed excellent reproducibility (ICC, 0.921; 95% CI, 0.872–952). However, ICC for log of SUVmean normalized to liver SUV was not excellent (ICC, 0.702; 95% CI, 0.551 – 0.809). Thus, normalization to liver and cerebellum activity correlations did not suggest an independent potential approach to reducing variance. The limitations of normalization to liver or cerebellum may be due to biological limitations. Since SUV’s in normal tissue are neither stable, nor consistently related to tumor uptake with time10,31, variations in the uptake period in the current series could overwhelm any potential value of normalization. More consistent protocol compliance might show value of normalization.32
We found no correlation in BG change or elevation and change in SUV (Figure 5). Normalization for LBM and BSA, as expected, did not reduce variance over the short interval of this work (data not shown), but could be important in longitudinal studies.
Figure 5.
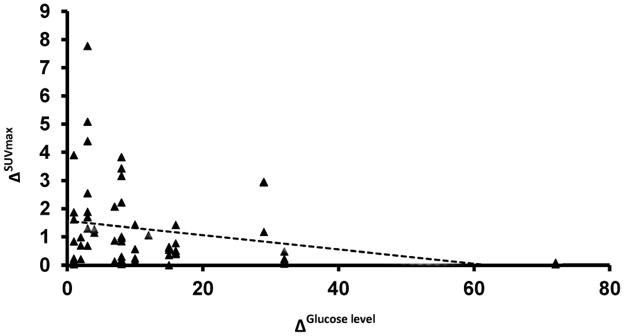
The Relative difference in SUVmax compared to Blood Glucose level mg/dL
Discussion
The potential value of quantitation in PET imaging is highest if the measurement variance is small. The current work addresses the clinical effectiveness of SUV measurement, compared with the benchmark for variance based on stringent efficacy trials and recommended by experts.
Wahl and expert collaborators14 propose for the PERCIST 1.0 standard that includes preliminary significance threshold recommendation for interpretation of differences in avidity indices. Although some stringent efficacy trials showed mean reproducibility within 10% – 20%15,18,33, they suggested a threshold of 30% for a significant avidity index difference. For this recommendation, they considered not only efficacy trial results but variations in technology and their clinical experience. They also recommended technical refinements to reduce effects of pixel noise, reproduction of uptake periods within 15 minutes and other refinements. Software to fully implement the suggestions of the Wahl group is not widely available. In our series, using manufacturer’s equipment performance calibration, and widely available commercial software and our actual routine clinical practices, the threshold for a significance difference appears closer to 50%.
Several possible causes of noise in the measurements warrant discussion. Deviation from targeted uptake times is a well-known cause of variation in avidity.18,20,34 FDG uptake in lung carcinoma, for example, does not plateau for several hours31,35,36, so variation in uptake period should cause variation in SUV. Weber recommends repeating uptake periods within 10 minutes, cautioning that “…in clinical practice this requires careful planning of the time of FDG injection and start of scanning”.37 Interactive scheduling software and more flexible dispensing systems may improve compliance with uptake period targets, in addition to that achievable by greater emphasis on compliance. Automated calculation and reporting of uptake periods could also be incorporated into equipment software. However, the present study could not show a correlation between our considerable uptake period deviations and measurement variation, when evaluated over the full range of data. We therefore suspect additional sources of measurement noise.
Variance and bias in SUV measurements may also be due to instrument performance changes, execution and interpretation of the examination or biological change in the patient.
Although equipment performance can be verified by measures similar to ours,38 further improvement is possible at minimal cost.39 Multicenter standardization efforts may open approaches to improvement, intra- and inter-institution.11,40–44
About eight technical steps entail risk of error (Personal communication, C Kuykendall, CNMT 2011): Performance and recording of dose calibration, clock synchronization, accounting for tracer not available for uptake, several scanners set up steps, weight recording, and patient identification are among potentially significant sources of variation. Application of well-established quality improvement technology may minimize opportunity for technical error: technical performance of PET/CT resembles that of other industrial processes for which a recent RSNA initiative formulates process improvements adapted for imaging departments.44–46
Automation by improvements through interoperability software may eliminate manual data transfer; improved operator interfaces may simplify technical processes and reduce error. Improved training, cross-training, continued sharing of performance measures, and management support for the process are among the key elements of the methodology.
For biological standardization, fasting diet is recommended in standard FDG-PET/CT guidelines.24,47 Diet compliance is difficult to evaluate. BG was sometimes is elevated in our population; a suggestion excluding patients with BG ≥ 7 mmol/l (or >120 mg/dl)47 would have excluding three of our patients. Any criteria that exclude patients from testing should be carefully justified; however, improved patient preparation education would pose little burden.
Although the SUVmax is more subject to noise compared to SUVmean, SUVmax and SUVmean showed minimal difference in variance in our results. Although there are sound reasons to consider other variations of uptake measurement14,48, we confined our analyses to measurements supported by readily available software.
Variance is important not only in individual patient measurements, but in clinical trial design, as a component of total noise effect on the power of clinical trials.22,49: underestimation of variance may lead to underpowered clinical trials, obscuring important effects.
These results emphasize that other tumor markers including anatomic measurements from CT, despite limitations as an indicator of cancer biology, remain useful.50–52 Anatomic measures should be continued as a reference standard for longitudinal studies.
Costs, including patient convenience, radiation exposure, and other costs discourage repeat of recent PET/CT examinations solely to establish a base line for serial comparisons, even when baseline studies and longitudinal studies are from different institutions. A phantom examination evaluation of variability in PET quantization within a multicenter consortium53 showed SUV variability of 10–25%. Large-scale efforts are underway to harmonize technology.11,40 Meanwhile, caution is warranted in interpretation of quantitative changes in PET avidity for clinical decisions even from a single institution.54
The distinction55 between questions of efficacy (“Can intervention work in the ideal study setting?”), and effectiveness (“Does it work, generalized to real-world settings and applied to individual patients?”), parallels discussions of generalization of trial results, “external validity”, (suitability of translating clinical procedures established in stringent trials to widespread clinical practice use).56,57 The present work emphasizes that interpretive criteria derived from efficacy studies may not be applicable to effectiveness studies.
Limitations
In common with all earlier publications in this field, the tumor spectrum and relatively small numbers of patients and cancers investigated limit extrapolation of the current results. Different cancers, even within the same cell type may differ in optimum imaging times under clinical conditions, and variance and optimal uptake periods may differ.58 Data from the longer uptake periods employed is not directly applicable for the more generally used target of 60 minutes.41 Technical staff was not blinded to the nature of the research. Use of a single, highly experienced observer reflects an actual clinical practice, but the result could differ for other observers.
Baseline test-retest data do not necessarily predict variance in serial studies. For longitudinal studies, partial volume effects59, tumor heterogeneity, tumor size effects and, spill over from adjacent structures, may change, and further contribute to bias and variance. Normalization to lean body mass could be important during the course of serial examinations. Important factors may include cell type, tumor avidity and size, other phenotypic information, treatment effectiveness, alternatives available and clinical judgment.60 Indices of dose extravasation, and other factitious redistribution should be validated.
Variance other than at baseline must be studied to refine interpretive criteria. While refined criteria for significant change may improve FDG-PET quantitation, the value of the technology ultimately depends on additional research to show correlation with clinical outcomes.
Conclusion
Test-retest measurements of SUV from FDG PET baseline examinations under clinical conditions suggest thresholds for agreement approaching 50%, using a relative difference approach, for a high level of confidence. Although methods and expressions of criteria differ, this threshold is higher than expert recommendations derived from stringent efficacy trials, although actual trial conditions are often not fully described.
We conclude: (1) the interpretation of SUV results in individual patients, and planning for clinical trials, should consider the variance expected under the actual imaging conditions, not necessarily equivalent to those of stringent efficacy trials. (2) Clinical practice of PET/CT should strive to more approach the benchmarks set by stringent trials. (3) Future effectiveness research under clinical conditions should include test-retest examinations in larger trials, different populations, and with careful documentation of protocols used, protocol compliance, and analyses of effects of deviations.
Acknowledgments
We thank our patients and their care-givers for their contributions to this research. We thank our technical staff including W Rotondi, CNMT, C Kuykendall, CNMT and M Cochran, MSPH for research management. Research was partially supported by NIH grants U01-CA143062-01 and R01-CA125627, Bristol-Myers Squibb, and the Image Response Assessment Shared Service of the Moffitt Cancer Center.
Funding: Research was partially supported by NIH grants U01-CA143062-01 and R01-CA125627, Bristol-Myers Squibb, and the Image Response Assessment Shared Service of the Moffitt Cancer Center.
Footnotes
Conflicts of Interest: None
Conflict of Interest Statement: The authors state no conflict of interest.
Statement of Authorship
The manuscript has been seen and approved for submission to the journal by all authors.
Author Contributions:
Virendra Kumar: Data analysis and interpretation, manuscript writing.
Kavindra Nath: Data analysis and interpretation, manuscript writing.
Claudia Berman: Study conception and design, acquisition and analysis of data.
Jongphil Kim: Data analysis and interpretation, manuscript writing.
Tawee Tanvetyanon: Study conception and design, acquisition and analysis of data.
Alberto Chiappori: Study conception and design, acquisition and analysis of data.
Robert A Gatenby: Study conception and design, analysis and interpretation and manuscript writing.
Robert J. Gillies: Study conception and design, analysis and interpretation and manuscript writing.
Edward A Eikman: Study conception and design, analysis and interpretation and manuscript writing.
References
- 1.Shields AF. Positron emission tomography measurement of tumor metabolism and growth: its expanding role in oncology. Mol Imaging Biol. 2006;8:141–150. doi: 10.1007/s11307-006-0039-2. [DOI] [PubMed] [Google Scholar]
- 2.Som P, Atkins HL, Bandoypadhyay D, et al. A fluorinated glucose analog, 2-fluoro-2-deoxy-D-glucose (F-18): nontoxic tracer for rapid tumor detection. J Nucl Med. 1980;21:670–675. [PubMed] [Google Scholar]
- 3.Mawlawi O, Townsend DW. Multimodality imaging: an update on PET/CT technology. Eur J Nucl Med Mol Imaging. 2009;36 (Suppl 1):S15–29. doi: 10.1007/s00259-008-1016-6. [DOI] [PubMed] [Google Scholar]
- 4.Blodgett TM, Meltzer CC, Townsend DW. PET/CT: form and function. Radiology. 2007;242:360–385. doi: 10.1148/radiol.2422051113. [DOI] [PubMed] [Google Scholar]
- 5.CMS. https://www.cms.gov/Reimbursement/
- 6.Warburg O. Metabolism of Tumors. London: Arnold Constable; 1930. [Google Scholar]
- 7.Coleman RE. Is quantitation necessary for oncological PET studies? For Eur J Nucl Med Mol Imaging. 2002;29:133–135. doi: 10.1007/s00259-001-0679-z. [DOI] [PubMed] [Google Scholar]
- 8.Shankar LK, Hoffman JM, Bacharach S, et al. Consensus recommendations for the use of 18F-FDG PET as an indicator of therapeutic response in patients in National Cancer Institute Trials. J Nucl Med. 2006;47:1059–1066. [PubMed] [Google Scholar]
- 9.Lammertsma AA, Hoekstra CJ, Giaccone G, et al. How should we analyse FDG PET studies for monitoring tumour response? Eur J Nucl Med Mol Imaging. 2006;33 (Suppl 1):16–21. doi: 10.1007/s00259-006-0131-5. [DOI] [PubMed] [Google Scholar]
- 10.Wahl RL, Zasadny K, Helvie M, et al. Metabolic monitoring of breast cancer chemohormonotherapy using positron emission tomography: initial evaluation. J Clin Oncol. 1993;11:2101–2111. doi: 10.1200/JCO.1993.11.11.2101. [DOI] [PubMed] [Google Scholar]
- 11.Sullivan DC. Imaging as a quantitative science. Radiology. 2008;248:328–332. doi: 10.1148/radiol.2482080242. [DOI] [PubMed] [Google Scholar]
- 12.Atkinson AJ, Colburn WA, DeGruttola VG, et al. Biomarkers and surrogate endpoints: preferred definitions and conceptual framework. Clinical pharmacology and therapeutics. 2001;69:89–95. doi: 10.1067/mcp.2001.113989. [DOI] [PubMed] [Google Scholar]
- 13.Kelloff GJ, Sigman CC. New science-based endpoints to accelerate oncology drug development. Eur J Cancer. 2005;41:491–501. doi: 10.1016/j.ejca.2004.12.006. [DOI] [PubMed] [Google Scholar]
- 14.Wahl RL, Jacene H, Kasamon Y, et al. From RECIST to PERCIST: Evolving Considerations for PET response criteria in solid tumors. J Nucl Med. 2009;50 (Suppl 1):122S–150S. doi: 10.2967/jnumed.108.057307. [DOI] [PMC free article] [PubMed] [Google Scholar]
- 15.Weber WA, Ziegler SI, Thodtmann R, et al. Reproducibility of metabolic measurements in malignant tumors using FDG PET. J Nucl Med. 1999;40:1771–1777. [PubMed] [Google Scholar]
- 16.Nakamoto Y, Zasadny KR, Minn H, et al. Reproducibility of common semi-quantitative parameters for evaluating lung cancer glucose metabolism with positron emission tomography using 2-deoxy-2-[18F]fluoro-D-glucose. Mol Imaging Biol. 2002;4:171–178. doi: 10.1016/s1536-1632(01)00004-x. [DOI] [PubMed] [Google Scholar]
- 17.Krak NC, Boellaard R, Hoekstra OS, et al. Effects of ROI definition and reconstruction method on quantitative outcome and applicability in a response monitoring trial. Eur J Nucl Med Mol Imaging. 2005;32:294–301. doi: 10.1007/s00259-004-1566-1. [DOI] [PubMed] [Google Scholar]
- 18.Nahmias C, Wahl LM. Reproducibility of standardized uptake value measurements determined by 18F-FDG PET in malignant tumors. J Nucl Med. 2008;49:1804–1808. doi: 10.2967/jnumed.108.054239. [DOI] [PubMed] [Google Scholar]
- 19.Young H, Baum R, Cremerius U, et al. Measurement of clinical and subclinical tumour response using [18F]-fluorodeoxyglucose and positron emission tomography: review and 1999 EORTC recommendations. European Organization for Research and Treatment of Cancer (EORTC) PET Study Group. Eur J Cancer. 1999;35:1773–1782. doi: 10.1016/s0959-8049(99)00229-4. [DOI] [PubMed] [Google Scholar]
- 20.Velasquez LM, Boellaard R, Kollia G, et al. Repeatability of 18F-FDG PET in a multicenter phase I study of patients with advanced gastrointestinal malignancies. J Nucl Med. 2009;50:1646–1654. doi: 10.2967/jnumed.109.063347. [DOI] [PubMed] [Google Scholar]
- 21.Frings V, de Langen AJ, Smit EF, et al. Repeatability of metabolically active volume measurements with 18F-FDG and 18F-FLT PET in non-small cell lung cancer. J Nucl Med. 2010;51:1870–1877. doi: 10.2967/jnumed.110.077255. [DOI] [PubMed] [Google Scholar]
- 22.Kinahan PE, Doot RK, Wanner-Roybal M, et al. PET/CT Assessment of Response to Therapy: Tumor Change Measurement, Truth Data, and Error. Transl Oncol. 2009;2:223–230. doi: 10.1593/tlo.09223. [DOI] [PMC free article] [PubMed] [Google Scholar]
- 23.Meyer CR, Armato SG, Fenimore CP, et al. Quantitative imaging to assess tumor response to therapy: common themes of measurement, truth data, and error sources. Transl Oncol. 2009;2:198–210. doi: 10.1593/tlo.09208. [DOI] [PMC free article] [PubMed] [Google Scholar]
- 24.Delbeke D, Coleman RE, Guiberteau MJ, et al. Procedure guideline for tumor imaging with 18F-FDG PET/CT 1.0. 2006. [PubMed] [Google Scholar]
- 25.NEMA. http://dicom.nema.org/
- 26.Du Bois D, Du Bois EF. A formula to estimate the approximate surface area if height and weight be known. 1916. Nutrition. 1989;5:303–311. discussion 312–303. [PubMed] [Google Scholar]
- 27.Thie JA, Hubner KF, Smith GT. The diagnostic utility of the lognormal behavior of PET standardized uptake values in tumors. J Nucl Med. 2000;41:1664–1672. [PubMed] [Google Scholar]
- 28.Rosner B. Fundamentals of Biostatistics. Belmont CA: Thomson-Brooks/Cole; 2006. [Google Scholar]
- 29.Zhao B, James LP, Moskowitz CS, et al. Evaluating variability in tumor measurements from same-day repeat CT scans of patients with non-small cell lung cancer. Radiology. 2009;252:263–272. doi: 10.1148/radiol.2522081593. [DOI] [PMC free article] [PubMed] [Google Scholar]
- 30.Fleiss JL. The design and analysis of clinical experiments. New York: Wiley; 1986. [Google Scholar]
- 31.Hamberg LM, Hunter GJ, Alpert NM, et al. The dose uptake ratio as an index of glucose metabolism: useful parameter or oversimplification? J Nucl Med. 1994;35:1308–1312. [PubMed] [Google Scholar]
- 32.Britz-Cunningham SH, Millstine JW, Gerbaudo VH. Improved discrimination of benign and malignant lesions on FDG PET/CT, using comparative activity ratios to brain, basal ganglia, or cerebellum. Clin Nucl Med. 2008;33:681–687. doi: 10.1097/RLU.0b013e318184b435. [DOI] [PubMed] [Google Scholar]
- 33.Minn H, Zasadny KR, Quint LE, et al. Lung cancer: reproducibility of quantitative measurements for evaluating 2-[F-18]-fluoro-2-deoxy-D-glucose uptake at PET. Radiology. 1995;196:167–173. doi: 10.1148/radiology.196.1.7784562. [DOI] [PubMed] [Google Scholar]
- 34.Paquet N, Albert A, Foidart J, et al. Within-patient variability of (18)F-FDG: standardized uptake values in normal tissues. J Nucl Med. 2004;45:784–788. [PubMed] [Google Scholar]
- 35.Lowe VJ, DeLong DM, Hoffman JM, et al. Optimum scanning protocol for FDG-PET evaluation of pulmonary malignancy. J Nucl Med. 1995;36:883–887. [PubMed] [Google Scholar]
- 36.Calvo R, Marti-Climent JM, Richter JA, et al. Three-dimensional clinical PET in lung cancer: validation and practical strategies. J Nucl Med. 2000;41:439–448. [PubMed] [Google Scholar]
- 37.Weber WA. Quantitative analysis of PET studies. Radiother Oncol. 2010;96:308–310. doi: 10.1016/j.radonc.2010.07.004. [DOI] [PubMed] [Google Scholar]
- 38.Doot RK, Scheuermann JS, Christian PE, et al. Instrumentation factors affecting variance and bias of quantifying tracer uptake with PET/CT. Med Phys. 2010;37:6035–6046. doi: 10.1118/1.3499298. [DOI] [PMC free article] [PubMed] [Google Scholar]
- 39.Lockhart CM, MacDonald LR, Alessio AM, et al. Quantifying and reducing the effect of calibration error on variability of PET/CT standardized uptake value measurements. J Nucl Med. 2011;52:218–224. doi: 10.2967/jnumed.110.083865. [DOI] [PMC free article] [PubMed] [Google Scholar]
- 40.Clarke LP, Croft BS, Nordstrom R, et al. Quantitative imaging for evaluation of response to cancer therapy. Transl Oncol. 2009;2:195–197. doi: 10.1593/tlo.09217. [DOI] [PMC free article] [PubMed] [Google Scholar]
- 41.Boellaard R, Oyen WJ, Hoekstra CJ, et al. The Netherlands protocol for standardisation and quantification of FDG whole body PET studies in multi-centre trials. Eur J Nucl Med Mol Imaging. 2008;35:2320–2333. doi: 10.1007/s00259-008-0874-2. [DOI] [PubMed] [Google Scholar]
- 42.Beaulieu S, Kinahan P, Tseng J, et al. SUV varies with time after injection in (18)F-FDG PET of breast cancer: characterization and method to adjust for time differences. J Nucl Med. 2003;44:1044–1050. [PubMed] [Google Scholar]
- 43.Beyer T, Czernin J, Freudenberg LS. Variations in clinical PET/CT operations: results of an international survey of active PET/CT users. J Nucl Med. 2011;52:303–310. doi: 10.2967/jnumed.110.079624. [DOI] [PubMed] [Google Scholar]
- 44. [Accessed July 18, 2011.];RSNA. http://www.rsna.org/quality/index.cfm.
- 45.Deming WE. Out of the Crisis. MIT press; 2000. [Google Scholar]
- 46.Pronovost PJ, Goeschel CA. Time to take health delivery research seriously. JAMA. 2011;306:310–311. doi: 10.1001/jama.2011.1015. [DOI] [PubMed] [Google Scholar]
- 47.Boellaard R, O’Doherty MJ, Weber WA, et al. FDG PET and PET/CT: EANM procedure guidelines for tumour PET imaging: version 1. 0. Eur J Nucl Med Mol Imaging. 2010;37:181–200. doi: 10.1007/s00259-009-1297-4. [DOI] [PMC free article] [PubMed] [Google Scholar]
- 48.Necib H, Garcia C, Wagner A, et al. Detection and characterization of tumor changes in 18F-FDG PET patient monitoring using parametric imaging. J Nucl Med. 2011;52:354–361. doi: 10.2967/jnumed.110.080150. [DOI] [PubMed] [Google Scholar]
- 49.Doot R, Kurland B, Kinahan P, et al. Considerations for using PET as a response measure in multicenter clinical trials. 2009. Soc Nuclear Med. :537. doi: 10.1016/j.acra.2011.10.008. [DOI] [PMC free article] [PubMed] [Google Scholar]
- 50.Tanvetyanon T, Eikman EA, Sommers E, et al. Computed tomography response, but not positron emission tomography scan response, predicts survival after neoadjuvant chemotherapy for resectable non-small-cell lung cancer. J Clin Oncol. 2008;26:4610–4616. doi: 10.1200/JCO.2008.16.9383. [DOI] [PubMed] [Google Scholar]
- 51.Tanvetyanon T, Eikman EA, Bepler G. In Reply. J Clin Oncol. 2009;27:832. [Google Scholar]
- 52.Birchard KR, Hoang JK, Herndon JE, Jr, et al. Early changes in tumor size in patients treated for advanced stage nonsmall cell lung cancer do not correlate with survival. Cancer. 2009;115:581–586. doi: 10.1002/cncr.24060. [DOI] [PubMed] [Google Scholar]
- 53.Fahey FH, Kinahan PE, Doot RK, et al. Variability in PET quantitation within a multicenter consortium. Med Phys. 2010;37:3660–3666. doi: 10.1118/1.3455705. [DOI] [PMC free article] [PubMed] [Google Scholar]
- 54.Patz EF., Jr Does computed tomography or positron emission tomography response after neoadjuvant chemotherapy for resectable non-small-cell lung cancer predict survival? J Clin Oncol. 2008;26:4542–4543. doi: 10.1200/JCO.2008.18.2147. [DOI] [PubMed] [Google Scholar]
- 55.Djulbegovic B, Paul A. From efficacy to effectiveness in the face of uncertainty: indication creep and prevention creep. JAMA. 2011;305:2005–2006. doi: 10.1001/jama.2011.650. [DOI] [PubMed] [Google Scholar]
- 56.Sox HC, Greenfield S. Comparative effectiveness research: a report from the Institute of Medicine. Ann Intern Med. 2009;151:203–205. doi: 10.7326/0003-4819-151-3-200908040-00125. [DOI] [PubMed] [Google Scholar]
- 57.Steckler A, McLeroy KR. The importance of external validity. Am J Public Health. 2008;98:9–10. doi: 10.2105/AJPH.2007.126847. [DOI] [PMC free article] [PubMed] [Google Scholar]
- 58.Lodge MA, Lucas JD, Marsden PK, et al. A PET study of 18FDG uptake in soft tissue masses. Eur J Nucl Med. 1999;26:22–30. doi: 10.1007/s002590050355. [DOI] [PubMed] [Google Scholar]
- 59.Geworski L, Knoop BO, de Cabrejas ML, et al. Recovery correction for quantitation in emission tomography: a feasibility study. Eur J Nucl Med. 2000;27:161–169. doi: 10.1007/s002590050022. [DOI] [PubMed] [Google Scholar]
- 60.Weber WA. Assessing tumor response to therapy. J Nucl Med. 2009;50 (Suppl 1):1S–10S. doi: 10.2967/jnumed.108.057174. [DOI] [PubMed] [Google Scholar]