Abstract
A laser-driven electron-storage ring can produce nearly monochromatic, tunable X-rays in the keV energy regime by inverse Compton scattering. The small footprint, relative low cost and excellent beam quality provide the prospect for valuable preclinical use in radiography and tomography. The monochromaticity of the beam prevents beam hardening effects that are a serious problem in quantitative determination of absorption coefficients. These values are important e.g. for osteoporosis risk assessment. Here, we report quantitative computed tomography (CT) measurements using a laser-driven compact electron-storage ring X-ray source. The experimental results obtained for quantitative CT measurements on mass absorption coefficients in a phantom sample are compared to results from a rotating anode X-ray tube generator at various peak voltages. The findings confirm that a laser-driven electron-storage ring X-ray source can indeed yield much higher CT image quality, particularly if quantitative aspects of computed tomographic imaging are considered.
Since Conrad Röntgen produced the first radiograph of his wife's hand in December 1895, X-ray imaging has developed into an indispensable tool for medical diagnostics. Nevertheless the basic physical concept of X-ray sources, which are used in commercial applications, has not changed since the early time about one hundred years ago1. Electrons are emitted by a hot cathode and accelerated towards an anode. In the anode, the decelerated electrons produce a continuous spectrum of electromagnetic radiation, the so-called Bremsstrahlung. Superimposed are the characteristic X-rays of the anode material. Advantages of these sources for clinical use are their relative low cost, small footprint and relative high intensity if integrated over the whole spectrum.
However, X-rays at different energies within a broad energy spectrum show different absorption coefficients in a radiographic measurement2. Lower energetic photons are absorbed to a greater degree than the higher energetic ones. Hence the ratio of high-energy photons reaching the detector is enlarged with sample thickness. This so-called beam hardening effect manifests itself as a variation of the measured absorption coefficient dependent on the sample thickness. For inhomogeneous samples, this can also mean that the measured absorption coefficient in one part of the sample depends on the neighbouring material. Beam hardening effects particularly affect quantitative X-ray imaging applications, such as computed tomography, leading to severe image artefacts in the reconstructed tomograms. Medical CT images, for example, show streak artifacts in soft tissue behind material of high density like bones, teeth or metallic materials within a patient3. Moreover, the quantitative evaluation of CT image gray values, as for example in the assessment of bone density measurement in the context of osteoporosis risk assessments, is severely compromised by beam-hardening effects4.
Modern X-ray sources, like undulators at synchrotron facilities, can deliver high intensities in narrow energy bands, and avoid the above-mentioned issues. These sources are valuable for fundamental research, but a large-scale synchrotron has a footprint of some hundred square meters and costs of some hundred million dollars. Therefore any commercial, medical or lab-based X-ray imaging application is still based on conventional, polychromatic X-ray tube sources.
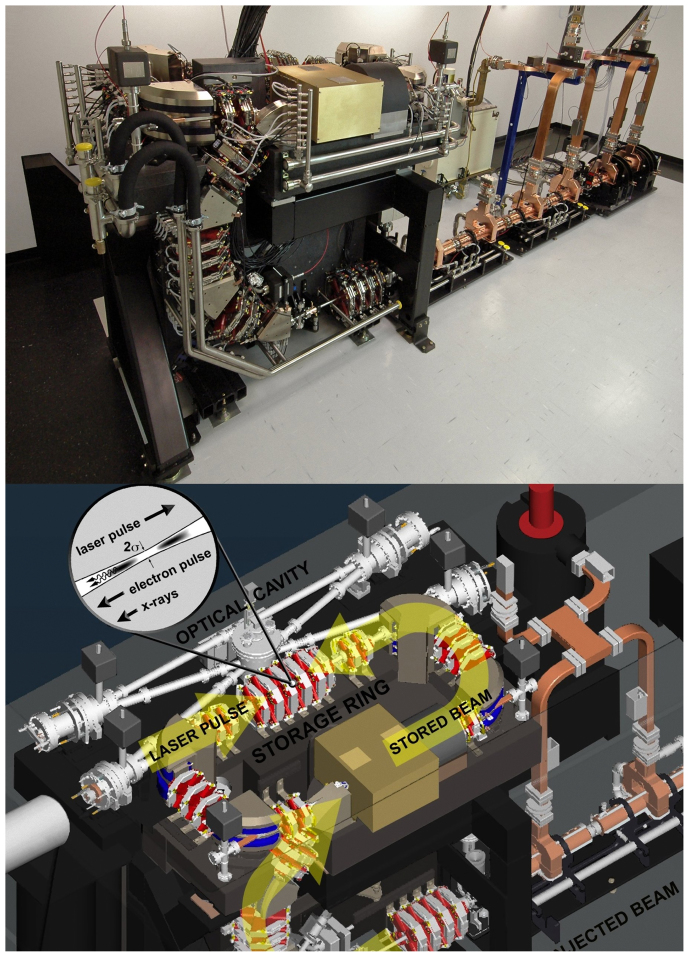
As an alternative, a new type of X-ray source, the so-called Compact Light Source (CLS), has recently been developed5,6. Fig. 1 shows a CAD drawing and a photograph of the CLS (Lyncean Technologies Inc., USA) used for the experiments described here. In contrast to conventional X-ray tube sources, the CLS intrinsically produces a narrow-band, nearly monochromatic and tunable X-ray spectrum. The CLS is a laser-driven X-ray source based on the Thomson backscattering of low-energy photons at high-energy electrons. Energy is transferred from the electrons to the photons which are boosted into the X-ray region. This process is also commonly known as “inverse Compton scattering”. A small electron storage ring with a circumference of less than five meter is filled with electron bunches at an energy of 25–45 MeV by a linear accelerator of about five meter length. The orbital frequency is 65 MHz. The electron bunches are focused to about 40 μm diameter (rms) in a spot where the counter propagating laser beam of a bow-tie, high-finesse laser cavity is also focused. The laser has a wavelength of about 1 μm. The electrons oscillate in the electromagnetic field of the laser light like in the undulator field of an insertion device at a synchrotron beamline. Due to the short period of this laser field, radiation in the keV energy regime is produced even by electrons of some MeV energy5,6,7,8. Note that in the synchrotron case an undulator with some centimeter field period needs electrons in the GeV regime to produce keV radiation. With a beam divergence of 4 mrad and an energy bandwidth of 3% in the energy range of 15–36 keV, the radiation is perfectly suitable for high- and medium-resolution radiographic and tomographic X-ray imaging applications.
Figure 1. Overview of the Compact Light Source (CLS).
Upper image: front view of the CLS showing the injector (on the right), the transport line (on the left) and the electron storage ring (at the top). The length of the CLS is about 5 m. Lower image: CAD drawing of the CLS with the electron storage ring and the optical cavity of the infrared laser system. The interaction point of the laser pulse and the electron pulse is emphasized.
Results
In this work we present quantitative CT measurements using such a laser-driven compact electron-storage ring X-ray source. The experimental results obtained on the CLS are compared to results from a rotating anode X-ray tube generator. The findings confirm that a laser-driven compact electron-storage ring X-ray source can indeed yield much higher CT image quality, particularly if the quantitativeness of CT applications are exploited.
The effective spectra given in Fig. 2 were calculated from the measured values of the linear absorption coefficient μ of the water phantom with an expectation maximization algorithm according to Sidky et al.9,10. In contrast to these authors, we used the continuous thickness variation of the cylindrical sample instead of discrete absorber thicknesses. The beam trajectory length through the water sample depends on the distance r from the center of the cylindrical sample holder of maximal radius rmax as d = 2·rmax·sin(arccos(r/rmax)). The effective spectra arise from the initial spectra emitted by the sources, e.g. the rotating molybdenum anode of the FR591 and the inverse Compton scattering for the CLS. These spectra are filtered by absorption in air, polypropylene and the water sample before detected by the PILATUS detector. For the FR591 a beryllium window was added in the beam path, for the CLS four kapton windows were added.
Figure 2. X-ray spectra for the experiment.
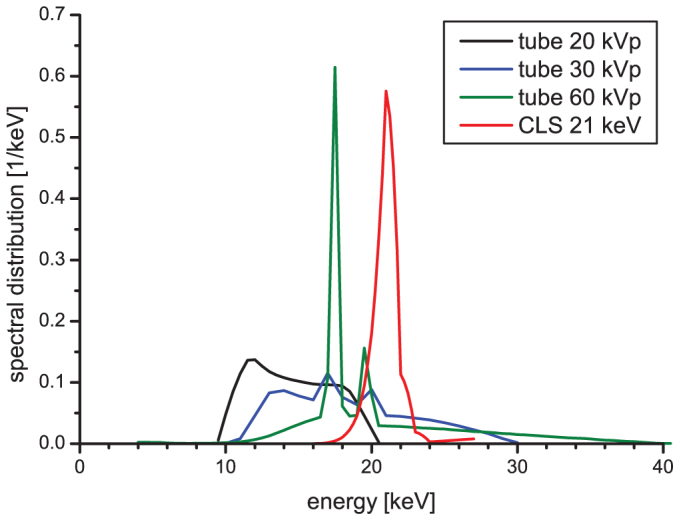
Black, blue and green lines: Spectra of the FR591 rotating anode X-ray tube at peak voltages of 20, 30 and 60 kVp calculated from the measured values of the linear absorption coefficient μ of the water phantom with an expectation maximization algorithm according to Sidky et al.9,10. Red line: Spectrum of the Compact Light Source at 21 keV calculated from the measured values of the linear absorption coefficient μ of the water phantom. For a measured spectrum of the CLS at 21 keV see Supplementary Fig. S1 online.
Fig. 3 shows the results of the tomographic reconstruction of the water sample as circular segments. Segments (a)–(c) are measured with polychromatic radiation of a molybdenum rotating anode X-ray source operated at 20, 30 and 60 kVp respectively. Segment (d) is measured with the monochromatic, inverse Compton scattered radiation of a compact electron-storage ring at 21 keV. The colorscales of all segments are scaled to the same span. The black area is due to the air around the sample holder. The dark blue seam in Fig. 3(a) for 20 kVp is the polypropylene container invisible at the other X-ray energies for this scaling. The three images (a)–(c) obtained with the polychromatic rotating anode X-ray source show the variation of the absorption contrast from the outer to the inner parts of the sample and the overall different values for different X-ray energies. In contrast the monochromatic measurement in (d) does not suffer from this effect.
Figure 3. Tomographic reconstruction of the water sample in a polypropylen container.
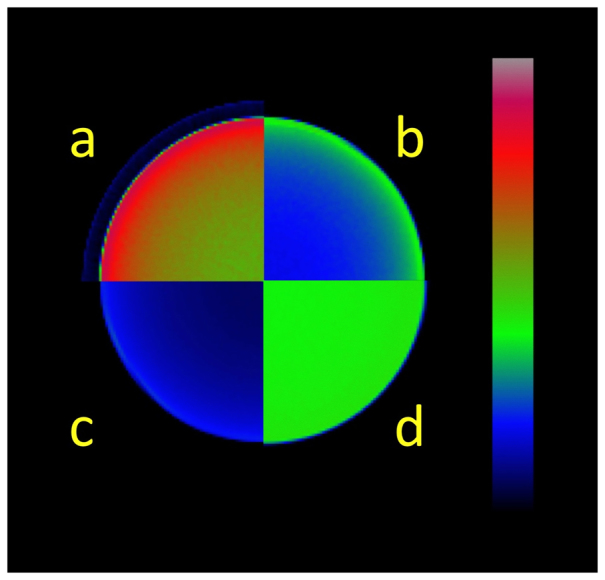
(a), (b), (c): measured with the FR591 rotating anode X-ray tube working at 20, 30 and 60 kVp, respectively. (d): measured with the compact light source at 21 keV. Color scales represent measured density times absorption coefficients (ρ · μ) at the used X-ray energy. The polypropylene container is barely seen in (a).
Discussion
The effective linear absorption coefficient of a polychromatic ray beam can be calculated as
with the effective spectrum S(E)11. Note that S(E) depends on the material penetrated by the X-rays and also on the efficiency of the detector. The artefact induced by this dependence on S(E) causes the higher absorption values at the border of the water sample seen in Fig. 3(a)–(c).
This is more clearly visible in histograms of the images of Fig. 3 shown in Fig. 4. Each histogram line shows three distinct regions. A very narrow peak at zero μ-value represents the air absorption coefficient. At higher values a distribution for the polypropylene coefficient follows. The broadest distribution at highest values represents the absorption coefficient for water. The monochromatic result (red line) gives an absorption coefficient for water independent of the position of the volume element inside the sample within a variation of only 4.7%. A very different situation is obtained by the polychromatic measurements (see a-c) in Fig. 3. The values of the histogram for water are distributed over 20, 26 and 30% for the measurements at 60, 30 and 20 kVp, respectively. The radial profile plots displayed in Fig. 5 show, that this variation is systematically dependent on the distance of a volume element from the center of the cylindrical sample.
Figure 4. Histograms of the tomographic images of Fig. 3.
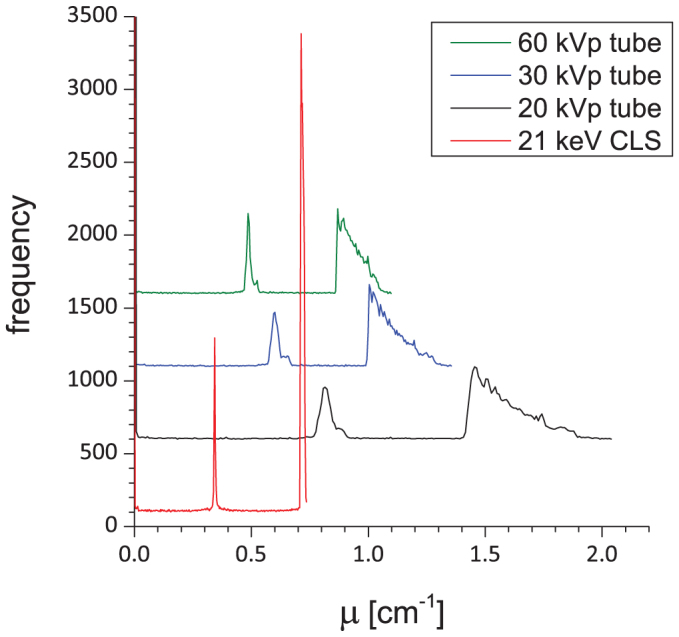
From top to bottom green, blue and black lines represent the frequency of absorption coefficients μ for the measurement with the X-ray tube at 60, 30 and 20 kVp. Red line gives the values for the measurement with the CLS at 21 keV. Histograms are shifted along the frequency axis, respectively, for clarity.
Figure 5. Radial profile plots.
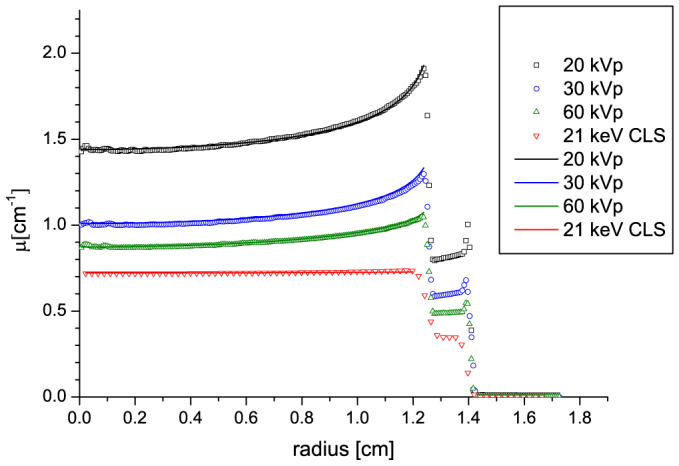
Symbols: radial profile plot of the tomographic data as shown in Fig. 3 from the center of the cylindrical sample to the surrounding air. From top to bottom at 20, 30 and 60 kVp measured with the FR591 X-ray tube and for 21 keV with the compact light source. Lines: linear absorption coefficients calculated with the corresponding spectra given in Fig. 2.
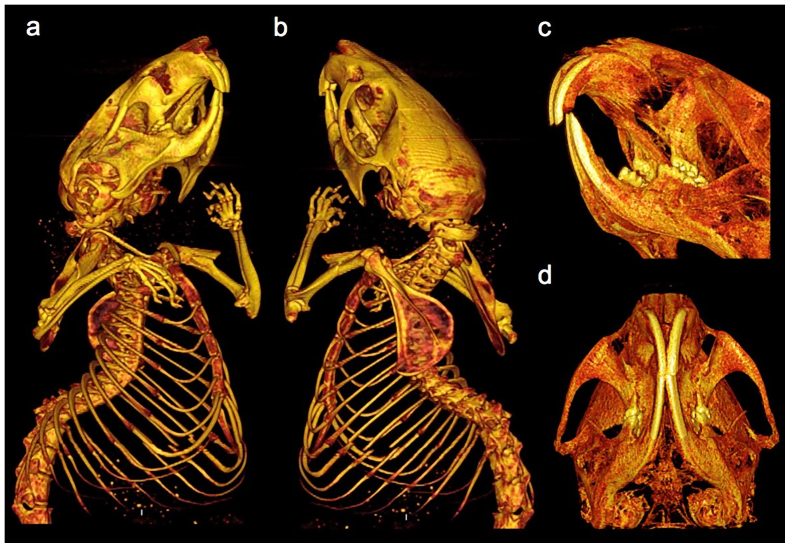
An application example of monochromatic CT imaging using the compact light source is shown in Fig. 6. It shows 3D rendering views of the skeleton of a small-animal sample (mouse, ex-vivo). The tomographic reconstruction was obtained from 360 projections over 180 deg. Panels (a),(b) show different views with an isotropic pixel size of 81 micron. Panels (c),(d) show zoom views of the head region. The density differences between bone and teeth are clearly distinguishable. For a detailed discussion about the drawback of polychromatic and the advantage of monochromatic X-ray sources for the determination of bone and teeth mineral density we refer to a recent review of W. Zou et al.12.
Figure 6. Absorption computer tomography of a mouse.
(a),(b) Two tomographic views of the upper body of a mouse. (c),(d) Details of the head region. For 3D datasets see the Supplementary video files S2 and S3 online.
In conclusion we have presented quantitative computed tomography (CT) measurements using a laser-driven compact electron-storage ring X-ray source. The experimental results obtained for quantitative CT measurements on mass absorption coefficients in water phantom sample confirm that a monochromatic laser-driven electron-storage ring X-ray source can indeed yield much higher CT image quality, particularly if quantitative aspects of computed tomographic imaging are considered. As the application of monochromatic CT yields more precise determination of density values in the sample, we believe that this study opens the way for non-destructive investigations of challenging classes of samples, which where - up until now - only reserved to investigations at large-scale synchrotron radiation sources. In the context of medical imaging, the application of monochromatic radiation can also yield a significant dose reduction, since the energy can be tuned exactly to the most effective value13.
Methods
To quantitatively compare the beam hardening effects for monochromatic and polychromatic sources we carried out CT measurements with a simple phantom consisting of a water-filled cylindrical plastic (polypropylene) container of 28.2 mm outer diameter. The thickness of the wall was 1.45 mm resulting in a diameter of the water sample of 25.3 mm. Measurements were performed at the above-mentioned laser driven compact light source (CLS, Lyncean Technologies Inc., USA)5,6 and at a rotating anode X-ray tube generator (FR591, Bruker-Nonius, The Netherlands).
The CLS produces X-rays by inverse Compton scattering of laser light at electrons stored in a compact storage ring of less than 5 m circumference. The mode locked Nd:YAG laser light has a wavelength of λ = 1064 nm, a pulse width of 25 ps and a repetition rate of 65 MHz. The laser power of 50 kW is stored in a bow-tie high finesse cavity. Electrons are accelerated to energies tunable between 25 MeV and 45 MeV by a linear accelerater of about 5 m length and stored in the compact storage ring. For head-on collision the energy of the generated X-rays depends on the energy of the laser photons, the electron energy and the backscattering angle θ relative to the electron beam direction14. With the electron energy tuned to 34.6 MeV, the CLS was operated at 21 keV peak X-ray energy. The spectrum of the X-rays was filtered by a ring aperture to a divergence of 4 mrad cone with nearly uniform intensity and spectrum across the beam. Although there is an angular dependence on the off-axis energy of scattered photons, within this aperture the spectrum of the X-rays is determined mainly from properties of the electron beam. A measured and a calculated spectrum can be found in the Supplementary Figure S1 online. The aperture size is a technical choice that balances fabrication difficulty against acceptable spectral bandwidth and field of view. Especially for imaging applications, the size of the aperture can be significantly larger to increase the field of view, an option that is currently under development and may be available in future CLS designs. For the experiment the source to detector distance was 16 m. The diameter of the beam at this distance was about 6 cm. Measurements of samples larger than the field of view can be stitched together15,16. The sample was placed directly in front of the detector. The beam crossed 3 m of air, 13 m evacuated tube and 4 kapton foils of 125 μm thickness before reaching the detector.
The FR591 was operated with a molybdenum anode at peak voltages of 20 kVp, 30 kVp and 60 kVp at an anode current of 60 mA, respectively. The source to detector distance was 2.45 m. The sample was situated at 1.06 m in front of the detector. The X-rays had to cross 2.45 m of air and a beryllium window. The thickness of the beryllium window of the FR591 was 250 μm. In both experiments we used a single-photon-counting PILATUS 100K detector (Dectris Ltd, Switzerland) with a silicon thickness of 450 μm determining the energy dependent effectiveness for detection of the X-rays. For all measurements the energy threshold of the detector was adjusted to 10 keV17,18. The threshold reduces double counting of photons due to the charge sharing effect. The image format was 195 × 487 pixel of 172 × 172 μm2 size per pixel. Typical exposure times for one projection image was 1 sec (at the CLS), and 0.08 sec (at the FR591), respectively. Note, that the X-ray flux of the CLS was not optimized for the experiment. With flux optimization and further improvement of the components of the CLS an increase of the flux by at least one order of magnitude is expected.
The tomographic reconstructions of the water sample were obtained from 360 projection images measured over 360 deg at the CLS and 500 projections over 360 deg at the FR591 by using conventional filtered back-projection11. The mouse skeleton was reconstructed from 360 projections over 180 deg.
Author Contributions
K.A., M.B., S.S., G.P. and F.P. conceived and performed the experiment. K.A. analyzed the data. R.R. and R.L. developed the CLS. K.A. and F.P. wrote the manuscript with discussion and improvement from all authors.
Supplementary Material
Supplementary Figure S1
Movie S2
Movie S3
Acknowledgments
K.A., M.B., S.S., G.P. and F.P. acknowledge financial support through the DFG Cluster of Excellence Munich-Center for Advanced Photonics (DFG EXC-158) and the European Research Council (FP7, Starting Grant No. 24012). The Compact Light Source experiment was supported in part by grants R44-GM074437 from NIGMS and R43-RR025730 from NCRR. Its contents are solely the responsibility of the authors and do not necessarily represent the official views of the NIH.
Footnotes
The authors declare no competing financial interests. Professor Ronald Ruth's contributions to this publication were as a paid consultant of Lyncean Technologies Inc., and were not part of his Stanford University duties or responsibilities.
References
- Coolidge W. D. A powerfull Röntgen ray tube with a pure electron discharge. The Physical Review II, 409–430 (1913). [Google Scholar]
- Hubbell J. H. Photon mass attenuation and energy-absorption coefficients. The International Journal of Applied Radiation and Isotopes 33, 1269–1290 (1982). [Google Scholar]
- Brooks R. A. & Di Chiro G. Beam hardening in x-ray reconstructive tomography. Physics in medicine and biology 21, 390–8 (1976). [DOI] [PubMed] [Google Scholar]
- Augat P., Fuerst T. & Genant H. K. Quantitative Bone Mineral Assessment at the Forearm : A Review. Osteoporos Int. 8, 299–310 (1998). [DOI] [PubMed] [Google Scholar]
- Huang Z. & Ruth R. Laser-Electron Storage Ring. Physical Review Letters 80, 976–979 (1998). [Google Scholar]
- Loewen R. J. A compact light source : Design and technical feasibility study of a LASER-electron storage ring X-ray source. Ph.D. thesis, Stanford University (2003). [Google Scholar]
- Bech M. et al. Hard X-ray phase-contrast imaging with the Compact Light Source based on inverse Compton X-rays. Journal of synchrotron radiation 16, 43–47 (2009). [DOI] [PMC free article] [PubMed] [Google Scholar]
- Abendroth J. et al. X-ray structure determination of the glycine cleavage system protein H of Mycobacterium tuberculosis using an inverse Compton synchrotron X-ray source. Journal of structural and functional genomics 11, 91–100 (2010). [DOI] [PMC free article] [PubMed] [Google Scholar]
- Sidky E. Y., Yu L., Pan X., Zou Y. & Vannier M. A robust method of x-ray source spectrum estimation from transmission measurements: Demonstrated on computer simulated, scatter-free transmission data. Journal of Applied Physics 97, 124701 (2005). [Google Scholar]
- Zhang L. et al. X-ray spectrum estimation from transmission measurements using the expectation maximization method. 2007 IEEE Nuclear Science Symposium Conference Record 3089–3093 (2007). [Google Scholar]
- Kak A. C. & Slaney M. Principles of Computerized Tomographic Imaging (IEEE Engineering in Medicine and Biology Society, 1988). [Google Scholar]
- Zou W., Hunter N. & Swain M. V. Application of polychromatic CT for mineral density determination. Journal of dental research 90, 18–30 (2011). [DOI] [PMC free article] [PubMed] [Google Scholar]
- Carroll F. E. Tunable monochromatic X rays: a new paradigm in medicine. AJR. American journal of roentgenology 179, 583–90 (2002). [DOI] [PubMed] [Google Scholar]
- Stepanek J. Parametric study of laser Compton-backscattering from free relativistic electrons. Nuclear Instruments and Methods in Physics Research Section A: Accelerators, Spectrometers, Detectors and Associated Equipment 412, 174–182 (1998). [Google Scholar]
- Schleede S. et al. Multimodal hard X-ray imaging of a mammography phantom at a compact synchrotron light source. Journal of synchrotron radiation 19, 525–9 (2012). [DOI] [PMC free article] [PubMed] [Google Scholar]
- Kyrieleis A., Ibison M., Titarenko V. & Withers P. J. Image stitching strategies for tomographic imaging of large objects at high resolution at synchrotron sources. Nuclear Instruments and Methods in Physics Research Section A: Accelerators, Spectrometers, Detectors and Associated Equipment 607, 677–684 (2009). [Google Scholar]
- Kraft P. et al. Characterization and Calibration of PILATUS Detectors. IEEE Transactions on Nuclear Science 56, 758–764 (2009). [Google Scholar]
- Kraft P., Bergamaschi A., Broennimann C., Dinapoli R. & Eikenberry E. F. Performance of single-photon-counting PILATUS detector modules. Journal of synchrotron radiation 368–375 (2009). [DOI] [PMC free article] [PubMed] [Google Scholar]
Associated Data
This section collects any data citations, data availability statements, or supplementary materials included in this article.
Supplementary Materials
Supplementary Figure S1
Movie S2
Movie S3


