

Abstract
Objectives:
To determine whether small diffusion-weighted imaging (DWI) lesions occur beyond the acute posthemorrhage time window in patients with intracerebral hemorrhage (ICH) and to characterize their spatial distribution in patients with lobar and deep cerebral hemorrhages.
Methods:
In this cross-sectional study, we retrospectively analyzed 458 MRI scans obtained in the acute (≤7 days after ICH) or nonacute (>14 days after ICH) phases from 392 subjects with strictly lobar (n = 276) and deep (n = 116) ICH (48.7% women; mean age 72.8 ± 11.7 years). DWI, apparent diffusion coefficient maps, fluid-attenuated inversion recovery, and T2* MRIs were reviewed for the presence and location of DWI lesions.
Results:
We identified 103 DWI hyperintense lesions on scans from 62 subjects, located mostly in lobar brain regions (90 of 103, 87.4%). The lesions were not uniformly distributed throughout the brain lobes; patients with strictly lobar ICH had relative overrepresentation of lesions in frontal lobe, and patients with deep ICH in parietal lobe (p = 0.002). Although the frequency of DWI lesions tended to be greater on scans performed within 7 days after ICH (39 of 214, 18.2%), they continued at high frequency in the nonacute period as well (23 of 178, 12.9%, odds ratio 1.5, 95% confidence interval 0.86–2.6 for acute vs nonacute). There was also no difference in frequency of lesions on acute and nonacute scans among 66 subjects with MRIs in both time periods (8 of 66 acute, 10 of 66 nonacute, odds ratio 0.77, 95% confidence interval 0.25–2.4).
Conclusions:
The high frequency of DWI lesions beyond the acute post-ICH period and their characteristic distributions suggest that they are products of the small vessel diseases that underlie ICH.
Recent analyses of patients with primary intracerebral hemorrhage (ICH) have identified a surprisingly high incidence of small hyperintense lesions on diffusion-weighted imaging (DWI) sequences.1–6 Although the neuropathologic basis of these clinically asymptomatic DWI hyperintense lesions has not been determined, their imaging properties are suggestive of small cerebral infarcts. One possibility is that these neuroimaging lesions represent a subset of acute, relatively large cerebral microinfarcts (CMI), a widespread form of ischemic brain injury associated with advanced small vessel disease (SVD).7–10
Given the brief time window (7–14 days11) during which small incident infarcts remain detectable by DWI, the high frequency of ICH-associated lesions suggests that small DWI lesions may occur frequently in patients with SVD. Most reports have focused on the early post-ICH period, however, raising the question of whether these DWI lesions represent an ongoing process occurring throughout the course of SVD rather than a byproduct of the acute ICH. Specific ties between the DWI lesions and the early post-ICH period have indeed been suggested by the finding of risk factors exclusive to this period, such as acute reductions in blood pressure.2,3,5 A second related question is whether the incidence and distribution of DWI lesions are affected by the type of underlying SVD.
We sought to determine 1) whether DWI lesions occur beyond the acute posthemorrhage time window, and 2) whether their spatial distribution differs according to the location of the ICH. We examined these questions in 392 patients with deep or lobar primary ICH and found characteristic disease-related distributions of DWI lesions occurring throughout both the acute and nonacute post-ICH periods.
METHODS
Study participants.
We reviewed 523 consecutive patients with symptomatic brain hemorrhagic lesions enrolled at Massachusetts General Hospital (MGH) between January 2005 and September 2011 in an ongoing prospective cohort study of ICH as detailed elsewhere.12 Subjects presented with hemorrhagic stroke or other symptoms related to hemorrhagic brain lesions (seizures, focal neurologic symptoms, or cognitive decline) and underwent at least 1 MRI during their course. During this period, 458 subjects with acute ICH did not undergo MRI.
For the purposes of the current study, we further excluded subjects with diagnosis of cerebral amyloid angiopathy (CAA)-related inflammation13 or hereditary CAA, subjects whose MRIs were performed because of stroke symptoms not attributable to an acute ICH, or MRI scans performed in the intermediate 8- to 14-day post-ICH time interval between the acute post-ICH period (defined as ≤7 days after the most recent symptomatic ICH) and the nonacute period (>14 days after the most recent ICH). Of the originally identified 523 patients, 90 were excluded for ICH location that was neither strictly lobar nor deep hemispheric (such as cerebellar), 23 were excluded for having MRIs only during the 8- to 14-day post-ICH window, 10 for history or neuroimaging suggestive of hereditary or inflammatory-type CAA, 5 for absence of DWI sequences, 2 for acute neurologic symptoms other than those related to ICH, and 1 for a possible secondary cause of infarction (endocarditis), leaving 392 patients for analysis. Thirty-four of them were included in a previous report.1 Based on review of neuroimaging, these patients were further divided into those with strictly lobar hemorrhages (n = 276) meeting criteria for definite, probable, or possible CAA14 (4 [1.5%], 170 [62%], and 102 [36.5%], respectively) and those with deep hemispheric or brainstem hemorrhages (n = 116) consistent with hypertensive (HTN) vasculopathy.
All subjects with acute ICH were admitted to the MGH Neurocritical Care Unit and treated according to the unit's ICH protocol (appendix e-1 on the Neurology® Web site at www.neurology.org). The indications for the MRIs performed in the nonacute phase (n = 178) were routine post-ICH follow-up in 63 subjects (35%), new nonstroke symptoms (headache, transient sensory symptoms, or dizziness) in 51 (29%), cognitive deterioration in 29 (16%), research in 19 (11%), seizures in 10 (6%), head trauma in 4 (2%), and cancer in 2 (1%). Based on this information, we further subdivided the patients in the nonacute group into those whose scans were performed without a triggering clinical event of any sort (routine post-ICH follow-up or research, n = 82) and the remainder with some type of nonstroke triggering symptom (n = 96).
Standard protocol approvals, registrations, and patient consents.
All aspects of the study were approved by the hospital Institutional Review Board, which allows us to collect data on all subjects with ICH treated at MGH.
Data collection.
Demographic and clinical data including age, gender, serum creatinine, antithrombotic and statin use, and vascular risk factors were obtained for the time point closest to MRI by chart review. Numbers of missing covariates are indicated in table e-1.
MRI acquisition and analysis.
All subjects underwent brain MRI on a 1.5 T Signa scanner as described.15 DWI, fluid-attenuated inversion recovery (FLAIR), and gradient-echo sequences were obtained using previously reported parameters.1,15,16 All images were reviewed for the presence, number, and distribution of hyperintensities on DWI by a clinical neurologist (E.A.) and confirmed by a vascular neurologist (M.E.G.) without knowledge of clinical information. Lesions were considered DWI positive if hyperintense relative to surrounding tissue and distinct from ICH (i.e., with normal-appearing tissue between DWI lesion and hemorrhage; figure 1). The corresponding region on the apparent diffusion coefficient map was reviewed to confirm that diffusion was reduced or isointense.17 We have previously reported high interrater reliability for detection of DWI lesions.1 The locations of DWI lesions were classified as frontal, temporal, parietal, occipital, deep hemispheric, cerebellar, or brainstem according to a landmark-based segmentation protocol.18 The observed number of lesions per lobe was compared with the number predicted by a random distribution, using lobar (white and gray matter) volumes measured with the same segmentation protocol.19
Figure 1. DWI lesions in acute and nonacute time periods.
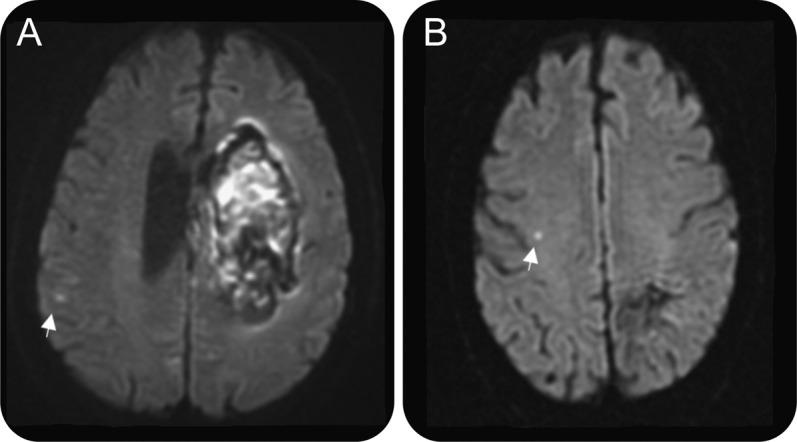
Shown are a parietal DWI lesion seen 1 day after contralateral basal ganglia hemorrhage in a 66-year-old man (A) and a frontal DWI lesion 2 years after contralateral parietal hemorrhage in a 69-year-old man (B). DWI = diffusion-weighted imaging.
For the primary analysis of the effect of scan timing on DWI lesion incidence, we divided subjects into 2 nonoverlapping groups of acute vs nonacute imaging. For this analysis, each patient contributed only 1 acute or nonacute scan. For patients who underwent more than 1 scan, we selected the chronologically first nonacute scan. In a secondary analysis of the subset of patients who underwent DWI imaging in both the acute and nonacute time periods, the presence of DWI lesions was compared on paired acute and nonacute images from individual subjects.
Gradient-echo images were evaluated for number and distribution of cerebral microbleeds (CMBs) (deep vs lobar) and to exclude peri-hemorrhage artifacts. For purposes of multivariable analysis, the number of CMBs was categorized into tertiles (0, 1–5, or >5). White matter hyperintensity (WMH) was rated visually on axial FLAIR images on the 4-point Fazekas scale,20,21 modified to include both subcortical and periventricular hyperintensities. Intrarater agreement for this modified scale has been reported to be high (κ = 0.84).22 WMH was dichotomized as none to mild (0–1) vs moderate to severe (2–3).
Composite images of the spatial distribution of DWI lesions were created using coregistered MRI images (appendix e-1).
Statistical analysis.
Comparisons of acute vs nonacute scans, DWI-negative vs -positive cases, and observed vs expected lobar lesion distribution were performed using t test (for age, creatinine), Wilcoxon rank sum (for CMB), χ2 and Fisher exact tests (categorical variables), or McNemar test (paired categorical variables). Multivariable models were analyzed by logistic regression, incorporating covariates identified in the univariate analyses with p < 0.1. Stata software (StataCorp, College Station, TX) was used for multivariable analyses.
RESULTS
We analyzed 458 MRI scans from 392 subjects with deep and lobar ICH (48.7% women, 87.4% white race, mean age 72.8 ± 11.7 years) and identified 103 DWI lesions in 62 individuals. All lesions were at least 1.5 cm distant from the closest hemorrhage (figure 1); 46% and 45.5% of the supratentorial lesions were ipsilateral to the ICH in the acute and nonacute groups, respectively. The 62 subjects (15.6%) with at least 1 DWI lesion did not differ from the 330 without lesions by age, gender, vascular risk factors, use of statins, antithrombotics, moderate to severe WMH, number of CMBs, or serum creatinine (table e-1).
Distribution of DWI lesions.
Most DWI lesions (90 of 103, 87.4%) were in the cortical gray matter or gray/white border (47 lesions, 45.6%) or subcortical white matter (43 lesions, 41.7%; figure 2). Of the remainder, 7 (6.8%) were deep hemispheric, 6 (5.8%) cerebellar, and 0 brainstem. These lesions were not uniformly distributed across the cortical lobes (p = 0.003), but rather demonstrated a predilection for parietal lobe and underrepresentation in temporal lobe (table 1) relative to the expected random distribution by lobar volume. Further nonuniformity was demonstrated by comparing lesion distributions in patients with strictly lobar vs deep ICH (p = 0.002). Patients with strictly lobar ICH had relative overrepresentation of lesions in frontal lobe, and patients with deep ICH in parietal lobe (table 2, figure 3). A similar contrast from the deep ICH group (p = 0.001) was observed when the strictly lobar ICH group was further restricted to the 174 subjects meeting the more stringent criteria for probable or definite CAA.14 The distribution of DWI lesions among the lobes did not differ between the acute and nonacute time periods (figure 3; p = 0.23 for strictly lobar ICH, p = 0.43 for deep ICH).
Figure 2. DWI lesion distribution within brain tissue.
The 6 axial 10-mm slabs demonstrate the distribution of 82 of the 103 DWI lesions; the remaining 21 lesions were located in the other 9 slabs not shown in the figure. In each image, all lesions within a slab are overlaid onto the middle slice of the slab. Lesion markers were placed at the center of the marked lesion after image resampling and do not represent the actual size of the lesion. DWI = diffusion-weighted imaging; ICH = intracerebral hemorrhage.
Table 1.
DWI lesion distribution by cerebral lobe
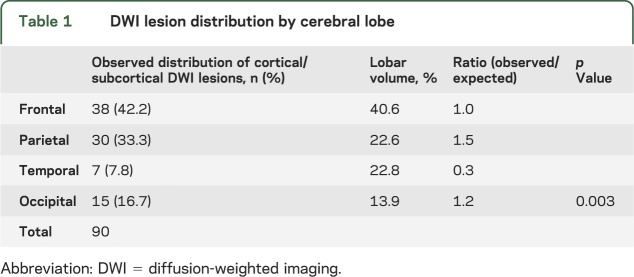
Table 2.
DWI lesion distribution by cerebral lobe in deep and lobar ICH
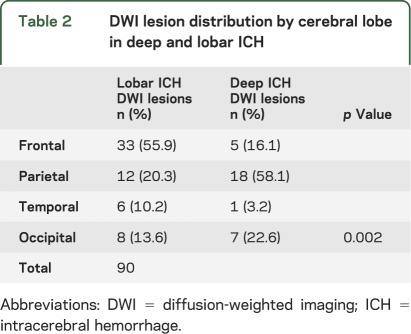
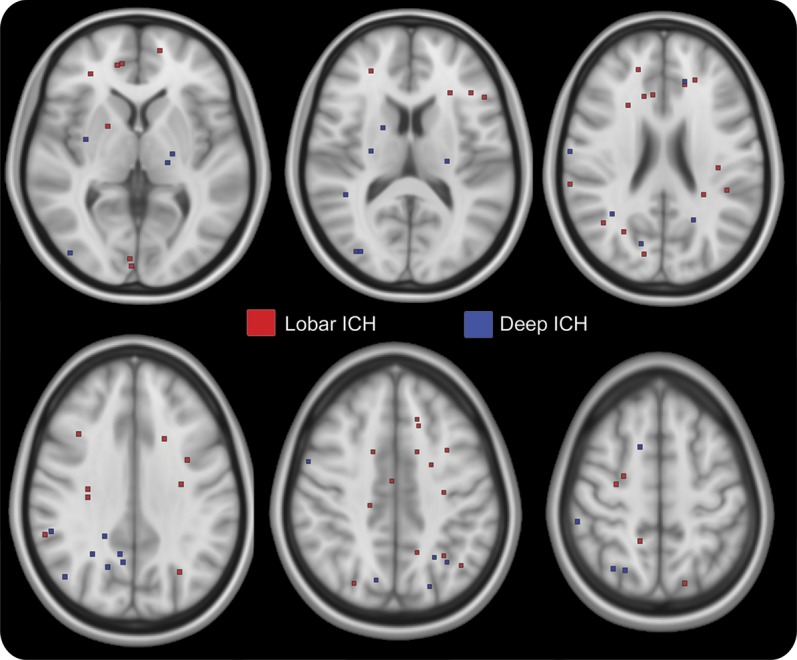
Figure 3. Three-dimensional map of DWI lesion distribution.

The axial (A, C) and sagittal (B, D) images display the composite locations of the acute and nonacute DWI lesions in the lobar and deep ICH groups. Each spot represents the center of the lesion. DWI = diffusion-weighted imaging; ICH = intracerebral hemorrhage.
Posthemorrhage timing and incident DWI lesions.
We took 2 approaches to analyzing the effect of posthemorrhage timing on incidence of new DWI lesions. The first was to compare the incidence of lesions in distinct (i.e., nonoverlapping) subsets of patients scanned in the acute (≤7 days) post-ICH period (n = 214, median post-ICH interval 2 days, interquartile range 1–3 days) with those scanned in a nonacute (>14 days post-ICH) timeframe (n = 178, median post-ICH interval 128 days, interquartile range 46–367 days, for those with prior symptomatic ICH). Subjects in the acute group were older, more likely to have diabetes mellitus (DM), and had fewer CMBs (table e-2). DWI lesions were present in 39 of 214 acute patients (18.2%) and 23 of 178 nonacute patients (12.9%) (odds ratio [OR] 1.5, 95% confidence interval [CI] 0.86–2.6, p = 0.2). There was no difference in frequency of DWI lesions among nonacute patients whose scans were performed without triggering clinical event (lesions present in 10 of 82, 12.2%) vs those with some type of (nonstroke) clinical symptom (13 of 83, 13.5%, p = 0.8). After controlling for age, gender, DM, and CMB count by multivariable analysis (subjects who had missing data for CMB count [n = 19] or DM [n = 4] were excluded from the analysis), the acute post-ICH period seemed to have an increased incidence of DWI lesions (OR 1.9, 95% CI 1.03–3.6, p = 0.04).
In the second approach, the incidence of DWI lesions was compared on acute and nonacute images in 66 subjects (mean age 70.3 ± 10.5 years) who underwent DWI-MRI in both time periods. Median time interval between the acute and nonacute scans was 104 days (interquartile range 48–205 days). This paired analysis showed no differences, with DWI lesions on 8 of 66 acute images (12.1%) and 10 of 66 nonacute images (15.2%) (OR 0.75, 95% CI 0.21–2.5, p = 0.8). Of the 8 patients with DWI lesions on their acute scans, only 2 were also DWI positive on their nonacute scans, no greater than expected by chance (p = 0.6).
Hemorrhage location and DWI lesions.
We also analyzed whether the incidence of DWI lesions was associated with ICH location as an indicator of underlying SVD type. We found no difference between patients with strictly lobar vs deep ICH. DWI lesions were identified in 42 of 276 subjects (15.2%) with strictly lobar hemorrhages meeting criteria for definite, probable, or possible CAA,14 and 20 of 116 subjects (17.2%) with deep hemorrhages (OR 0.86, 95% CI 0.48–1.5, p = 0.7). Using stricter definitions for the underlying SVDs, we found similar proportions of DWI lesions among the lobar ICH subjects diagnosed with probable or definite CAA (31 of 174, 17.8%) and strictly deep ICH patients with clearly documented hypertension (17 of 97, 17.5%, p = 0.6).
DISCUSSION
Several findings support the hypothesis that the DWI lesions frequently observed after ICH are an ongoing product of underlying SVD. One indication is that although our evidence is equivocal regarding whether these lesions are more common acutely, they clearly continue to occur at high frequency outside the acute post-ICH period. A second line of evidence is that the lesions occur in characteristic lobar distributions that appear to differ between patients with strictly lobar and deep ICH, which generally represent distinct small vessel pathologies.23 These findings suggest that ischemia is an active, ongoing process in cerebral SVD.
Although the location of lesions seems to have a specific relationship to the type of underlying SVD (table 2, figure 3), the mechanisms that target these particular sites for these lesions are unclear. CAA pathology and CAA-related hemorrhages tend to be most severe in posterior cortical regions,24–26 rather than the frontal regions favored by the DWI lesions in lobar ICH and in patients with definite/probable CAA. Even more unexpected is the predominance of posterior cortical DWI lesions in deep ICH patients with likely HTN vasculopathy, a disorder that primarily affects deep penetrating arterioles in the basal ganglia, thalamus, and brainstem.27,28 The apparent disconnect between the locations of SVD pathology vs SVD-related DWI lesions suggests as yet unidentified processes contributing to infarction in these disorders. The superficial cortical distribution of lesions (figure 3) is also somewhat suggestive of the vascular borderzone or “watershed” region.29 The absence of a widely accepted definition of precisely what constitutes the watershed region and how to calculate its volume, however, make it difficult to confirm a true predilection for this location.
We observed similar frequencies of DWI lesions in association with strictly lobar (15.2%) and deep ICH (17.2%), suggesting that CAA and HTN vasculopathy both trigger high rates of infarction. This finding of high rates of lesions in likely HTN vasculopathy is consistent with data from a recent study of primarily hypertensive and black patients (35% DWI positive immediately post-ICH, 27% at 1 month),5 but differs from another report of nearly 3 times higher frequency of DWI lesions in patients with probable CAA (9 of 39, 23%) compared with other ICH types (6 of 75, 8%).4 These differences may reflect variations in patient selection or small sample sizes, and will likely be reconciled as more studies of characterized ICH patients emerge.
The substantial frequency of DWI lesions observed outside the acute post-ICH time period reinforces the idea raised in previous reports1,4 that overall incidence of these lesions must be high. In the current study, we observed 13 lesions (on 10 positive scans) among 82 scans performed without triggering clinical event, yielding estimates for the overall incidence of these lesions between 7.2 per year (if the lesions are assumed to remain visible as long as 14 days11) and 14.4 per year (if assumed to remain visible only 7 days). Summed over a period of years, these estimates suggest a cumulative burden of dozens or hundreds of lesions. The true number of neuropathologic CMI is likely to be higher still, because DWI-MRI appears capable of detecting only the largest microinfarcts: observed DWI lesions are typically several millimeters or more in diameter, larger than the average diameters for histopathologically observed CMI of 0.2 to 1.0 mm.30,31 It is thus reasonable to postulate that the DWI lesions observed in patients with SVD are indicative of a truly high burden of otherwise “invisible” lesions32 capable of causing substantial cognitive deficits.31,33–35
Our data provide equivocal results regarding whether DWI lesions occur at increased incidence during the acute post-ICH period. Multivariable analysis found increased odds for DWI lesions in the acute period, whereas secondary analysis of a smaller subset of patients scanned in both time periods showed no difference. There are several candidate mechanisms for producing a higher risk of DWI small lesions immediately after ICH, including abrupt therapeutic reductions in blood pressure,2,3,5 increased intracranial pressure,2,5 therapeutic withdrawal of antithrombotic medications, endothelial dysfunction, or inflammation. The small differences between risk during the acute and nonacute periods suggest that these factors are not the sole causes of infarction. The similar spatial distributions of acute and nonacute DWI lesions (figure 3) also suggest that lesions in both time windows are reflections of the underlying SVD.
Notable strengths of our study are the numbers of consecutive patients analyzed, as well as the data on lesion location. A key weakness is our study's retrospective design and reliance on available nonacute clinical MRIs. The use of a convenience sample of nonacute scans obtained at various times and for various indications raises concerns that the observed incidence of DWI lesions may not be truly representative of their ongoing occurrence. It is reassuring, however, that essentially the same lesion frequencies were detected on nonacute scans performed without any triggering clinical event (12.2%) as those with some sort of triggering event (13.5%). Although all patients with acute ICH were treated according to a standardized blood pressure protocol, we do not have individual patient information. We also note that many ICH patients did not undergo MRI, introducing potential selection biases in our findings. Another limitation is that blinding raters to the concomitant presence of acute or nonacute hemorrhage is difficult, leading to potential biases toward lesion identification. DWI lesions are not common in patients without advanced SVD, however, appearing in no control subjects in previous publications,1,4 and only 60 of 16,206 (0.37%) consecutive nonstroke MRI scans at a university hospital.36 The observed lesions are therefore unlikely to be related to unconscious bias alone.
The finding here and elsewhere1–6 of DWI lesions in association with ICH, together with reports of incident CMBs in association with acute ischemic stroke,37 support the idea that advanced SVD can produce both hemorrhagic and ischemic brain injury. This pathophysiologic framework may have implications for clinical practice; for example, an incidental DWI lesion in a patient with advanced SVD may not require a full evaluation for other causes. SVD may also pose clinical challenges in balancing the risks of hemorrhagic vs ischemic outcomes, such as deciding on use of antithrombotics or choosing between the benefits38 and risks2,3,5 of acute post-ICH blood pressure reductions.
CMI, although difficult to observe during life,32 may be the most prevalent of all infarct types and the most directly linked to neurologic dysfunction.31,33–35 DWI lesions may thus be a key neuroimaging marker for future trials aimed at slowing clinical manifestations of cerebral SVD, particularly cognitive decline.
Supplementary Material
GLOSSARY
- CAA
cerebral amyloid angiopathy
- CI
confidence interval
- CMB
cerebral microbleed
- CMI
cerebral microinfarcts
- DM
diabetes mellitus
- DWI
diffusion-weighted imaging
- FLAIR
fluid-attenuated inversion recovery
- HTN
hypertensive
- ICH
intracerebral hemorrhage
- MGH
Massachusetts General Hospital
- OR
odds ratio
- SVD
small vessel disease
- WMH
white matter hyperintensity
Footnotes
Supplemental data at www.neurology.org
AUTHOR CONTRIBUTIONS
Study design: S.M.G., E.A., M.E.G. Data acquisition: E.A., A.A., A.P.D., A.V. Data analysis: E.A., M.E.G., S.M.-R. Study management: S.M.G., K.M.S., J.R., A.V. Manuscript preparation: E.A., S.M.G. Manuscript review: E.A., M.E.G., A.V., J.R., S.M.G.
DISCLOSURE
E. Auriel, M.E. Gurol, A. Ayres, A.P. Dumas, K.M. Schwab, A. Vashkevich, and S. Martinez-Ramirez report no disclosures. J. Rosand receives research support from the NIH and American Heart Association. A. Viswanathan reports no disclosures. S.M. Greenberg receives research support from the NIH and serves as consultant and on the advisory board of Hoffman-La Roche. Go to Neurology.org for full disclosures.
REFERENCES
- 1.Kimberly WT, Gilson A, Rost NS, et al. Silent ischemic infarcts are associated with hemorrhage burden in cerebral amyloid angiopathy. Neurology 2009;72:1230–1235 [DOI] [PMC free article] [PubMed] [Google Scholar]
- 2.Prabhakaran S, Gupta R, Ouyang B, et al. Acute brain infarcts after spontaneous intracerebral hemorrhage: a diffusion-weighted imaging study. Stroke 2010;41:89–94 [DOI] [PubMed] [Google Scholar]
- 3.Garg RK, Liebling SM, Maas MB, Nemeth AJ, Russell EJ, Naidech AM. Blood pressure reduction, decreased diffusion on MRI, and outcomes after intracerebral hemorrhage. Stroke 2012;43:67–71 [DOI] [PMC free article] [PubMed] [Google Scholar]
- 4.Gregoire SM, Charidimou A, Gadapa N, et al. Acute ischaemic brain lesions in intracerebral haemorrhage: multicentre cross-sectional magnetic resonance imaging study. Brain 2011;134:2376–2386 [DOI] [PubMed] [Google Scholar]
- 5.Menon RS, Burgess RE, Wing JJ, et al. Predictors of highly prevalent brain ischemia in intracerebral hemorrhage. Ann Neurol 2012;71:199–205 [DOI] [PMC free article] [PubMed] [Google Scholar]
- 6.Kidwell CS, Menon RS, Sobotka I, et al. High rate of silent ischemic lesions at 1 year in patients with primary intracerebral hemorrhage. Stroke 2012;43:A102. Abstract. [Google Scholar]
- 7.Okazaki H, Reagan TJ, Campbell RJ. Clinicopathologic studies of primary cerebral amyloid angiopathy. Mayo Clin Proc 1979;54:22–31 [PubMed] [Google Scholar]
- 8.Haglund M, Passant U, Sjöbeck M, Ghebremedhin E, Englund E. Cerebral amyloid angiopathy and cortical microinfarcts as putative substrates of vascular dementia. Int J Geriatr Psychiatry 2006;21:681–687 [DOI] [PubMed] [Google Scholar]
- 9.Soontornniyomkij V, Lynch MD, Mermash S, et al. Cerebral microinfarcts associated with severe cerebral beta-amyloid angiopathy. Brain Pathol 2010;20:459–467 [DOI] [PMC free article] [PubMed] [Google Scholar]
- 10.De Reuck J, Deramecourt V, Cordonnier C, Leys D, Maurage CA, Pasquier F. The impact of cerebral amyloid angiopathy on the occurrence of cerebrovascular lesions in demented patients with Alzheimer features: a neuropathological study. Eur J Neurol 2011;18:913–918 [DOI] [PubMed] [Google Scholar]
- 11.Burdette JH, Ricci PE, Petitti N, Elster AD. Cerebral infarction: time course of signal intensity changes on diffusion-weighted MR images. AJR Am J Roentgenol 1998;171:791–795 [DOI] [PubMed] [Google Scholar]
- 12.O'Donnell HC, Rosand J, Knudsen KA, et al. Apolipoprotein E genotype and the risk of recurrent lobar intracerebral hemorrhage. N Engl J Med 2000;342:240–245 [DOI] [PubMed] [Google Scholar]
- 13.Eng JA, Frosch MP, Choi K, Rebeck GW, Greenberg SM. Clinical manifestations of cerebral amyloid angiopathy-related inflammation. Ann Neurol 2004;55:250–256 [DOI] [PubMed] [Google Scholar]
- 14.Knudsen KA, Rosand J, Karluk D, Greenberg SM. Clinical diagnosis of cerebral amyloid angiopathy: validation of the Boston criteria. Neurology 2001;56:537–539 [DOI] [PubMed] [Google Scholar]
- 15.Gurol ME, Irizarry MC, Smith EE, et al. Plasma beta-amyloid and white matter lesions in AD, MCI, and cerebral amyloid angiopathy. Neurology 2006;66:23–29 [DOI] [PubMed] [Google Scholar]
- 16.Greenberg SM, Eng JA, Ning M, Smith EE, Rosand J. Hemorrhage burden predicts recurrent intracerebral hemorrhage after lobar hemorrhage. Stroke 2004;35:1415–1420 [DOI] [PubMed] [Google Scholar]
- 17.Muir KW, Buchan A, von Kummer R, Rother J, Baron JC. Imaging of acute stroke. Lancet Neurol 2006;5:755–768 [DOI] [PubMed] [Google Scholar]
- 18.Bokde AL, Teipel SJ, Schwarz R, et al. Reliable manual segmentation of the frontal, parietal, temporal, and occipital lobes on magnetic resonance images of healthy subjects. Brain Res Brain Res Protoc 2005;14:135–145 [DOI] [PubMed] [Google Scholar]
- 19.Mesker DJ, Poels MM, Ikram MA, et al. Lobar distribution of cerebral microbleeds: the Rotterdam Scan Study. Arch Neurol 2011;68:656–659 [DOI] [PubMed] [Google Scholar]
- 20.Fazekas F, Chawluk JB, Alavi A, Hurtig HI, Zimmerman RA. MR signal abnormalities at 1.5 T in Alzheimer's dementia and normal aging. AJR Am J Roentgenol 1987;149:351–356 [DOI] [PubMed] [Google Scholar]
- 21.Inzitari D, Simoni M, Pracucci G, et al. ; LADIS Study Group Risk of rapid global functional decline in elderly patients with severe cerebral age-related white matter changes: the LADIS study. Arch Intern Med 2007;167:81–88 [DOI] [PubMed] [Google Scholar]
- 22.van Straaten EC, Fazekas F, Rostrup E, et al. ; LADIS Group Impact of white matter hyperintensities scoring method on correlations with clinical data: the LADIS study. Stroke 2006;37:836–840 [DOI] [PubMed] [Google Scholar]
- 23.Pantoni L. Cerebral small vessel disease: from pathogenesis and clinical characteristics to therapeutic challenges. Lancet Neurol 2010;9:689–701 [DOI] [PubMed] [Google Scholar]
- 24.Vinters HV, Gilbert JJ. Cerebral amyloid angiopathy: incidence and complications in the aging brain. II. The distribution of amyloid vascular changes. Stroke 1983;14:924–928 [DOI] [PubMed] [Google Scholar]
- 25.Rosand J, Muzikansky A, Kumar A, et al. Spatial clustering of hemorrhages in probable cerebral amyloid angiopathy. Ann Neurol 2005;58:459–462 [DOI] [PubMed] [Google Scholar]
- 26.Johnson KA, Gregas M, Becker JA, et al. Imaging of amyloid burden and distribution in cerebral amyloid angiopathy. Ann Neurol 2007;62:229–234 [DOI] [PubMed] [Google Scholar]
- 27.Garcia JH, Ho KL. Pathology of hypertensive arteriopathy. Neurosurg Clin N Am 1992;3:497–507 [PubMed] [Google Scholar]
- 28.Qureshi AI, Tuhrim S, Broderick JP, Batjer HH, Hondo H, Hanley DF. Spontaneous intracerebral hemorrhage. N Engl J Med 2001;344:1450–1460 [DOI] [PubMed] [Google Scholar]
- 29.Bogousslavsky J, Regli F. Unilateral watershed cerebral infarcts. Neurology 1986;36:373–377 [DOI] [PubMed] [Google Scholar]
- 30.Okamoto Y, Ihara M, Fujita Y, Ito H, Takahashi R, Tomimoto H. Cortical microinfarcts in Alzheimer's disease and subcortical vascular dementia. Neuroreport 2009;20:990–996 [DOI] [PubMed] [Google Scholar]
- 31.Arvanitakis Z, Leurgans SE, Barnes LL, Bnnet DA, Schneider JA. Microinfarct pathology, dementia, and cognitive systems. Stroke 2011;42:722–727 [DOI] [PMC free article] [PubMed] [Google Scholar]
- 32.Smith EE, Schneider JA, Wardlaw JM, Greenberg SM. Cerebral microinfarcts: the invisible lesions. Lancet Neurol 2012;11:272–282 [DOI] [PMC free article] [PubMed] [Google Scholar]
- 33.Sonnen JA, Larson EB, Crane PK, et al. Pathological correlates of dementia in a longitudinal, population-based sample of aging. Ann Neurol 2007;62:406–413 [DOI] [PubMed] [Google Scholar]
- 34.Launer LJ, Hughes TM, White LR. Microinfarcts, brain atrophy, and cognitive function: the Honolulu Asia Aging Study Autopsy Study. Ann Neurol 2011;70:774–780 [DOI] [PMC free article] [PubMed] [Google Scholar]
- 35.Sinka L, Kövari E, Gold G, et al. Small vascular and Alzheimer disease-related pathologic determinants of dementia in the oldest-old. J Neuropathol Exp Neurol 2010;69:1247–1255 [DOI] [PubMed] [Google Scholar]
- 36.Yamada K, Nagakane Y, Sasajima H, et al. Incidental acute infarcts identified on diffusion-weighted images: a university hospital-based study. AJNR Am J Neuroradiol 2008;29:937–940 [DOI] [PMC free article] [PubMed] [Google Scholar]
- 37.Jeon SB, Kwon SU, Cho AH, Yun SC, Kim JS, Kang DW. Rapid appearance of new cerebral microbleeds after acute ischemic stroke. Neurology 2009;73:1638–1644 [DOI] [PubMed] [Google Scholar]
- 38.Anderson CS, Huang Y, Wang JG, et al. ; INTERACT Investigators Intensive blood pressure reduction in acute cerebral haemorrhage trial (INTERACT): a randomised pilot trial. Lancet Neurol 2008;7:391–399 [DOI] [PubMed] [Google Scholar]
Associated Data
This section collects any data citations, data availability statements, or supplementary materials included in this article.