Abstract
The rotting of grains by seed-infecting fungi poses one of the greatest economic challenges to cereal production worldwide, not to mention serious risks to human and animal health. Among cereal production, maize is arguably the most affected crop, due to pathogen-induced losses in grain integrity and mycotoxin seed contamination. The two most prevalent and problematic mycotoxins for maize growers and food and feed processors are aflatoxin and fumonisin, produced by Aspergillus flavus and Fusarium verticillioides, respectively.
Recent studies in molecular plant-pathogen interactions have demonstrated promise in understanding specific mechanisms associated with plant responses to fungal infection and mycotoxin contamination1,2,3,4,5,6. Because many labs are using kernel assays to study plant-pathogen interactions, there is a need for a standardized method for quantifying different biological parameters, so results from different laboratories can be cross-interpreted. For a robust and reproducible means for quantitative analyses on seeds, we have developed in-lab kernel assays and subsequent methods to quantify fungal growth, biomass, and mycotoxin contamination. Four sterilized maize kernels are inoculated in glass vials with a fungal suspension (106) and incubated for a predetermined period. Sample vials are then selected for enumeration of conidia by hemocytometer, ergosterol-based biomass analysis by high performance liquid chromatography (HPLC), aflatoxin quantification using an AflaTest fluorometer method, and fumonisin quantification by HPLC.
Keywords: Immunology, Issue 62, Mycotoxins, sporogenesis, Aspergillus flavus, Fusarium verticillioides, aflatoxin, fumonisin, plant-microbe interactions, plant biology
Protocol
1. Maize Kernel Bioassay
Two weeks prior, culture the fungal pathogens on Potato Dextrose Agar (PDA) at 28 °C.
Select kernels with similar size and shape, preferably flattened so they lay level with the bottom of bioassay vials, and place in 50 ml falcon tubes. Kernels selected must have been produced concurrently in same environment to ensure similar seed age and metabolite composition.
Surface sterilize kernels by shaking tubes at room temperature for 5 minutes with 70% ethanol, 1 minute with sterile water, and 10 minutes with 6% sodium hypochlorite. Rinse, three times, for 5 minutes each time, with sterile water while continuing shaking. Pat kernels dry on autoclaved towels.
To facilitate infection of Aspergillus flavus, create a small wound on the embryo-side with an 18 G needle to the depth of 0.5 cm. However, in our experience a larger wound is needed for Fusarium verticillioides infection. Therefore, use a razor blade to cut into the embryo-side at a depth of 0.5 mm.
Prepare inoculum suspension by scraping cultured plates in about 5 ml of autoclaved 0.01% Tween-20 solution to liberate spores and remove mycelium by gravity filtering through at least 4 layers of autoclaved cheesecloth. Calculate spore concentration with hemocytometer and adjust to 106 spores /ml for A. flavus or F. verticillioides. If using other species of pathogen or host, it is important to evaluate concentrations of inoculum for appropriate infection.
Create a humidity chamber in a plastic container (29.2 cm X 18.7 cm X 8.3 cm) lined with five sheets of paper towels and 100 ml of sterile water. Chamber is not water- or air-tight and additional water should be added throughout experiment to keep paper towels moist.
Place four kernels into an autoclaved 20 ml glass scintillation vial and record their mass. Inoculate with 200 μl spore suspension, cap, and vortex to evenly coat kernels with suspension. Loosen caps to freely allow air exchange and place into humidity chamber.
Note: For seeds or fungi other than those described in these methods, the amount of inoculum required may be different and should be derived experimentally.
Incubate kernels under a 12-h-light/12-h-dark photoperiod at 28 °C for 7 days or until desired.
2. Conidia Enumeration
After the infection period, add 5 ml of autoclaved 0.01% Tween-20 to scintillation vials containing infected kernels and vortex thoroughly for 1 minute.
Using a wide-bore pipette tip, immediately dilute by transferring two separate 200 μl aliquots of spore suspension into 2.0 ml Eppendorf tubes containing 1.8 ml of 0.01% Tween-20 (or dilute as needed depending on infection).
Enumerate each 200 μl aliquot twice with a hemocytometer4 and compare levels of conidia between treatments.
3. Aflatoxin Quantification
Add kernels from 1 sample to 50 ml blender cup with 20 ml of 80% methanol and 0.05 g NaCl, cover and blend at high speed for 1 min.
Place a fluted filter paper over a clean collection vessel and pour extract into filter.
Transfer 10 ml of filtrate to a clean vessel, add 20 ml distilled H2O, and mix well.
Filter sample through a 1.5 μm glass microfibre filter into a clean cup.
Apply 1 ml of filtered extract to Afla Test column and, using compressed air, force the filtered extract through the column at a rate of 1-2 drops/second until emptied.
Wash column twice with 1 ml of distilled H2O and pass through column at 1-2 drop/second until air comes through.
Elute column with 1ml of 100% HPLC grade methanol at a 1-2 drop/second rate collected into a glass cuvette.
Add 1 ml of Afla Test Developer to eluate and mix well. Place cuvette into calibrated fluorometer and read at 60 sec.
Note: When using the Aflatest FGIS protocol, the measurement from the fluorometer is calculated based upon an initial 50 grams of sample extracted in 100 ml. If you consider the dilution of the sample with water, the 1 ml applied to a column represents 0.166 grams of sample. So, when modifying the protocol, you need to take into account the differences in sample size and the initial extraction solution. For example, 2 grams of kernels are extracted in 20 ml 80% methanol. This is 0.1 grams/ml. When 1 ml of this sample is mixed with 2 ml water, the proportion of sample in the liquid is now 0.033 grams/ml. If this sample gives a fluorometer reading of 100 ppb, the actual concentration is based on the proportion of sample to 0.166, that is, ppb = (0.166 gram X 100 ppb)/ 0.1 gram), or 166 ppb. For alternative aflatoxin quantification methods, see reference 7.
4. Fumonisin B1 (FB1) Analysis
When fungus is grown on corn kernels, extract samples overnight with 10 ml of acetonitrile/water (50/50, v/v) at room temperature without agitation. Subsequently, mix the extract (2 ml) with deionized water (6 ml), and apply this mix (8 ml) directly to the C-18 solid phase extraction.
Before loading sample, precondition the C-18 solid phase extraction column by rinsing with 2 ml of acetonitrile followed by 2 ml of water.
After loading the sample, the column is washed with 2 ml of water followed by 2 ml of acetonitrile/water (15/85, v/v). Sample for HPLC analysis (containing FB1) is eluted with 2 ml of acetonitrile/water (70/30, v/v).
Derivatize FB1 with o-phthaldehyde (OPA) by transferring 0.1 ml of the column eluate to a vial containing 0.1 ml borate buffer (0.05 M boric acid/0.05 M sodium borate [50/50, v/v], pH 8.5) and 0.1 ml OPA (0.1 mg/ml in acetonitrile with 0.5% - mercaptoethanol).
Stop the reaction after 10 min by adding 0.5 ml of acetonitrile/0.01 M boric acid (40/60, v/v).
Analyze FB1 on a Shimadzu HPLC LC-20AT system equipped with an analytical Zorbax ODS column (4.6 150 mm) and a variable wavelength Shimatzu RF-10Axl fluorescence detector (excitation 335 nm/emission 440 nm).
A linear gradient is used (solvent A: acetonitrile/0.1 M sodium phosphate (40/60), pH 3.3; solvent B: acetonitrile/ 0.1 M sodium phosphate (60/40), pH 3.3) and the gradient program is as follows: 100% A to 100% B in 10 min, 100% B for 5 min.
Analyze FB1 standards by HPLC, and peak area measurements are used to generate standard curve. Subsequently, quantify FB1 level in a sample by comparing peak areas with FB1 standard curve.
5. Ergosterol Analysis
Culture the fungus on corn kernels for 7-14 days.
After the incubation period, add 10 ml of chloroform: methanol (2:1, v/v) in each vial. Once added, shake samples well and then incubate vials in the dark at room temperature for 24 hrs.
After 24 hrs, centrifuge the samples, and collect the supernatant and filter it through 0.45 um nylon membrane.
Inject the sample directly into a Shimadzu HPLC LC-20AT system equipped with a 4.6 U ODS-C18 column (200 Å, 250 ± 4.6 mm) and a Shimadzu SPD-20A UV/VIS detector set to monitor at 282 nm.
Use methanol (100%) at a flow rate of 1.5 mL/min as the mobile phase. Determine quantification of ergosterol in samples by comparing peak areas of samples to a standard curve generated from HPLC-grade ergosterol.
6. Representative Results
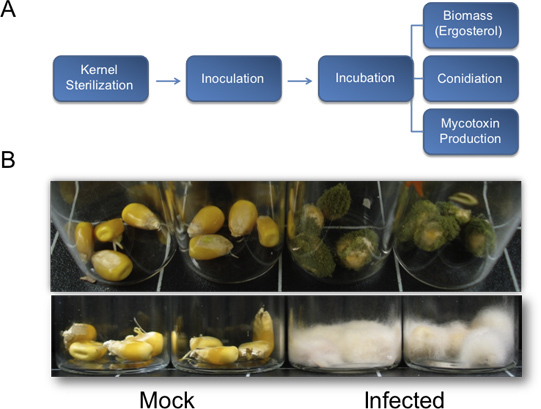
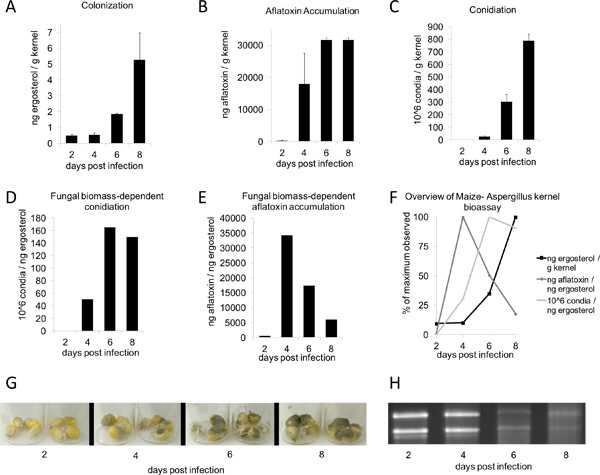
Following inoculation and incubation in a humidity chamber for two to three days, fungal growth should begin to appear on the kernels. Seven days post treatment, vegetative growth on treated plants should be clearly visible, while mock controls should be uninfected (Figure 1B, top). Periods of longer incubation are conducive to more copious vegetative growth (Figure 1B, bottom). Under the conditions described herein (Figure 2G), A. flavus wild-type NRRL 3357 displayed maximum values of colonization, aflatoxin accumulation, and conidia production at 8, 6, and 8 days, respectively (Figure 2, A-C). However, when mycotoxin contamination and conidiation were compared per unit of ergosterol, the greatest levels were observed at 4 and 6 days, respectively (Figure 2, D-E). Figure 2F summarizes these fungal biomass-dependent maximum-value observations. Interestingly, between 4-6 days post-inoculation, the kernels undergo nucleic acid degradation, as seen by total RNA from samples on the time-course (Figure 2H, bottom).
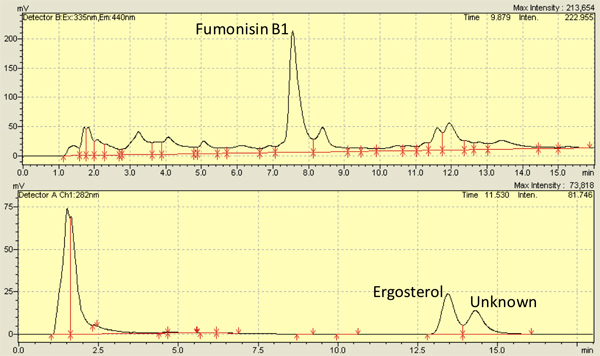
Several studies, including our own, have examined F. verticilliodies infection on maize kernels2,8,9,10,11,12 and successfully used 7-13 days as time-points for observations. Using the methods described herein, fumonisin levels range from 3,500-8,000 ng/g kernel4,13 and ergosterol levels range from 5,000-10,000 ng/g kernel14,13. Figure 3 shows representative peaks for fumonisin (top) and ergosterol (bottom) from HPLC chromatograms. Measurement of ergosterol can also be carried out via absorbance spectra 15 .
 Figure 1. Flow chart for the quantification of fungal biomass, sporogenesis, and mycotoxin production and representative results for vegetative growth from kernel bioassays. A) Flow chart outlining the described method for quantification of fundamental biological parameters used to assess fungal pathogenesis on maize kernels. B) Representative results for kernel bioassays. Top, A. flavus (NRRL3357) vegetative growth on maize kernels in the B73 genetic background. Seeds were inoculated with 200 μl of 106 spores/mL and pictures were taken 7 days post inoculation. Bottom, F. verticillioides inoculated kernels in B73 background 13 days post infection. Kernels were inoculated with 200 μl of 106 spores/mL.
 Figure 2. Aspergillus flavus kernel bioassay time-course. B73 kernels were inoculated with 200 μl of 106 spores/ml Aspergillus flavus conidial suspension and incubated for 2-8 days (G). All values were determined from the dry weight average of 4 kernels (n = 3-4; mean ± SE). A) Colonization (based on ergosterol), (B) aflatoxin, and (C) conidiation were quantified using methods described above. E) Aflatoxin and (F) conidiation are displayed as a function of fungal biomass as measured through h ergosterol. F) Maximum values for ergosterol, aflatoxin accumulation, and conidiation as a function of fungal biomass - maximum values for each quantity observed was set to 100%. (H) 1 μg per lane of total RNA from time-course.
 Figure 3. Representative High Performance Liquid Chromatography (HPLC) chromatograms for fumonisin B1 (top) and ergosterol (bottom) isolated from kernels infected with Fusarium verticillioides (M3125).
Discussion
The methods described here have been tested extensively and proven to be robust in the generation of quantifiable results for fungal colonization, sporogenesis, and production of mycotoxins. Moreover, these methods should be applicable to seeds from other plant species that are susceptible to contamination with mycotoxigenic fungi (e.g. peanuts, wheat, cotton, pistachios, etc.). For competent plant-pathogen interaction analyses, it is imperative that the seeds be kept alive. A small wound site on the embryo side of the kernel facilitates infection while maintaining the viability of the seed.
Effectively run kernel assays have been shown to parallel results from the field. In a previous study 4, kernel bioassays showed that lox3-4 mutant lines were more susceptible to aflatoxin contamination than wild-type plants. This outcome was directly in line with results seen from four independent field trials 4. This suggests that kernel bioassays may be effective tools for determining and/or predicting the outcome of plant-pathogen interactions in large-scale settings.
Disclosures
I have nothing to disclose.
Acknowledgments
We would like to thank Brandon Hassett and Carlos Ortiz for their technical assistance. This work was supported by the NSF grants IOB-0544428, IOS-0951272, and IOS-0925561 to Dr. Michael Kolomiets, and by the USDA National Institute of Food and Agriculture (NIFA), AFRI Plant Breeding and Education Grant #2010-85117-20539 to Drs. Seth Murray, Thomas Isakeit, and Michael Kolomiets.
References
- Tsitsigiannis DI, Keller NP. Oxylipins as developmental and host-fungal communication signals. Trends Microbiol. 2007;15:109–118. doi: 10.1016/j.tim.2007.01.005. [DOI] [PubMed] [Google Scholar]
- Gao X, Shim W-B, Göbel C, Kunze S, Feussner I, Meeley R, Balint-Kurti P, Kolomiets M. Disruption of a maize 9-lipoxygenase results in increased resistance to fungal pathogens and reduced levels of contamination with mycotoxin fumonisin. Mol. Plant-Microbe Interact. 2007;20:922–933. doi: 10.1094/MPMI-20-8-0922. [DOI] [PubMed] [Google Scholar]
- Brodhagen M, Tsitsigiannis DI, Hornung E, Goebel C, Feussner I, Keller NP. Reciprocal oxylipin-mediated cross-talk in the Aspergillus - seed pathosystem. Mol. Microbiol. 2008;67:378–391. doi: 10.1111/j.1365-2958.2007.06045.x. [DOI] [PubMed] [Google Scholar]
- Gao X, Brodhagen M, Isakeit T, Brown SH, Göbel C, Betran J, Feussner I, Keller NP, Kolomiets MV. Inactivation of the lipoxygenase ZmLOX3 increases susceptibility of maize to Aspergillus spp. Mol. Plant-Microbe Interact. 2009;22:222–231. doi: 10.1094/MPMI-22-2-0222. [DOI] [PMC free article] [PubMed] [Google Scholar]
- Gao XQ, Kolomiets MV. Host-derived lipids and oxylipins are crucial signals in modulating mycotoxin production by fungi. Toxin Rev. 2009;28:79–88. [Google Scholar]
- Mukherjee M, Kim J-E, Park Y-S, Kolomiets MV, Shim W-B. Regulators of G protein signaling in F. verticillioides mediate differential host-pathogen responses on non-viable versus viable maize kernels. Mol. Plant Pathol. 2011;12:479–491. doi: 10.1111/j.1364-3703.2010.00686.x. [DOI] [PMC free article] [PubMed] [Google Scholar]
- Zheng MZ, Richard JL, Binder J. A review of rapid methods for the analysis of mycotoxins. Mycopathologia. 2006;161:261–273. doi: 10.1007/s11046-006-0215-6. [DOI] [PubMed] [Google Scholar]
- Bacon CW, Bennett RM, Hinton DM, Voss KA. Scanning electron microscopy of Fusarium moniliforme within asymptomatic maize kernels and kernels associated with equine leukoencephalomalacia. Plant Dis. 1992;76:144–148. [Google Scholar]
- Munkvold GP, Hellmich RL, Rice LG. Comparison of fumonisin concentrations in kernels of transgenic Bt maize hybrids and nontransgenic hybrids. Plant Dis. 1999;83:130–138. doi: 10.1094/PDIS.1999.83.2.130. [DOI] [PubMed] [Google Scholar]
- Sagaram US, Shaw BD, Shim W-B. Fusarium verticillioides GAP!, a gene encoding a putative glycolipid-anchored surface protein, participates in conidiation and cell wall structure but not virulence. Microbiol. 2007;153:2850–2861. doi: 10.1099/mic.0.2007/007708-0. [DOI] [PubMed] [Google Scholar]
- Shim W-B, Flaherty JE, Woloshuk CP. Comparison of Fumonisin B1 biosynthesis in maize germ and degermed kernels by Fusarium verticillioides. J. Food Protect. 2003;66:2116–2122. doi: 10.4315/0362-028x-66.11.2116. [DOI] [PubMed] [Google Scholar]
- Shim W-B, Woloshuk CP. Regulation of fumonisin B1 biosynthesis and conidiation in Fusarium verticillioides by a cyclin-like (C-type) gene, FCC1. Appl. Environ. Micrbiol. 2001;67:1607–1612. doi: 10.1128/AEM.67.4.1607-1612.2001. [DOI] [PMC free article] [PubMed] [Google Scholar]
- Christensen SA. Conversation with: Won-Bo Shim. 2011. Jul 1,
- Shin J-H, Shim W-B. Characterization of PPR1 and PPR2, genes encoding regulatory subunits of protein phosphatase 2A in Fusarium verticillioides. Phytopathol. 2009;99:S119. [Google Scholar]
- Breivik ON, Owades JL. Spectrophotometric Semimicrodetermination of Ergosterol in Yeast. Yeast. Agric. and Food Chem. 1957;5:360–363. [Google Scholar]


