

Abstract
Background
Obesity and arterial stiffness are associated, but fat distribution patterns may be more strongly related to arterial stiffness than general obesity because of the possible increased inflammation associated with increased abdominal adiposity. The aims of this study were to examine whether fat patterning is associated with arterial stiffness, and determine whether these associations are mediated by low-grade inflammation.
Methods
Adult participants from the Fels Longitudinal Study (228 males and 254 females) were assessed for brachial-ankle pulse wave velocity (BaPWV) to determine arterial stiffness. Dual energy X-ray absorptiometry was used to estimate fat percentage of the trunk and legs (e.g., TRUNKFAT% and LEGFAT%). High-sensitivity C-reactive protein (hs-CRP) levels were assayed as a general marker of inflammation. General linear regression analyses were used.
Results
BaPWV was positively associated with TRUNKFAT% (r = 0.44 in men and r = 0.38 in women), whereas it was inversely related to LEGFAT% (r = −0.40 in men and r = −0.39 in women). In multiple regression analyses, each SD increase in TRUNKFAT% was associated with an ~1.03 m/s increase in BaPWV in both men and women. Each SD increase in LEGFAT% was related to a similar magnitude of decrease (1.03 m/s) in BaPWV in both sexes. The relationships of TRUNKFAT% and LEGFAT% with BaPWV were attenuated slightly when including hs-CRP in the models, but remained significant.
Conclusions
We found that trunk and leg fat are related to BaPWV in opposite directions when total body adiposity was accounted for. However, the associations between regional fat patterning and arterial stiffness did not appear to be mediated by low-grade inflammation.
American Journal of Hypertension, advance online publication 12 July 2012; doi:10.1038/ajh.2012.92
Keywords: arterial stiffness, blood pressure, fat patterning, hypertension, inflammatory marker, regional adipose tissue, subclinical cardiovascular disease
Obesity is a significant independent risk factor for cardiovascular disease (CVD) and other co-morbidities including insulin resistance. Total body obesity (usually indicated by body mass index) is consistently associated with increased risk of CVD and adverse subclinical atherosclerosis measurements of arterial structure and function.1,2 Recent studies have focused on understanding the mechanisms and pathways of how specific adipose tissue depots or regional fat distribution patterns impact cardiometabolic risk and subclinical measures of CVD risk.3,4
Arterial stiffness assessed by pulse wave velocity (PWV) is regarded as a reproducible marker and independent predictor for atherosclerosis, cardiovascular risk and future CVD events.5,6 High PWV values suggest increased rigidity and low distensibility of vascular walls, along with poor vascular function including increased systolic and pulse blood pressure (BP).7 However, the mechanisms involved in the pathophysiology of arterial stiffness with obesity are not clearly understood. Some suggest that increased systemic inflammation because of obesity may play an important role in development of arterial stiffness. A few studies have shown C-reactive protein (CRP) levels to be associated with arterial stiffness measures in apparently healthy and obese individuals,8,9 however not all studies have reached the same conclusion.10 Greater total body adiposity measured by body mass index or by dual energy X-ray absorptiometry (DXA) is related to arterial stiffness.11 Regional fat patterns, such as the android body shape, may be more strongly related to arterial stiffness than general obesity. Measures of abdominal adiposity such as waist circumference, visceral adiposity tissue, and trunk fat, have been reported to be positively related to arterial stiffness,2,12 even after adjusting for total body adiposity. A small number of studies have also demonstrated that greater fat mass distributed in appendicular sites (e.g., legs), which is indicative more of a gynoid body shape, appears to be beneficial or protective against subclinical atherosclerosis or CVD as compared with central obesity.4
The aim of this study was to examine whether body fat patterns, i.e., high trunk fat and/or low leg fat, as measured by DXA, are associated with arterial stiffness in 482 predominantly white adults participating in the Fels Longitudinal Study. We hypothesized that trunk fat and leg fat will be differentially associated with arterial stiffness and these associations will be mediated by markers of low-grade inflammation.
Methods
Study population. The sample for the study is a sub-sample of Fels Longitudinal Study participants. The Fels Longitudinal Study began in 1929 and is the oldest continuous study of growth, development and aging in the world. The Fels Longitudinal Study has an extensive amount of body composition data spanning the lifespan for over 1,200 children and adults. From December 2006 to December 2010, 753 adults visited the Lifespan Health Research Center, Wright State University Boonshoft School of Medicine to undergo body composition assessment and laboratory exams. Participants were excluded if they were at high risk of complications for the measurement such as venous thrombosis or previous history of coronary heart disease. For the pulse wave velocity study, 550 participants (73.0% of 753) were measured using the VP-1000, Vascular Profiling system (Omron Healthcare, Schaumburg, IL). Of the 550 participants, 484 participants had complete body composition assessment using DXA. Sixty-six participants without DXA data were too heavy to be assessed because of weight limitations of the DXA device, and two had an error occur during DXA measurement (e.g., movement), resulting in a total sample of 482 participants (age range: 18–92 years) with complete data available for the study. Approximately 53% of participants were women, and 98% were non-Hispanic whites. The research protocol was approved by the Wright State University Institutional Review Board for Human Subjects Research and informed consent from each participant was obtained before testing.
Measurements
Brachial-ankle pulse wave velocity. Brachial-ankle PWV (BaPWV) was assessed twice using an automated noninvasive BP measurement device (VP-1000, Omron Healthcare) on the basis of the oscillometric method.13 After 15 min of supine rest before the assessment, four limb occlusion cuffs (connected to a plethysmographic sensor and oscillometric sensors) were placed on the participant's arms and ankles to record the pulse waveform of pressure for 10 s. The body distances between the aortic root (suprasternal notch) and the brachium and between the aortic root and the posterior tibial artery were calculated according to the participant's height.14 On the basis of the foot-to-foot interval of waveforms at the oscillometric cuffs, the pulse transit time between right arm and right ankle, and between right arm and left ankle were calculated. Then the PWV across two arterial segments was determined by dividing body distances by the time traveled over the segment (m/s). A second measurement was taken after 3-min rest following the first measurement. The correlation coefficient between right and left BaPWV was >0.97. Although both measures were comparable, we used BaPWV from the right side in the present study to represent arterial stiffness.14 The coefficients of variation for inter-observer variability and test–retest reliability were 12.5% and 1.4%, respectively.
DXA. Body composition was assessed by DXA using the Hologic QDR 4500A densitometer (Ver 12.7, Hologic, Bedford, MA) following the manufacturer's protocol. The total body scan was analyzed to yield measures of bone, fat, and lean tissue for particular body regions (e.g., arms, legs, or trunk). The measures of fat patterning were calculated as regional body fat mass (e.g., trunk) divided by total body fat to determine relative fat percentage; (i) trunk fat percentage (TRUNKFAT%) calculated from trunk fat divided by total body fat mass, (ii) leg fat percentage (LEGFAT%) calculated from leg fat divided by total body fat mass, and (iii) the ratio of leg to trunk fat mass (Leg-to-Trunk fat).15
Other measurements. Weight, and stature were measured following the Anthropometric Standardization Reference Manual.16 Body mass index was calculated from body weight and stature (kg/m2). A sample of venous blood was drawn from participants in the morning after an overnight fast (> 8 h). Fasting high-sensitivity (hs) CRP levels were measured using latex immunonephelometry at LabCorp (Dublin, OH). Seated, resting brachial BP was obtained through a standardized protocol using a mercury sphygmomanometer. Three measurements of systolic and fifth phase diastolic BP were taken and the average of the last two measures was used for analysis. A history of chronic medical conditions and use of prescription medications were collected by questionnaire. Hypertension was defined as self-reported physician-diagnosed hypertension, or the use of anti-hypertensive medication at the time of examination. Diabetes mellitus was defined as self-reported physician-diagnosis, or use of anti-diabetic medications or insulin. Cigarette smoking (coded as current vs. former/never) was also assessed by self-reported questionnaire. Participants who reported smoking cigarettes, cigars, or pipes were coded as current-smokers.
Statistical analysis. All statistical analyses were conducted using SAS statistical software package 9.2 for Windows (SAS Institute, Cary, NC). The significance level for statistical tests were set at α = 0.05 (two-tailed). Continuous variables, such as BaPWV, were checked for normality and transformed (e.g., log transformation) if necessary. Descriptive characteristics of participants were presented as mean and SD, or number and percentage, as noted. Students' t-tests or nonparametric tests were used to examine sex differences in the study variables. As there were significant sex differences in BaPWV and body composition measures, analyses were conducted in a sex-stratified manner. The unadjusted relationships among log transformed BaPWV ((log)BaPWV), hs-CRP levels, and indicators of fat patterning were examined using sex-specific Pearson product correlation coefficient analysis. In the sex-stratified multivariable linear regression models, (log)BaPWV was used as a dependent variable to ensure that the assumption of the normality of the residuals in linear regression models was met.
To examine the relationships of fat patterning indicators (i.e., TRUNKFAT%, LEGFAT%, or Leg-to-Trunk fat ratio), regression models were adjusted for covariates such as age, total body composition measures (fat mass and fat free mass), systolic BP, heart rate, current smoking and diabetes status (Model 1). Results from the regression analyses were reported as standardized regression coefficients. Multi-collinearity among fat patterning indicators and covariates was examined and the models were determined to be stable and not disturbed by multi-collinearity. In a separate set of regression models (Model 2), in addition, we adjusted for (log)hs-CRP levels. Further, mediation analysis based on linear regression (Baron–Kenny procedure)17 using a nonparametric bootstrap (i.e., 1,000 re-samples) approach was conducted using the MEDIATION package in R (http:/cran.r-project.org).18 The mediating role of hs-CRP levels between fat patterning variables and BaPWV was supported if: (i) fat patterning indicators significantly explained variation in hs-CRP levels, (ii) fat patterning significantly explained the variance in BaPWV, and (iii) hs-CRP levels significantly explained variation in BaPWV when controlling for fat patterning, and the effect of fat patterning on BaPWV was significantly reduced when hs-CRP levels were simultaneous included in the model with fat patterning as a predictor of BaPWV.
Results
Sample characteristics are presented in Table 1. The mean age was 44.3 ± 16.8 years. The median value of BaPWV was 13.0 m/s with a range of 8.4–30.8. Mean height, fat free mass, TRUNKFAT%, systolic BP, and diastolic BP were significantly higher in men as compared with women. Whereas, fat mass, LEGFAT%, and Leg-to-Trunk fat ratio were significantly higher in women as compared with men (all P values <0.001). Approximately 4% of our samples were diabetics, and men had a higher prevalence of type 2 diabetes. There were significant differences in arterial stiffness (P value = 0.013) and hs-CRP (P value = 0.002) between men and women. Men had a significantly higher BaPWV, whereas women had significantly higher hs-CRP levels.
Table 1.
Descriptive characteristics of study sample
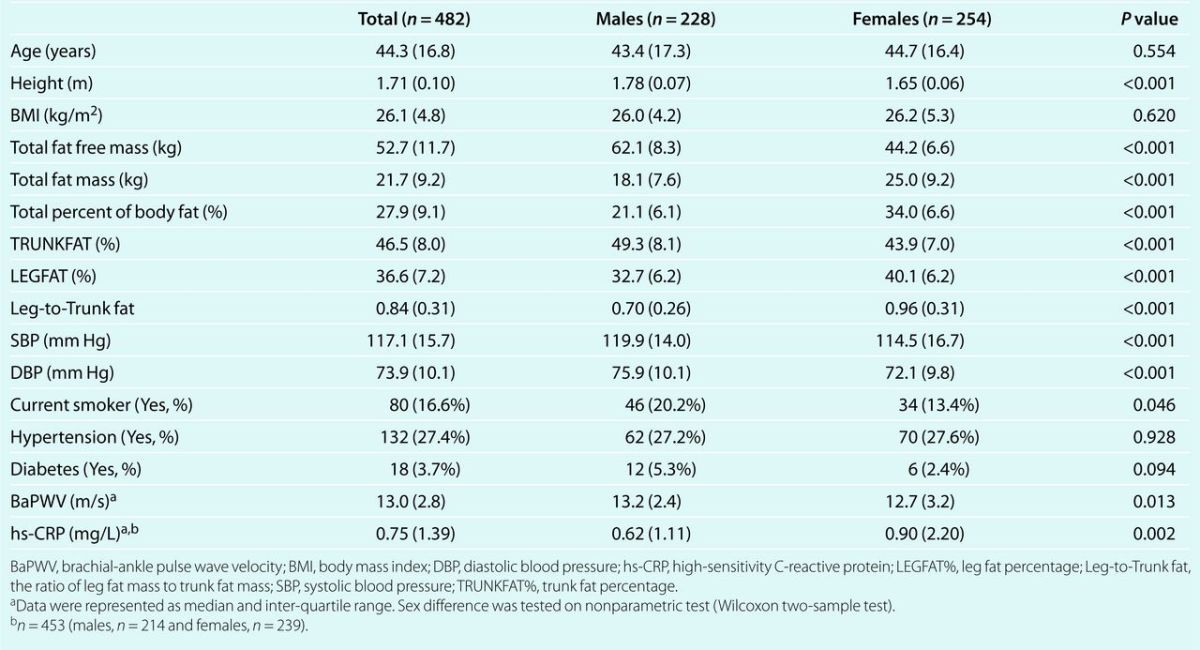
Table 2 shows unadjusted correlations among total body fat, indicators of fat patterning, hs-CRP levels, and BaPWV. Variables describing total body or abdominal adiposity were positively associated with (log)BaPWV in both sexes, except for body mass index among women (all P values <0.05). Conversely, increased LEGFAT% and Leg-to-Trunk fat ratio was significantly associated with decreased (log)BaPWV (all P values <0.05). The inflammatory marker, (log)hs-CRP levels, was positively correlated with both whole body and trunk adiposity, while inversely correlated to leg fat.
Table 2.
Bivariate relationships among indicators of fat patterning, hs-CRP and BaPWV in men and women
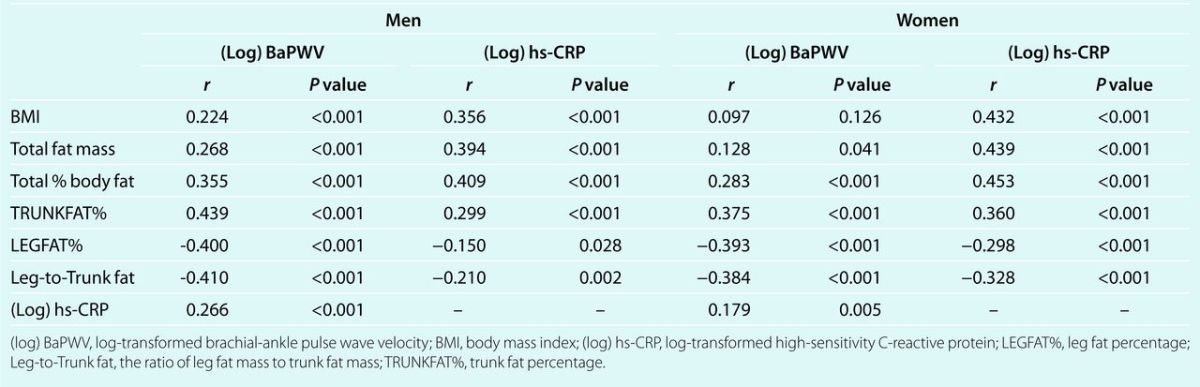
Table 3 demonstrates the relationships between indicators of fat patterning and (log)BaPWV in men and women in multivariable regression analyses. Higher TRUNKFAT% was significantly associated with increased (log)BaPWV after adjusting for age, age2, systolic BP, total fat free mass, total fat mass, heart rate, diabetes and current smoking status (Model 1, P values <0.05). On the other hand, lower LEGFAT% or higher Leg-to-Trunk fat ratio was significantly related to increased (log)BaPWV. Log-transformed hs-CRP was significantly associated with arterial stiffness in all models in men, the relationship of fat patterning with (log)BaPWV was attenuated slightly, but remained significant in all models after further adjustment for (log)hs-CRP (Model 2). In men, each SD increase in TRUNKFAT% was related to a 1.031 m/s increase in predicted BaPWV (following back-transformation from log scale). Each SD increase in LEGFAT% was associated with a 1.027 m/s decrease in predicted BaPWV with all other covariates held constant. In women, there was no significant association between total body composition measures (total body fat mass or fat free mass) with arterial stiffness, but fat patterning indicators were independently related to (log)BaPWV (P values <0.001). The pattern of relationships between fat patterning indicators and arterial stiffness was similar in women as in men. However, hs-CRP levels were not significantly related to (log)BaPWV after adjusting for covariates. Each SD increase in TRUNKFAT% was associated with an ~1.030 m/s increase in predicted BaPWV, whereas each SD increase in LEGFAT% was associated with a 1.028 m/s decrease in women.
Table 3.
Independent associations of indicators of fat patterning and log-transformed BaPWV in men and women
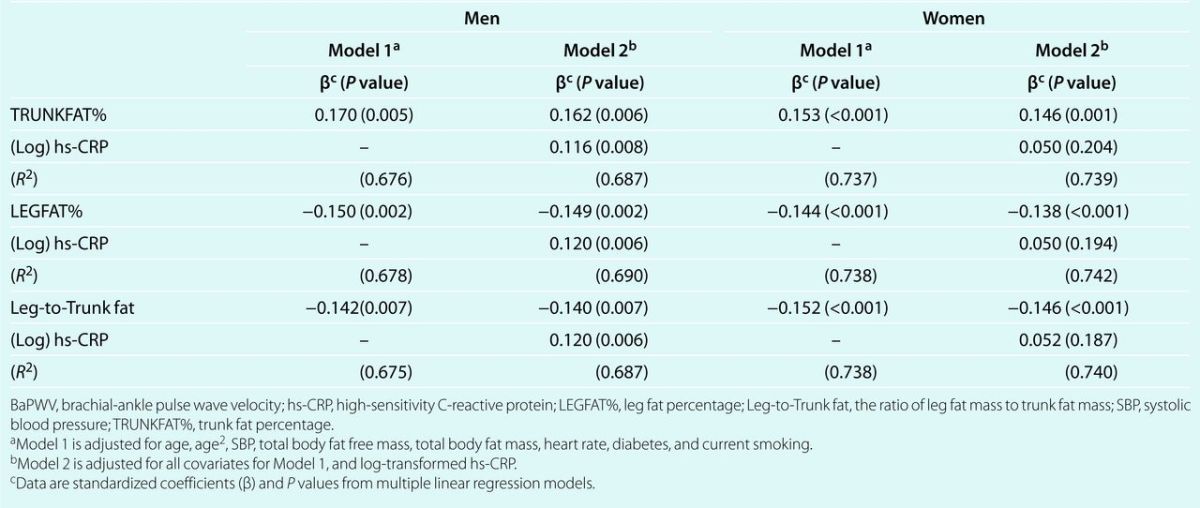
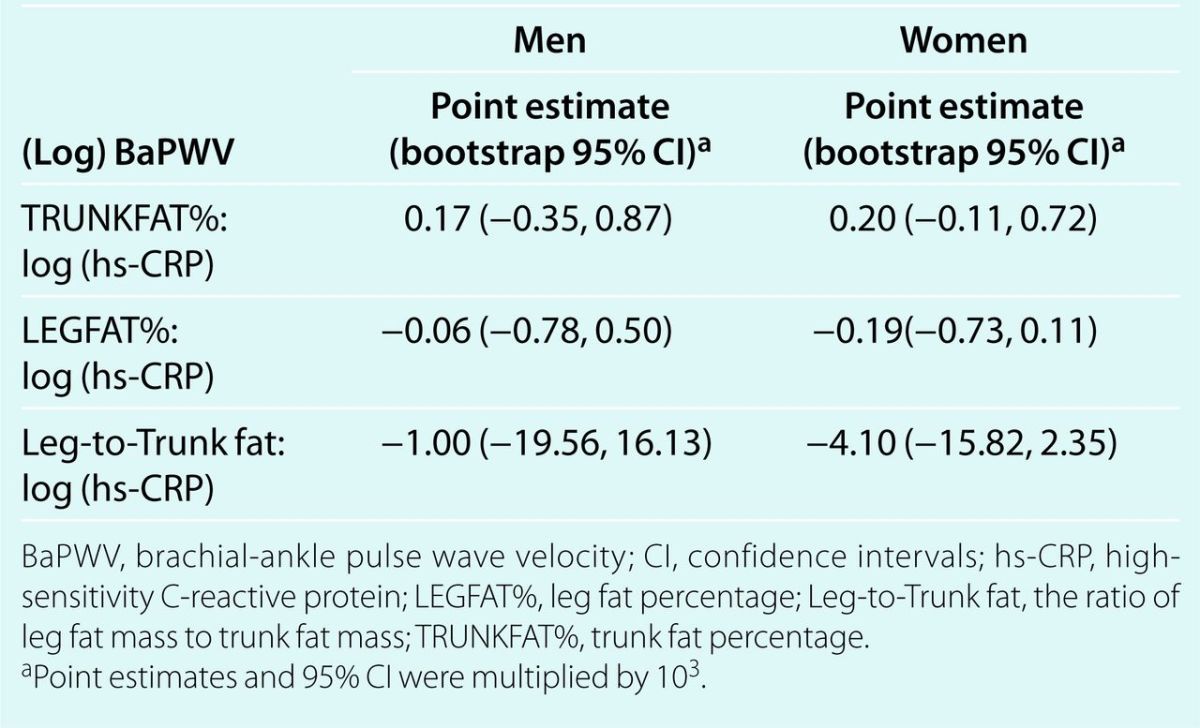
Table 4 describes the possible mediating role of hs-CRP on the relationships between indicators of fat patterning and peripheral arterial stiffness. On the basis of the results of mediation analysis through nonparametric bootstrap approximation, the mediating role of hs-CRP between regional fat patterning indicators and BaPWV was not supported. The mediation effects were small and the 95% confidence intervals included “zero” for all models. For example, the mediation effect of (log)hs-CRP on TRUNKFAT% and BaPWV was very small with a point estimate of 0.17 × 10⁻³ (95% confidence intervals: −0.35 × 10⁻³, 0.87 × 10⁻³) in men.
Table 4.
Testing mediation role of hs-CRP on the effects of fat patterning on log-transformed BaPWV in men and women
Discussion
Our study demonstrated that fat patterning indicators were associated with arterial stiffness. In addition, we found that significant relationships between fat patterning indicators and arterial stiffness were not likely mediated by low-grade inflammation in a sample of predominantly white adults over a wide age range.
Arterial stiffness may occur as a result of natural physiological processes (e.g., aging) as well as pathophysiological processes such as atherosclerosis,11 and may be predictive of CVD mortality and morbidity.5,19,20 Carotid-femoral PWV, a measure of aortic stiffness, has been significantly associated with increased risk for subclinical disease and CVD mortality.5,20 Although aortic PWV is considered the gold standard measure, recent studies also support the use of another index of arterial stiffness measured between the brachial and posterior tibial arterials (i.e., BaPWV). As a measure of peripheral arterial stiffness, BaPWV encompasses a broader arterial tree including the distances between the aortic root to the brachium and between the aortic root to the posterior tibia.13,14,21 BaPWV appears to be well correlated with aortic stiffness measures.20,22 It is also significantly related to cardiovascular structure and function and future cardiovascular events14,23 and is predictive of future cardiovascular events.24,25
We should note, however, that BaPWV and aortic PWV (e.g., carotid-femoral PWV) measures are not interchangeable. Our study corroborates previous work showing adverse effects of trunk fat and protective effects of leg fat on peripheral arterial stiffness measures.4 In previous studies in the elderly, higher trunk fat mass was associated with various measures of higher peripheral arterial stiffness such as distensibility coefficients or compliance coefficients measured at carotid and femoral arteries although there was no significant association between trunk fat mass and central arterial stiffness measures. Greater leg fat mass was also inversely associated with arterial stiffness.4 Compared with other studies, it is noteworthy that in the present study, the differential associations between regional fat patterning and arterial stiffness remain consistent even after adjustment for age, and total body composition including fat and total body lean mass. Our study sample includes not only middle aged to older adults, but also young adults, a relatively understudied group in terms of arterial stiffness.26 In addition, we included total body fat and lean mass measured by DXA as covariates in regression models in order to adjust for general adiposity and lean mass which is likely to be associated with BaPWV.
The mechanisms underlying associations between fat patterning and arterial stiffness are not well understood. It is now well-established that adipose tissue is an active endocrine organ secreting many signaling factors including inflammatory cytokines, such as TNF-α and adipokines such as adiponectin.27 Further, there is some evidence that different fat depots (e.g. omental vs. femoral-gluteal adipose tissue) are metabolically distinct in their production of adipocytokines and in lipolysis, and may have opposing effects on cardiovascular risk.28–30 Subcutaneous adipose tissue, particularly femoral or gluteal adipose tissues are likely to exhibit different metabolic processes or lipolysis than abdominal adipose tissue. Because of the limitation of the DXA technology, it was not possible to distinguish subcutaneous fat from intermuscular adipose tissue, or intramuscular fat in the thigh in the present study. It has, however, been demonstrated that most fat stored in the leg is composed of subcutaneous adipose tissue rather than intermuscular adipose tissue.31 Therefore, it is likely that subcutaneous adipose tissue in the leg, or high LEGFAT% is most likely to contribute to the negative association between leg fat and peripheral arterial stiffness.32,33
Several epidemiologic studies have investigated the independent relationship of CRP with arterial stiffness.8,10 However, the mechanism explaining the opposite relationships of trunk fat and leg fat mass on inflammatory markers and possibly further arterial stiffness remains to be explained. Our results demonstrate opposite effects of regional fat depots on inflammatory markers, (i.e., hs-CRP) supporting the results of recent studies conducted in white and Chinese populations.26,34 However, we found that hs-CRP levels which indicate low-grade inflammation in the body appear not to mediate the relationships between regional fat depots and arterial stiffness in the present study. CRP levels explained a small proportion of the relationships, only in men. This finding is similar to the results by Snijder et al.4 Further, the mediation analysis demonstrated that hs-CRP did not play a significant role in the relationships. To our knowledge, our study is the first to indicate that regional fat patterning is associated with arterial stiffness independent of general obesity, and that the relationship is not mediated by low-grade inflammation as measured by hs-CRP.
It is important to note that this study has some limitations. This study is based on a cross-sectional analysis so it is not feasible to establish a causal association between fat patterning and arterial stiffness based on our data. Longitudinal studies of regional fat depots and arterial stiffness are scarce, but further study on changes in peripheral arterial stiffness and regional fat distribution has begun in our study. Also, our examination of the role of inflammation is based on only one marker (i.e., hs-CRP). Other cytokines or adipocytokines may play a more important role in the process of arterial stiffening.4,35 For instance, leptin levels were reported to mediate the positive relationship between trunk fat mass by DXA and aortic PWV in the Baltimore Longitudinal Study of Aging.35 Therefore, the lack of mediating effect by hs-CRP would not entirely exclude the possible mediating role of other inflammatory markers on the relationships between regional obesity and arterial stiffness. In addition, the study sample is mainly composed of European-Americans (whites), so the results may not be generalizable to different ethnic/racial groups. Finally, because participants with vascular complications, history of CVD, or excessive weight (a limitation associated with DXA) were excluded in the present study, it is possible that we underestimated true relationships between regional fat patterning and arterial stiffness or the effect of mediation by hs-CRP on the observed relationships between fat patterning and arterial stiffness. Our results are, therefore, generalizable only to relatively healthy individuals.
In summary, we have found that TRUNKFAT% was positively associated with arterial stiffness assessed as BaPWV, whereas LEGFAT% was inversely related to arterial stiffness. This suggests that regional body fat patterning indicators are differentially associated with arterial stiffness independent of total fat or even of lean mass. Interestingly, the relationship between regional fat depots and arterial stiffness was not explained by mediation of elevated hs-CRP levels. Our study results and others on fat patterning and arterial stiffness may provide important insights for prevention and intervention strategies in weight loss. Other studies have shown that weight loss was related to arterial destiffening.12,36 Therefore, targeted weight loss of the trunk or abdominal fat, while protecting fat loss in the lower body (leg), may lead to improvements in cardiovascular health. Future studies are warranted to examine prospective relationships between changes in fat patterning and subclinical measures of CVD and to identify other potential mechanisms linking fat patterning and arterial stiffness.
Acknowledgments
This study was supported by National Institutes of Health grant (HD012252) and American Heart Association Beginning Grant-In-Aid (0665256B). This study was presented in part as a poster at the American Heart Association Epidemiology Council Annual Meeting in 2011. We are thankful for the participants in the Fels Longitudinal Study and the assistance of our research staff for their long-time commitment and dedication.
Diclosure
The authors declared no conflict of interest.
References
- 1.Wildman RP, Farhat GN, Patel AS, Mackey RH, Brockwell S, Thompson T, Sutton-Tyrrell K. Weight change is associated with change in arterial stiffness among healthy young adults. Hypertension 2005;45:187–192 [DOI] [PubMed] [Google Scholar]
- 2.Czernichow S, Bertrais S, Oppert JM, Galan P, Blacher J, Ducimetière P, Hercberg S, Zureik M. Body composition and fat repartition in relation to structure and function of large arteries in middle-aged adults (the SU.VI.MAX study). Int J Obes (Lond) 2005;29:826–832 [DOI] [PubMed] [Google Scholar]
- 3.Hu G, Bouchard C, Bray GA, Greenway FL, Johnson WD, Newton RL, Jr, Ravussin E, Ryan DH, Katzmarzyk PT. Trunk versus extremity adiposity and cardiometabolic risk factors in white and African American adults. Diabetes Care 2011;34:1415–1418 [DOI] [PMC free article] [PubMed] [Google Scholar]
- 4.Snijder MB, Flyvbjerg A, Stehouwer CD, Frystyk J, Henry RM, Seidell JC, Heine RJ, Dekker JM. Relationship of adiposity with arterial stiffness as mediated by adiponectin in older men and women: the Hoorn Study. Eur J Endocrinol 2009;160:387–395 [DOI] [PubMed] [Google Scholar]
- 5.Mitchell GF, Hwang SJ, Vasan RS, Larson MG, Pencina MJ, Hamburg NM, Vita JA, Levy D, Benjamin EJ. Arterial stiffness and cardiovascular events: the Framingham Heart Study. Circulation 2010;121:505–511 [DOI] [PMC free article] [PubMed] [Google Scholar]
- 6.Kobayashi K, Akishita M, Yu W, Hashimoto M, Ohni M, Toba K. Interrelationship between non-invasive measurements of atherosclerosis: flow-mediated dilation of brachial artery, carotid intima-media thickness and pulse wave velocity. Atherosclerosis 2004;173:13–18 [DOI] [PubMed] [Google Scholar]
- 7.O'Rourke MF, Hashimoto J. Mechanical factors in arterial aging: a clinical perspective. J Am Coll Cardiol 2007;50:1–13 [DOI] [PubMed] [Google Scholar]
- 8.Nagano M, Nakamura M, Sato K, Tanaka F, Segawa T, Hiramori K. Association between serum C-reactive protein levels and pulse wave velocity: a population-based cross-sectional study in a general population. Atherosclerosis 2005;180:189–195 [DOI] [PubMed] [Google Scholar]
- 9.Yasmin BJ, McEniery CM, Wallace S, Mackenzie IS, Cockcroft JR, Wilkinson IB. C-reactive protein is associated with arterial stiffness in apparently healthy individuals. Arterioscler Thromb Vasc Biol 2004;24:969–974 [DOI] [PubMed] [Google Scholar]
- 10.Schumacher W, Cockcroft J, Timpson NJ, McEniery CM, Gallacher J, Rumley A, Lowe G, Smith GD, Wilkinson IB, Ben-Shlomo Y. Association between C-reactive protein genotype, circulating levels, and aortic pulse wave velocity. Hypertension 2009;53:150–157 [DOI] [PubMed] [Google Scholar]
- 11.Safar ME, Czernichow S, Blacher J. Obesity, arterial stiffness, and cardiovascular risk. J Am Soc Nephrol 2006;17:S109–S111 [DOI] [PubMed] [Google Scholar]
- 12.Lee JW, Lee HR, Shim JY, Im JA, Kim SH, Choi H, Lee DC. Viscerally obese women with normal body weight have greater brachial-ankle pulse wave velocity than nonviscerally obese women with excessive body weight. Clin Endocrinol (Oxf) 2007;66:572–578 [DOI] [PubMed] [Google Scholar]
- 13.Yamashina A, Tomiyama H, Takeda K, Tsuda H, Arai T, Hirose K, Koji Y, Hori S, Yamamoto Y. Validity, reproducibility, and clinical significance of noninvasive brachial-ankle pulse wave velocity measurement. Hypertens Res 2002;25:359–364 [DOI] [PubMed] [Google Scholar]
- 14.Sugawara J, Hayashi K, Yokoi T, Cortez-Cooper MY, DeVan AE, Anton MA, Tanaka H. Brachial-ankle pulse wave velocity: an index of central arterial stiffness? J Hum Hypertens 2005;19:401–406 [DOI] [PubMed] [Google Scholar]
- 15.Demura S, Sato S. Nonlinear relationships between visceral fat area and percent regional fat mass in the trunk and the lower limbs in Japanese adults. Eur J Clin Nutr 2008;62:1395–1404 [DOI] [PubMed] [Google Scholar]
- 16.Lohman TG, Roche AF, Martorell R. (eds). Anthropometric Standardization Reference Manual. Human Kinetics Publishers: Champaign, 1988 [Google Scholar]
- 17.Baron RM, Kenny DA. The moderator-mediator variable distinction in social psychological research: conceptual, strategic, and statistical considerations. J Pers Soc Psychol 1986;51:1173–1182 [DOI] [PubMed] [Google Scholar]
- 18.Imai K, Keele L, Tingley D, Yamamoto T. Causal Mediation Analysis Using R. In Vinod HD. (ed), Advances in Social Science Research Using R (Lecture Notes in Statistics/Lecture Notes in Statistics – Proceedings) 1st edn. Springer: New York, 2010, pp 129–154 [Google Scholar]
- 19.Sutton-Tyrrell K, Najjar SS, Boudreau RM, Venkitachalam L, Kupelian V, Simonsick EM, Havlik R, Lakatta EG, Spurgeon H, Kritchevsky S, Pahor M, Bauer D, Newman A; Health ABC Study Elevated aortic pulse wave velocity, a marker of arterial stiffness, predicts cardiovascular events in well-functioning older adults. Circulation 2005;111:3384–3390 [DOI] [PubMed] [Google Scholar]
- 20.McEniery CM, Spratt M, Munnery M, Yarnell J, Lowe GD, Rumley A, Gallacher J, Ben-Shlomo Y, Cockcroft JR, Wilkinson IB. An analysis of prospective risk factors for aortic stiffness in men: 20-year follow-up from the Caerphilly prospective study. Hypertension 2010;56:36–43 [DOI] [PubMed] [Google Scholar]
- 21.Urbina EM, Williams RV, Alpert BS, Collins RT, Daniels SR, Hayman L, Jacobson M, Mahoney L, Mietus-Snyder M, Rocchini A, Steinberger J, McCrindle B. Noninvasive assessment of subclinical atherosclerosis in children and adolescents: recommendations for standard assessment for clinical research: a scientific statement from the American Heart Association. Hypertension 2009;54:919–950 [DOI] [PubMed] [Google Scholar]
- 22.Nagasaki T, Inaba M, Kumeda Y, Hiura Y, Yamada S, Shirakawa K, Ishimura E, Nishizawa Y. Central pulse wave velocity is responsible for increased brachial-ankle pulse wave velocity in subclinical hypothyroidism. Clin Endocrinol (Oxf) 2007;66:304–308 [DOI] [PubMed] [Google Scholar]
- 23.Yu WC, Chuang SY, Lin YP, Chen CH. Brachial-ankle vs carotid-femoral pulse wave velocity as a determinant of cardiovascular structure and function. J Hum Hypertens 2008;22:24–31 [DOI] [PubMed] [Google Scholar]
- 24.Takase H, Dohi Y, Toriyama T, Okado T, Tanaka S, Sonoda H, Sato K, Kimura G. Brachial-ankle pulse wave velocity predicts increase in blood pressure and onset of hypertension. Am J Hypertens 2011;24:667–673 [DOI] [PubMed] [Google Scholar]
- 25.Nakamura M, Yamashita T, Yajima J, Oikawa Y, Sagara K, Koike A, Kirigaya H, Nagashima K, Sawada H, Aizawa T; Shinken Database Study Group Brachial-ankle pulse wave velocity as a risk stratification index for the short-term prognosis of type 2 diabetic patients with coronary artery disease. Hypertens Res 2010;33:1018–1024 [DOI] [PubMed] [Google Scholar]
- 26.Wu H, Qi Q, Yu Z, Sun Q, Wang J, Franco OH, Sun L, Li H, Liu Y, Hu FB, Lin X. Independent and opposite associations of trunk and leg fat depots with adipokines, inflammatory markers, and metabolic syndrome in middle-aged and older Chinese men and women. J Clin Endocrinol Metab 2010;95:4389–4398 [DOI] [PubMed] [Google Scholar]
- 27.Berg AH, Scherer PE. Adipose tissue, inflammation, and cardiovascular disease. Circ Res 2005;96:939–949 [DOI] [PubMed] [Google Scholar]
- 28.Yim JE, Heshka S, Albu JB, Heymsfield S, Gallagher D. Femoral-gluteal subcutaneous and intermuscular adipose tissues have independent and opposing relationships with CVD risk. J Appl Physiol 2008;104:700–707 [DOI] [PMC free article] [PubMed] [Google Scholar]
- 29.Arner P. Differences in lipolysis between human subcutaneous and omental adipose tissues. Ann Med 1995;27:435–438 [DOI] [PubMed] [Google Scholar]
- 30.Tan GD, Goossens GH, Humphreys SM, Vidal H, Karpe F. Upper and lower body adipose tissue function: a direct comparison of fat mobilization in humans. Obes Res 2004;12:114–118 [DOI] [PubMed] [Google Scholar]
- 31.Goodpaster BH, Thaete FL, Kelley DE. Thigh adipose tissue distribution is associated with insulin resistance in obesity and in type 2 diabetes mellitus. Am J Clin Nutr 2000;71:885–892 [DOI] [PubMed] [Google Scholar]
- 32.Beasley LE, Koster A, Newman AB, Javaid MK, Ferrucci L, Kritchevsky SB, Kuller LH, Pahor M, Schaap LA, Visser M, Rubin SM, Goodpaster BH, Harris TB; Health ABC study Inflammation and race and gender differences in computerized tomography-measured adipose depots. Obesity (Silver Spring) 2009;17:1062–1069 [DOI] [PMC free article] [PubMed] [Google Scholar]
- 33.Koster A, Stenholm S, Alley DE, Kim LJ, Simonsick EM, Kanaya AM, Visser M, Houston DK, Nicklas BJ, Tylavsky FA, Satterfield S, Goodpaster BH, Ferrucci L, Harris TB; Health ABC Study Body fat distribution and inflammation among obese older adults with and without metabolic syndrome. Obesity (Silver Spring) 2010;18:2354–2361 [DOI] [PMC free article] [PubMed] [Google Scholar]
- 34.Khera A, Vega GL, Das SR, Ayers C, McGuire DK, Grundy SM, de Lemos JA. Sex differences in the relationship between C-reactive protein and body fat. J Clin Endocrinol Metab 2009;94:3251–3258 [DOI] [PMC free article] [PubMed] [Google Scholar]
- 35.Windham BG, Griswold ME, Farasat SM, Ling SM, Carlson O, Egan JM, Ferrucci L, Najjar SS. Influence of leptin, adiponectin, and resistin on the association between abdominal adiposity and arterial stiffness. Am J Hypertens 2010;23:501–507 [DOI] [PMC free article] [PubMed] [Google Scholar]
- 36.Dengo AL, Dennis EA, Orr JS, Marinik EL, Ehrlich E, Davy BM, Davy KP. Arterial destiffening with weight loss in overweight and obese middle-aged and older adults. Hypertension 2010;55:855–861 [DOI] [PMC free article] [PubMed] [Google Scholar]