

Abstract
Study Objectives:
The objective of this secondary analysis was to evaluate concurrent validity of actigraphy and polysomnography (PSG) in older women with insomnia.
Methods:
Concurrent validity of actigraphy and PSG was examined through (1) comparison of sleep outcomes from each recording method; (2) calculation of sensitivity, specificity, accuracy, and predictive values from epoch-by-epoch data; and (3) statistical and graphical exploration of the relationship between sleep disturbance severity and concordance of actigraphy and PSG. Subjects were 16 community-dwelling older women (mean age 69.4 ± 8.1) with insomnia who underwent 8 nights of concurrent actigraphy and PSG.
Results:
Sleep efficiency reflected much greater sleep disturbance on PSG (66.9%) than actigraphy (84.4%). Based on generalized linear models, the parameter estimates for agreement between actigraphy and PSG were statistically significant (p < 0.05) for total sleep time and sleep latency, verged on significance for WASO (p = 0.052), but was not significant for sleep efficiency (p = 0.20). Epoch-by-epoch analysis showed high sensitivity (96.1%), low specificity (36.4%), and modest values on agreement (75.4%) and predictive values of sleep (74.7%) and wake (80.2%). Generalized linear models showed that overall accuracy of actigraphy declined as sleep efficiency declined (unstandardized Beta = 0.741, p < 0.001). Based on this model, sleep efficiency of 73% was the point at which accuracy declined below an acceptable accuracy value of 80%.
Conclusions:
Actigraphy offers a relatively inexpensive and unobtrusive method for measuring sleep, but it appears to underestimate sleep disturbance, particularly at sleep efficiency levels below 73%, in older women with insomnia.
Citation:
Taibi DM; Landis CA; Vitiello MV. Concordance of polysomnographic and actigraphic measurement of sleep and wake in older women with insomnia. J Clin Sleep Med 2013;9(3):217-225.
Keywords: Actigraphy, sleep, insomnia, aging, sleep initiation and maintenance disorders
For assessment of insomnia, it is useful to have objective as well as subjective sleep measures. Persons with insomnia commonly report perceptions of more severe sleep disturbance than is apparent on objective sleep measures.1 Comparison of such subjective-objective differences is important for research on the etiology and subtypes of insomnia, as well as for tailoring cognitive-behavioral treatments. Actigraphy has gained acceptance as a cost-effective alternative to polysomnography; however, evidence is needed on the validity of actigraphy devices, and on accuracy of the measure in various clinical populations.
Polysomnography (PSG) remains the gold-standard to objectively measure sleep. The major disadvantages of PSG are participant burden (sleeping in a laboratory setting, wearing numerous sensors) and cost (equipment and staff for recording and visual scoring of records). By comparison, actigraphy is an attractive measure with much lower participant burden and cost. It allows measurement of 24-hour rest-activity data with minimal intrusiveness to the participant. The set-up of an actigraph recording is simple, requiring only computerized initialization of the device and placement on the wrist; scoring of the data is also simpler than PSG. Despite these practical advantages, actigraphy is not a substitute for PSG. It provides a measure of behavior but does not provide data on traditional sleep stages, quantitative measures of EEG, or respiration and muscle activity during sleep.
BRIEF SUMMARY
Current Knowledge/Study Rationale: Actigraphy is an attractive measure with much lower participant burden and cost than polysomnography. Before using actigraphy with a clinical population, it is important to study the validity of the specific device to be used in that population.
Study Impact: This study showed that actigraphy may not accurately reflect the magnitude of sleep disturbance in persons with severe insomnia and should be interpreted by clinicians accordingly. Furthermore, a low threshold for wake detection when using the sleep scoring algorithms in Actiware 5 software yielded most valid data of the three possible settings when compared to polysomnography.
The American Academy of Sleep Medicine (AASM) recommends use of actigraphy as an adjunct measure in several conditions including circadian rhythm disorders, insomnia, hypersomnia, and obstructive sleep apnea.2,3 Although PSG is not recommended in the assessment of insomnia,3 it remains the criterion against which the validity of actigraphy is tested. Thorough validation of actigraphy remains insufficient or lacking in samples with varied demographic characteristics (particularly age and sex), health conditions, and sleep disorders.4 There is reason to examine actigraph validity specifically in older women versus general samples of persons with insomnia. Women have higher rates of insomnia across the lifespan,5 and the likelihood of insomnia is up to 50% higher in older women than older men.6,7 It is common for persons with insomnia to lie in bed while awake,8 a behavior that could potentially lead to misclassification of inactive wake time as sleep on actigraphy. This direction of actigraphy error has been shown in younger populations.9,10 Given that women across the lifespan are more likely to experience insomnia, it is possible that older women are habituated to being awake during the night, and thus more likely to lie still when awake,11 resulting in over-identification on sleep by actigraphy.
In our randomized trial of valerian effects on sleep in older women with insomnia,12 we noted that actigraphy sleep outcomes represented better sleep quality than PSG. For example, we found mean sleep efficiency on PSG was 66.91% ± 12.89%, and on the same nights it was 89.79% ± 3.80% on actigraphy. Therefore, the objectives of this secondary analysis of actigraphy and polysomnography data in the older women from our study of valerian were: (1) to explore differences between acti-graphic and PSG estimates of sleep outcomes (total sleep time, sleep efficiency, wake after sleep onset, and sleep latency); (2) to examine the concurrent validity of actigraphy and PSG based on epoch-by-epoch analysis of sensitivity, specificity, accuracy, and predictive values for sleep and wake; and (3) to statistically and graphically explore whether the severity of sleep disturbance affects the validity of actigraphy compared to PSG.
METHODS
Design
This study was a secondary analysis of data from a randomized, double-blinded crossover study of valerian for older women with insomnia.12 The original study included 2 phases with 8 nights of concurrent PSG and actigraphy. The original study and secondary analysis were approved by the University of Washington Human Subjects Institutional Review Board.
Study Sample
This secondary analysis includes all 16 participants from the original study sample. These women were recruited from the greater Seattle community between November 2004 and February 2006. Qualifying participants were aged 55-80, ≥ 5 years post-menopause, with scores > 5 on the Pittsburgh Sleep Quality Index ([PSQI] indicating overall disturbed sleep)13 and scores < 22 on the Insomnia Severity Index ([ISI] ≥ 22 indicates severe insomnia).14 Sleep disturbance was confirmed at baseline by a 2-week sleep diary (≥ 30-min sleep onset latency or wake after sleep onset for ≥ 3 nights per week and a daytime complaint), and participants underwent one night of screening PSG to exclude those with an undiagnosed sleep disorder (sleep disordered breathing or periodic limb movement disorder). Women with confounding medical and psychiatric conditions were excluded (see Taibi12 for full inclusion/exclusion criteria).
The mean age of participants was 69.4 ± 8.1 years. The participants were mostly well-educated (81% attended college or graduate school) and married (69%). All but one of the participants racially identified as white/Caucasian. Several participants had minor comorbidities (e.g., arthritis), but none had major illnesses. The sample means for self-reported sleep disturbance were 8.8 ± 2.3 on the PSQI and 11.1 ± 3.9 on the ISI.
Polysomnography and Actigraphy Data Collection
Actigraphy
Actigraphy was measured using the Actiwatch-64 (Philips Respironics, Andover, MA). These devices are piezoelectric accelerometers about the size of a watch and are worn on the wrist. The Actiwatch-64 accelerometer is omnidirectional, detecting movement on all planes. Actiwatch activity counts represent both the occurrence and magnitude of arm movements. Actiwatch-64s are programmed with a calibration coefficient that minimizes variation in activity counts between different Actiwatches, thus minimizing instrument-related error. Movement data were sampled at a rate of 32 Hz, and activity counts were recorded in 30-sec epochs, the same epoch length used in PSG recordings and scoring.
Time in bed (TIB) was the time between lights out and lights on as recorded in the sleep laboratory. These times were manually entered into Actiware 5.57 software (Philips Respironics, Andover, MA) and were identical to the PSG and analyses. Mean TIB for each night was 473 min (SD 52 min, range 347-580 minutes). Each epoch was scored as sleep or wake by applying a standard mathematical algorithm, and sleep outcomes were obtained using Actiware 5.57 software (Philips Respironics, Andover, MA). Sleep onset and offset were scored as the first/last 10 min of the sleep record scored as sleep with ≤ 1 epoch scored as wake. Sleep outcomes included total sleep time (TST), sleep efficiency (total sleep time/time in bed*100), wake after sleep onset (WASO), and sleep latency (time between going to bed and sleep onset defined as 10 min with ≤ 1 epoch of wake).
Polysomnography Recording Procedures
The full procedures for PSG recordings are reported in Taibi et al.12 Participants completed 9 nights of PSG recording over 4 visits to the Sleep Research Laboratory (2-3 nights per visit). Actigraphs were not worn on the first PSG night, which served as screening for sleep disordered breathing and periodic limb movement disorder. Participants with evidence of these sleep disorders were excluded from further participation. Subsequently, concurrent PSG and actigraphy were recorded for 2 consecutive nights at the beginning and end of 2 study phases, resulting in 8 total nights of concurrent actigraphy and PSG measurement from each participant. All nights of concurrent actigraphy and PSG were recorded on weeknights.
Electrodes for recording the electroencephalography, electrooculogram, and electromyogram were placed according to standard criteria.15 Signals from these leads were digitized and recorded using the EMBLA Somnologica 3.1.2 data acquisition system (EMBLA, Denver, CO). Sleep and wake stages were scored in 30-sec epochs according to the standard criteria of Rechtschaffen and Kales.15 TIB was the time between lights out and lights on as recorded in the sleep laboratory. Sleep variables were computed with a locally developed software program and included TST, sleep efficiency (total sleep time/time in bed*100), WASO, and sleep onset latency (time from lights out to first epoch of stage 2 sleep).
Actigraphy and Polysomnography Processing for Analysis
Fourteen participants had concurrent actigraphy and PSG data available from all 8 study nights that were used in the analysis. Two participants had only 4 nights of actigraphy data available for use in the analysis because of actigraph battery failure, resulting in a total of 120 nights of data used in the analysis.
Immediately before initializing the actigraph and PSG recordings, all computers were synchronized to the National Institute of Standards and Technology (NIST) atomic clock time to ensure alignment of actigraphy and PSG epochs. Each scored PSG record was exported from Somnologica as a text file and imported into SPSS 15.0 (SPSS Inc., Chicago, IL) for analysis. Epoch-by-epoch PSG data were dichotomized to binary form (0 = wakefulness, 1 = any stage of sleep).
Actigraphy data were exported from Actiware 5.57 to comma-separated data files and imported into SPSS for analysis. The data for each epoch were automatically scored (0 = wake, 1 = sleep) in Actiware prior to export. Designation of each epoch as sleep or wake is based on a scoring algorithm that weights activity in the immediate and adjacent 2 min of epochs (where E = epoch, E-x = activity within preceding epochs, and E+x = activity within subsequent epochs): E*2 + 0.2*(E+1 + E+2 + E-1 + E-2) + 0.04*(E+3 + E+4 + E-3+ E-4).16 Each epoch was scored as wake if the algorithm resulted in a score at or above a predetermined threshold; epochs below the threshold were designated as sleep. Actiware includes 3 threshold levels for designating wake: low threshold = 20, medium threshold = 40, and high threshold = 80. Some authors refer to thresholds as “sensitivity” levels for wake detection (low threshold = high sensitivity, high threshold = low sensitivity). We use the term threshold to avoid confusion with calculated sensitivity of actigraphy versus PSG. Given that the low wake-detection threshold would be more likely to score movement epochs as wake, this setting was hypothesized to be most useful in persons with insomnia, who tend to have long periods of wakefulness while lying in bed.8 To test this hypothesis, we compared all 3 sensitivity levels.
Statistical Analyses
The intervention (valerian) was not shown to affect either PSG or actigraphically assessed sleep in the primary study analyses.12 Additionally, no differences between non-treatment (adaptation/placebo) and treatment nights on the validity outcomes were apparent on visual (mean validity outcomes) and statistical (Wilcoxon signed-ranks test) examination. Therefore, treatment was not considered in the present analyses. All statistical analyses were done in SPSS 15.0. Mean values for the sample on all sleep and validity outcomes were calculated within-subject across the whole sample to normalize for 2 subjects having only 4 nights of data.
To explore the agreement between actigraphic and PSG estimates of sleep outcomes, means and standard deviations of the sleep outcomes (total sleep time, sleep efficiency, wake after sleep onset, and sleep latency) are reported from PSG and from actigraphy at low, medium, and high wake-detection thresholds. The relationships of actigraphy values with PSG values on the sleep outcomes were analyzed using generalized linear models for continuous outcomes with mixed effects to account for within-subject repeated measures. Log transformed values of PSG and actigraphic sleep latency were used in the analyses due to the skewed distribution of these data.
To examine concurrent validity based on epoch-by-epoch comparison of actigraphy and PSG, each 30-sec epoch was scored as agreeing (true sleep/true wake) or disagreeing (false sleep = sleep scored on actigraphy but not PSG, false wake = wake scored on actigraphy but not PSG). Sensitivity, specificity, accuracy, and predictive values of the concordance in sleep/wake scoring for PSG and actigraphy were calculated for all study nights. These formulas have been described in previous studies.10,16–18 Sensitivity represents the proportion of the PSG-identified sleep epochs that are identified as sleep by actigraphy (# sleep epochs correctly identified by actigraphy / # PSG-identified sleep epochs). Specificity represents the proportion of the PSG-identified non-sleep (i.e., wake) epochs identified as wake by actigraphy (# wake epochs correctly identified by actigraphy / # PSG-identified wake epochs). Accuracy is the total percentage of PSG epochs (sleep or wake) correctly identified by actigraphy (# sleep or wake epochs correctly identified by actigraphy/total # of epochs). Predictive values were also calculated. These represent the proportion of epochs of actigraphy that are correctly classified. Predictive value for sleep (PVS) was the percent of actigraphic sleep epochs that accorded with PSG sleep, and predictive value for wakefulness (PVW) was the percent of actigraphic wake epochs that accorded with PSG wake. Accuracy values at the 3 thresholds were compared pairwise (low vs. medium, medium vs. high, low vs. high) using generalized linear models with mixed effects to account for within-subject repeated measures. Confidence intervals around the parameter estimate representing agreement of the thresholds were compared for overlap, which would indicate a lack of substantial difference between the thresholds.
The impact of sleep disturbance severity on validity measures was examined statistically and graphically. Generalized linear models, also accounting for within-subject repeated measures, were used to compare PSG sleep efficiency with overall accuracy. Bland-Altman plots for each of the sleep outcomes (TST, sleep efficiency, WASO, and sleep onset latency) were used to examine whether the degree of measurement error varied over the range of measurement. The Bland-Altman approach plots the difference of the 2 measures (e.g., actigraphy sleep efficiency – PSG sleep efficiency) on the y-axis against the mean of the 2 measures (e.g., [actigraphy sleep efficiency + PSG sleep efficiency] / 2) on the x-axis.19 For perfect correspondence of the 2 measures, all data points for measurement difference would fall along zero difference line. If actigraphy is biased toward overestimating the sleep outcome, points fall above the zero line; if it is biased toward underestimating the outcome, points fall below the zero line. If the distance from zero changes over the plot (i.e., the left versus the right side of the graph), this indicates that measurement error varies over the measurement scale. For example, if underestimation of sleep latency were greater for higher levels of sleep latency, the data points would be below the zero line, and increasingly farther from the line towards the right side of the graph (higher sleep latency).
RESULTS
Sleep Outcomes
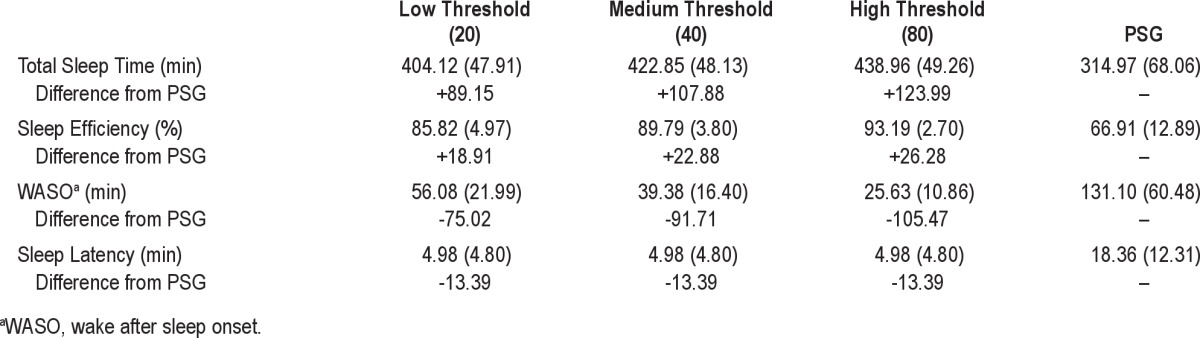
Mean values of the sleep outcomes, including total sleep time, sleep efficiency, WASO, and sleep latency, are shown in Table 1. On examination of the mean values, all 3 actigraphy thresholds differed substantially from PSG. Consistent with our hypothesis, sleep outcomes calculated using the low wake-detection threshold were closest to PSG outcomes. Even at the low threshold, actigraphy resulted in higher TST (+89 min), higher sleep efficiency (+19%), lower WASO (-75 min), and lower sleep latency (-13 min) than were evident on PSG.
Table 1.
Sleep outcomes from actigraphy and polysomnography
Given that the low threshold produced results closest to PSG, we used this setting to examine the relationship between actigraphy and PSG sleep outcomes by generalized linear models (Table 2). Addition of a nonlinear term did not improve the strength or significance of the model parameters; thus only linear analyses are reported. These results showed that agreement between actigraphy and PSG values was significant (p < 0.05) for TST and sleep latency, and verged on significance for WASO (p = 0.052). Sleep efficiency was not significant (p = 0.204). Un-standardized Beta coefficients reflect how much the dependent variable (actigraphy) changes when the independent variable (PSG) changes by 1 unit (e.g., one minute for TST, WASO, and sleep latency, one percentage point for sleep efficiency). A positive Beta coefficient indicates that the variables change in the same direction—that is, as one increases or decreases, the other does the same. A value of 1 would show perfect correspondence between actigraphy and PSG. Sleep latency showed strong agreement, with a Beta coefficient of 0.668 (p < 0.001). Total sleep time and WASO showed weak agreement (β = 0.281 and 0.123, respectively). These Beta coefficients indicate that actigraphy captured only part of the variance in sleep reflected by on PSG. Sleep efficiency showed poor agreement (β = 0.085). Graphical exploration using scatterplots (Figure 1) confirmed that the linear relationships between actigraphy and PSG values were true not only for the entire sample, but also within the majority of individuals.
Table 2.
Generalized linear models comparing sleep outcomes from actigraphy and polysomnography

Figure 1. Scatterplots showing the relationship between actigraphy and PSG sleep outcomes within subjects.

Data points represent a subject on one night of measurement (4-8 data points per subject). Lines represent the within-subject relationship between PSG and actigraphy. The graphs show linear relationships between PSG and actigraphy on total sleep time (A) and WASO (C) within participants. The graph shows a positive linear relationship between PSG and actigraphy on sleep efficiency (B) for most participants, but of low magnitude, as reflected in the nonsignificant results on the generalized linear model analysis. Although the scatterplot and generalized linear model show overall agreement between PSG and actigraphy on sleep latency, the within-subject lines (D) show substantial variability within the sample.
Concordance Outcomes
Sensitivity was high for all 3 actigraphy wake-detection thresholds (low = 96.1% ± 3.0%, medium = 98.1% ± 1.7%, and high = 99.2% ± 0.7%; see Figure 2). Specificity was low at all 3 actigraphy thresholds (low = 36.4% ± 14.0%, medium = 28.1% ± 11.9%, and high = 19.6% ± 9.2%). Overall accuracy was moderate: 75.4% ± 10.2, 74.3% ± 11.3%, and 72.5 ± %12.1% for low, medium, and high thresholds, respectively. Predictive values indicate the proportion of epochs on actigraphy that are correctly classified. Predictive values for sleep (PVS) were moderate at the low, medium, and high wake-detection thresholds, respectively: 74.7% ± 13.6%, 73.0% ± 13.5%; and 71.1% ± 13.4% of the epochs classified as sleep by actigraphy were correct according to PSG. Predictive values for wake (PVW) were strong at the low, medium, and high thresholds; 80.2% ± 12.8%, 86.1% ± 10.6%, 90.5% ± 8.2% of the epochs classified as wake by actigraphy were correct according to PSG.
Figure 2. Concordance of actigraphy and polysomnography.
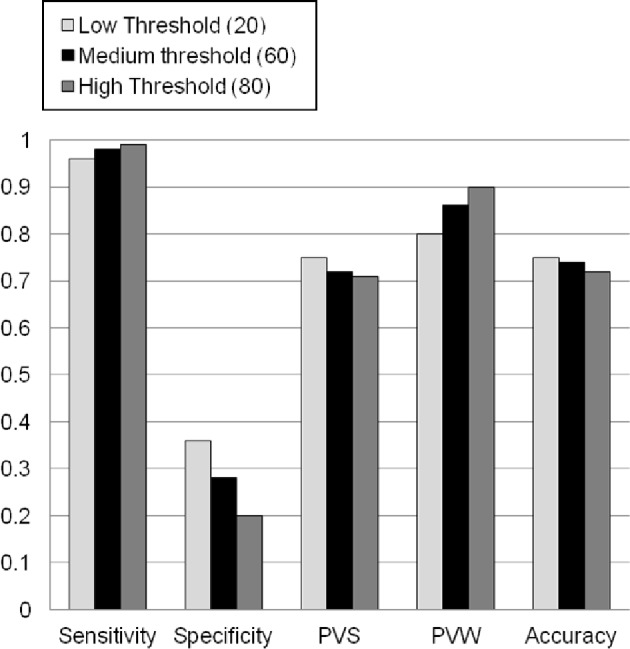
This figure illustrates concordance outcomes at the three wake-detection threshold settings. For all outcomes, zero represents no concordance, and one represents perfect concordance.
Comparison of Validity of the Three Wake-Detection Thresholds
Accuracy values from the three wake-detection thresholds were compared using generalized linear models. Comparisons showed strong agreement between each of the 3 thresholds (low-medium, β = 1.02, 95%CI = 1.00-1.05; medium-high, β = 1.08, 95%CI = 1.05-1.10, low-high, β = 1.10, 95%CI = 1.05-1.14). Overlap of the confidence intervals indicated that that accuracy did not differ significantly between these thresholds.
Impact of Sleep Disruption on Actigraphy Validity
Accuracy Versus PSG Sleep Efficiency
We compared the accuracy of actigraphy (percentage of correctly identified epochs) with PSG sleep efficiency to examine whether it varied depending on the severity of sleep disturbance, as has been reported in other studies.20,21 The generalized linear model was highly significant (p < 0.001, 95%CI = 0.65-0.84). The unstandardized Beta coefficient was 0.74, indicating close correspondence between the reduced sleep efficiency and reduced accuracy of actigraphy. We used the model parameters to calculate that a sleep efficiency level of 73.2% was where accuracy dropped below the generally accepted value of 80%.18 A scatterplot examining the relationship between PSG sleep efficiency and accuracy within participants showed a linear relationship for all participants (Figure 3).
Figure 3. Within-subject relationships between PSG sleep efficiency and actigraph accuracy.

Data points represent a subject on one night of measurement (4-8 data points per subject). In this graph, accuracy (i.e., percentage of epochs on which PSG and actigraphy are in agreement) declined as PSG sleep efficiency declined in all except one participant.
Bland-Altman Plots
Bland-Altman plots were used to examine whether the magnitude of sleep disturbance affected the levels of agreement between actigraphy and PSG on sleep outcomes (Figure 4). These graphs plot the difference between actigraphy and PSG (on the y-axis) against the mean of the 2 measures (on the x-axis). The plots showed clear trends in measurement differences across the range of the measures such that the measurement differences were greater for lower TST, higher WASO, lower sleep efficiency, and longer sleep latency. These findings show that actigraphy corresponded more poorly with PSG as sleep became more disturbed, particularly with larger amounts of time spent awake.
Figure 4. Bland-Altman plots of whole-night sleep outcomes.

The graphs show the difference between actigraphy and PSG (actigraphy value – PSG value) plotted against the mean of actigraphy and PSG on each of the sleep outcome: total sleep time (A), sleep efficiency (B), wake after sleep onset (C), and sleep latency (D). The horizontal reference line represents zero difference between the two recording methods on each outcome. Values above the zero-difference line indicate higher values on actigraphy than PSG (i.e., overestimation by actigraphy); values below the zero-difference line indicate lower values on actigraphy than PSG (i.e., underestimation by actigraphy).
DISCUSSION
In this sample of middle-aged to older women with insomnia, validity analyses revealed statistically significant agreement between actigraphy and PSG on all sleep outcomes except for sleep efficiency. Epoch-by-epoch analysis results showed that actigraphy accurately detected the majority of PSG-identified sleep, indicated by high sensitivity (≥ 96%), but did so by over-classifying PSG-identified wake epochs as actigraphic sleep (reduced PVS, ≤ 75%). Furthermore, actigraphy identified only a small portion of PSG wake (low specificity, ≤ 36%) but tended not to misclassify PSG sleep epochs as wake (high PVW, ≥ 80%).
Consistent with our hypothesis, specificity and overall accuracy were highest at the low wake-detection threshold. Accurate identification of wake appeared to come at the expense of reduced sleep identification: the low wake-detection threshold had lower sensitivity than the other thresholds. Given that actigraphy over-classified sleep, some loss in sleep detection for improved wake detection favors the low threshold in this population. Even at this “best” threshold level, specificity was poor, accuracy was moderate, sleep was overestimated by 89 minutes, and WASO was underestimated by 75 minutes. Overall, these results suggest that actigraphy may underestimate the severity of insomnia in older women with significant sleep disturbance.
We found actigraph validity declined predictably as sleep efficiency declined. Sleep efficiency around 73% was an important cut-point below which actigraphy accuracy fell below the generally accepted value of 80%. This pattern of lower validity in more disturbed sleep was evident within-subjects as well as between-subjects. A decrement in the performance of actigraphy was also apparent on the Bland-Altman plots of the sleep outcomes, which showed greater disagreement between actigraphy and PSG as each outcome reflected poorer sleep. This pattern of poorer performance in persons with worse sleep raises questions concerning the utility of actigraphy in persons with severe insomnia. Given that persons with severe insomnia are expected to experience a degree of sleep disturbance at which actigraphy has been shown to perform poorly, actigraphy may not provide valid measures of sleep in this group.
Our findings regarding sleep and wake identification are consistent with the published literature on actigraph validity in general (see Table 3), and the Actiwatch-64 in particular, which reported underestimation of wake and overestimation of sleep.9,10,16,20–24 Blackwell et al.20 found overestimation of sleep with the SleepWatch-O actigraph (Ambulatory Monitoring Inc, Ardsley, NY) in their sample of older women, but of a lesser degree than that reported here, with a mean overestimation of 17.9 minutes total sleep time. However, their sample from the Study of Osteoporotic Fractures consisted of general community-dwelling older women, not specifically women with insomnia. In the subset of the sample with sleep efficiency levels lower than 70%, overestimation of sleep was more pronounced (mean = +68 minutes). Lichstein et al.,9 who tested the Actiwatch-64 in older men and women with insomnia, also reported a smaller difference between actigraphy and PSG than the present study (TST difference = +14 minutes). Given that our study showed better accuracy at higher levels of sleep efficiency, the higher sleep efficiencies in the Blackwell and Lichstein studies (75.5% and 77.0% versus 66.9% in our study) may explain why those studies showed measurement error in the same direction as that found in our study, but of lesser magnitude.
Table 3.
Actigraph validity research

Our findings were highly congruent with results from Sivertsen and colleagues' study of older men and women with chronic insomnia.24 That study found a similar degree of sleep disturbance as the present study, and also similar magnitudes of differences between actigraphy and PSG on the same four sleep outcomes we tested. Our study augments Sivertsen's findings by showing the same pattern with a different actigraph device (Actiwatch-64 versus Actiwatch Plus, Cambridge Neurotechnology, Ltd., Cambridgeshire, UK). Additionally, Sivertsen et al. reported data for only one night in each of 34 participants for a total of 34 nights, compared to the current study's design of 120 nights in 16 participants. Although our sample is smaller, we measured 4-8 nights and demonstrated similar validity to that found by Sivertsen not only between subjects, but within subjects as well. Finally, Sivertsen et al. found slightly higher PSG-actigraph agreement in women (84%) than in men (81%), but both groups had higher agreement than found in the present study. Thus, it remains unclear whether the accuracy of actigraphy differs in older women versus older men and younger persons with insomnia.
Several studies have presented correlations of actigraphy and PSG sleep outcomes as evidence of the validity of actigraphy: total sleep time r = 0.51-0.93, WASO r = 0.48-0.85, sleep efficiency r = 0.36-0.81, sleep onset latency r = 0.30-0.95.9,20,25–28 These findings indicate that, while there is substantial discrepancy between the measures, they tend to change in the same direction. The unstandardized Beta coefficients from our generalized linear models comparing sleep outcomes show similar results. Given that sleep outcomes from actigraphy tend to change in the same direction as PSG, actigraphy may be useful for measuring treatment-related changes in sleep. Studies have found actigraphy to be sensitive to treatment related changes in sleep, and this use of actigraphy is supported by the AASM practice guideline on actigraphy.2 However, the over-identification of sleep found in this study suggests that the magnitude of changes in sleep may not be fully reflected, especially given that measurement error is greater in more disturbed sleep. Another use of actigraphy beyond measuring sleep outcomes is the clinical characterization of sleep-wake patterns,2 which could be useful for such applications as checking behavioral contributions to sleep disturbance and patient compliance to sleep scheduling.
Overall, the results of this secondary analysis indicate that older women with insomnia may appear to have sleep efficiency that falls within what is considered a “normal range” on actigraphy. However, if actigraphy were to be used as a screening tool, these individuals would be at risk for under-detection of the severity of insomnia. Further, those individuals whose actigraphic measures show disturbed sleep may actually experience greater sleep disturbance than is being detected.
Limitations
This study has several limitations. First, certain aspects of the sample present limitations, including the small sample size which limits the power of the statistical analyses, and the lack of racial/ethnic and gender diversity, which limits the general-izability of the findings to other populations. Second, we tested only one actigraphy device, the Actiwatch-64. This device has been shown to perform comparably to Philips Respironics' newer Actiwatch-2 device,29 but has substantial technical differences from other actigraph manufacturers including the type accelerometer (piezoelectric versus solid state), mode of logging activity (count of threshold crossings, sums of activity occurrences and/or magnitude, time above threshold), and sleep/wake scoring algorithms used. Thus, applicability to other devices cannot be assumed. However, previous studies have shown various actigraphs to have similar functionality and validity,25,30 so it is reasonable to hypothesize that other devices are likely to be subject to the same performance limitations as the device tested in the present analyses.
Conclusions and Implications
It is important for researchers and clinicians to recognize that actigraphy is a useful measure, but it has limitations as a measure of sleep outcomes. Because actigraphy measures movement, confounding factors such as passive movement (e.g., movement of a bed partner), quiescent wakefulness, or periodic limb movements could substantially affect the validity of actigraphy sleep outcomes. The high sensitivity of actigraphy in this sample of women with insomnia appears largely explained by over-identification of sleep, as evidenced by poor specificity. In particular, the accuracy of actigraphy declined below an acceptable level when sleep efficiency was below 73%. The validity of actigraphy for quantifying treatment changes was not addressed by this analysis and requires further research. At present, actigraphy offers a relatively inexpensive and unobtrusive method for examining sleep patterns, but users should select appropriate wake-detection thresholds for the population being tested and should interpret data with recognition that sleep disturbance is most likely underrepresented on actigraphy.
DISCLOSURE STATEMENT
This was not an industry supported study. None of the authors has a financial conflict of interest.
ACKNOWLEDGMENTS
The authors thank Dr. Jerald Hertig for assisting with the statistical analyses. This research was supported by National Institutes of Health (NIH) grant numbers AT002108 (CAL), T32 NR07039-18 (DMT), NR 011400 (Center for Research on the Management of Sleep Disturbance), and NR04011 (Center for Women's Health and Gender Research).
References
- 1.Means MK, Edinger JD, Glenn DM, Fins AI. Accuracy of sleep perceptions among insomnia sufferers and normal sleepers. Sleep Med. 2003;4:285–96. doi: 10.1016/s1389-9457(03)00057-1. [DOI] [PubMed] [Google Scholar]
- 2.Morgenthaler T, Alessi C, Friedman L, et al. Practice parameters for the use of actigraphy in the assessment of sleep and sleep disorders: an update for 2007. Sleep. 2007;30:519–29. doi: 10.1093/sleep/30.4.519. [DOI] [PubMed] [Google Scholar]
- 3.Schutte-Rodin S, Broch L, Buysse D, Dorsey C, Sateia M. Clinical guideline for the evaluation and management of chronic insomnia in adults. J Clin Sleep Med. 2008;4:487–504. [PMC free article] [PubMed] [Google Scholar]
- 4.Martin JL, Hakim AD. Wrist actigraphy. Chest. 2011;139:1514–27. doi: 10.1378/chest.10-1872. [DOI] [PMC free article] [PubMed] [Google Scholar]
- 5.Morin CM, LeBlanc M, Daley M, Gregoire JP, Merette C. Epidemiology of insomnia: prevalence, self-help treatments, consultations, and determinants of help-seeking behaviors. Sleep Med. 2006;7:123–30. doi: 10.1016/j.sleep.2005.08.008. [DOI] [PubMed] [Google Scholar]
- 6.Foley DJ, Monjan AA, Brown SL, Simonsick EM, Wallace RB, Blazer DG. Sleep complaints among elderly persons: an epidemiologic study of three communities. Sleep. 1995;18:425–32. doi: 10.1093/sleep/18.6.425. [DOI] [PubMed] [Google Scholar]
- 7.National Sleep Foundation. 2003 Sleep in America poll. [Internet] 2003 [cited 2012 April 10] Available from: http://www.sleepfoundation.org/sites/default/files/2003SleepPollExecSumm.pdf.
- 8.Perlis ML, Junquist C, Smith MT, Posner D. Cognitive behavioral treatment of insomnia. New York: Springer; 2005. [Google Scholar]
- 9.Lichstein KL, Stone KC, Donaldson J, et al. Actigraphy validation with insomnia. Sleep. 2006;29:232–9. [PubMed] [Google Scholar]
- 10.Pollak CP, Tryon WW, Nagaraja H, Dzwonczyk R. How accurately does wrist actigraphy identify the states of sleep and wakefulness? Sleep. 2001;24:957–65. doi: 10.1093/sleep/24.8.957. [DOI] [PubMed] [Google Scholar]
- 11.Hislop J, Arber S. Understanding women's sleep management: beyond medicalization-healthicization? Sociol Health Illn. 2003;25:815–37. doi: 10.1046/j.1467-9566.2003.00371.x. [DOI] [PubMed] [Google Scholar]
- 12.Taibi DM, Vitiello MV, Barsness S, Elmer GW, Anderson GD, Landis CA. A randomized clinical trial of valerian fails to improve self-reported, polysomnographic, and actigraphic sleep in older women with insomnia. Sleep Med. 2009;10:319–28. doi: 10.1016/j.sleep.2008.02.001. [DOI] [PMC free article] [PubMed] [Google Scholar]
- 13.Buysse DJ, Reynolds CF, 3rd, Monk TH, Berman SR, Kupfer DJ. The Pittsburgh Sleep Quality Index: a new instrument for psychiatric practice and research. Psychiatry Res. 1989;28:193–213. doi: 10.1016/0165-1781(89)90047-4. [DOI] [PubMed] [Google Scholar]
- 14.Bastien CH, Vallieres A, Morin CM. Validation of the Insomnia Severity Index as an outcome measure for insomnia research. Sleep Med. 2001;2:297–307. doi: 10.1016/s1389-9457(00)00065-4. [DOI] [PubMed] [Google Scholar]
- 15.Rechtschaffen A, Kales A. A manual of standardized terminology: techniques and scoring system for sleep stages in human subjects. Los Angeles: UCLA Service/Brain Research Institute; 1968. [Google Scholar]
- 16.Kushida CA, Chang A, Gadkary C, Guilleminault C, Carrillo O, Dement WC. Comparison of actigraphic, polysomnographic, and subjective assessment of sleep parameters in sleep-disordered patients. Sleep Med. 2001;2:389–96. doi: 10.1016/s1389-9457(00)00098-8. [DOI] [PubMed] [Google Scholar]
- 17.Blood ML, Sack RL, Percy DC, Pen JC. A comparison of sleep detection by wrist actigraphy, behavioral response, and polysomnography. Sleep. 1997;20:388–95. [PubMed] [Google Scholar]
- 18.Tryon WW. Issues of validity in actigraphic sleep assessment. Sleep. 2004;27:158–65. doi: 10.1093/sleep/27.1.158. [DOI] [PubMed] [Google Scholar]
- 19.Bland JM, Altman DG. Comparing methods of measurement: why plotting difference against standard method is misleading. Lancet. 1995;346:1085–7. doi: 10.1016/s0140-6736(95)91748-9. [DOI] [PubMed] [Google Scholar]
- 20.Blackwell T, Redline S, Ancoli-Israel S, et al. Comparison of sleep parameters from actigraphy and polysomnography in older women: the SOF study. Sleep. 2008;31:283–91. doi: 10.1093/sleep/31.2.283. [DOI] [PMC free article] [PubMed] [Google Scholar]
- 21.Paquet J, Kawinska A, Carrier J. Wake detection capacity of actigraphy during sleep. Sleep. 2007;30:1362–9. doi: 10.1093/sleep/30.10.1362. [DOI] [PMC free article] [PubMed] [Google Scholar]
- 22.Means M, Edinger JD, Stechuchack KM, Olsen MK, Lineberger MD, Kirby AC. Comparison of sleep assessment devices within groups of sleep disordered patients. Sleep. 2005;28:A319–20. [Google Scholar]
- 23.Colling E, Wright M, Lahr S, et al. A comparison of wrist actigraphy with polysomnography as an instrument of sleep detection in elderly persons. Sleep. 2000;23:A378. [Google Scholar]
- 24.Sivertsen B, Omvik S, Havik OE, et al. A comparison of actigraphy and polysomnography in older adults treated for chronic primary insomnia. Sleep. 2006;29:1353–8. doi: 10.1093/sleep/29.10.1353. [DOI] [PubMed] [Google Scholar]
- 25.Stanley N, Dorling MC, Dawson J, Hindmarch I. The accuracy of Mini-Motion-logger and Actiwatch in the identification of sleep as compared to sleep EEG. Sleep. 2000;23:A386–7. [Google Scholar]
- 26.Means M, Edinger JD, Stechuchack KM, Olsen MK. Comparison of sleep assessmnet devices in a mixed sample of sleep disordered patients: an update. Sleep. 2004;27:A357–8. [Google Scholar]
- 27.Cook KG, Lichstein KL, Donaldson J, Nau SD, Lester KW, Aguillard RN. An exploratory study of actigraphic measures of insomnia. Sleep. 2004;27:A270. [Google Scholar]
- 28.Sanchez-Ortuno MM, Edinger JD, Means MK, Almirall D. Home is where sleep is: an ecological approach to test the validity of actigraphy for the assessment of insomnia. J Clin Sleep Med. 6:21–9. [PMC free article] [PubMed] [Google Scholar]
- 29.Philips Respironics. Andover, MA: Philips Electronics; 2008. Equivalence of activity recordindgs and derived sleep statistics: Actiwatch-64, Actiwatch 2 and Actiwatch Spectrum. [Google Scholar]
- 30.Benson K, Friedman L, Noda A, Wicks D, Wakabayashi E, Yesavage J. The measurement of sleep by actigraphy: direct comparison of 2 commercially available actigraphs in a nonclinical population. Sleep. 2004;27:986–9. doi: 10.1093/sleep/27.5.986. [DOI] [PubMed] [Google Scholar]
- 31.Hedner J, Pillar G, Pittman SD, Zou D, Grote L, White DP. A novel adaptive wrist actigraphy algorithm for sleep-wake assessment in sleep apnea patients. Sleep. 2004;27:1560–6. doi: 10.1093/sleep/27.8.1560. [DOI] [PubMed] [Google Scholar]
- 32.Chang A, Kushida C, Palombini L, et al. Comparison study of actigraphic, polysomnographic, and subjective perception of sleep parameters. Sleep. 1999;22:S43. [Google Scholar]